BTCUSDDaily TF looks to have found support around 107,000 and forming a double bottom with neckline around 110,700. There's also a daily support trendline starting last year in September.
On the H4, waiting for both horizontal and resistance trendline to be broken before looking for buys.
Double Top or Bottom

EURCAD: Another Trend Line Based Opportunity 🇪🇺🇨🇦
EURCAD may continue rising after a test of a solid
rising trend line on a daily.
A formation of a double bottom pattern accompanied by
a bullish Change of Character on an hourly time frame
indicates a strong buying interest.
Goal - 1.6305
❤️Please, support my work with like, thank you!❤️
I am part of Trade Nation's Influencer program and receive a monthly fee for using their TradingView charts in my analysis.

BNBUSDT: Price Rises Up Slowly, Failed To Break The Support!..Hi traders,
BNBUSDT has been ranging up gradually, after it failed to break under the lower zone. there was an assumption of breakdown below this area, based on the chat pattern structure been perceived. As the Bullish range continues, we anticipate $1,312 as potential target.
Meanwhile a breakdown below this support would trigger downside movement.
Like and follow up for more insight on the market.
Thanks for reading.


USDJPY: Price Progressively Heading Towards Resistance ?Hi Teams!
Lets take a perspective on USDJPY, the pair have on bullish momentum for this few days. recently the upward movement own in favor of the buyers, meanwhile there is an expectation of downward moment coming soon.
Key points:
A clear reversal below the resistance would set off a sell signal aiming 149.76 as next possible support.
Like and follow up
Thanks for reading.

XAGUSD End of Bearish Correction.We saw huge sell off from the beginning of the week due to massive profit taking. On Wednesday price closed with bullish pin bar which in 4HR is double bottom a bullish reversal pattern, wait for price to break 49.333 Double bottom Neckline for confirmation.


MAV/USDT; SAFE BUYHello friends
Given the decline that this currency has had, we have found support areas using Fibonacci and have created a double bottom in the specified area and are expecting it to break its trading range and move to the specified targets.
Observe capital and risk management.
*Trade safely with us*

XLMUSDT - This Classic Bearish Setup Could Trap Late LongsYello, Paradisers! Are you prepared for what could be the next leg down in XLMUSDT? Many are still looking for long setups, but this clean bearish formation could catch them completely off guard.
💎XLMUSDT has officially broken below its key ascending support trendline, and price action has since retested this breakdown level—right where it meets a strong resistance zone. This area is further reinforced by the 200 EMA, which has historically acted as a powerful dynamic resistance in trending markets. What adds even more weight to the bearish case is the textbook Double Top-pattern that has formed right at this confluence.
💎To make matters worse for the bulls, we’re seeing clear bearish divergence across multiple indicators, including the MACD, RSI, and Stochastic RSI. When these divergences align with a structural breakdown and a resistance retest, the probability of a bearish continuation significantly increases. This is not the kind of setup smart traders ignore.
💎For those looking to enter this move, aggressive traders could consider a position from the current price area. However, a more disciplined approach would be to wait for a clean pullback into the resistance zone, followed by a clear bearish candlestick confirmation. This not only offers a better entry, but also significantly improves the risk-to-reward ratio by allowing tighter risk placement above the invalidation level.
💎That said, if the price breaks out and closes a full candle above the resistance zone, the current bearish outlook would be invalidated. In that scenario, it would be best to stand aside and wait for clearer price action to develop before making any further decisions. Chasing moves after invalidation is never worth it.
🎖This is how professional traders separate themselves from the crowd—by waiting for high-probability setups and protecting capital when the market proves them wrong. Discipline and timing will always outperform emotion and FOMO in the long run. Stay sharp, Paradisers, and remember: consistency, strategy, and patience are the only way you’ll make it far in this market.
MyCryptoParadise
iFeel the success🌴

Double Top Confirmed! Is Gold About to Fall Deeper?As expected from my previous idea , Gold touched its target of $4,183 ( the double top pattern’s target(Small) ). Before reaching that target, it had some ups and downs over the past few days, mainly due to the ongoing US-China tensions .
Gold is trading near a Support zone($4,193 – $4,156) .
From a classical technical analysis perspective, it’s forming a clear double top pattern on the 1-hour timeframe . There’s also a regular bearish divergence (RD-) visible between the two peaks of the double top.
From an Elliott Wave theory standpoint, it looks like Gold has started its corrective wave. If the Support zone($4,193 – $4,156) and the double top pattern’s neckline break , we can expect further downside .
I expect that after breaking the Support zone($4,193 – $4,156) and the neckline , Gold could drop at least to around $4,083(First Target) .
Second Target: $4,057
Stop Loss(SL): $4,385(Worst)
Note: Keep in mind that given the ongoing US-China tensions, any news could invalidate this analysis. So it’s more important than ever to manage your risk carefully these days.
Please respect each other's ideas and express them politely if you agree or disagree.
Gold Analyze (XAUUSD), 1-hour time frame.
Be sure to follow the updated ideas.
Do not forget to put a Stop loss for your positions (For every position you want to open).
Please follow your strategy; this is just my idea, and I will gladly see your ideas in this post.
Please do not forget the ✅ ' like ' ✅ button 🙏😊 & Share it with your friends; thanks, and Trade safe.

DXY Double Top Rejection Still At PlayThe M formation I spoke about a week ago is still at play, and the gap I anticipated will get filled is still wide open.
I am bearish on DXY until confirmations to go bullish contradict my bias.

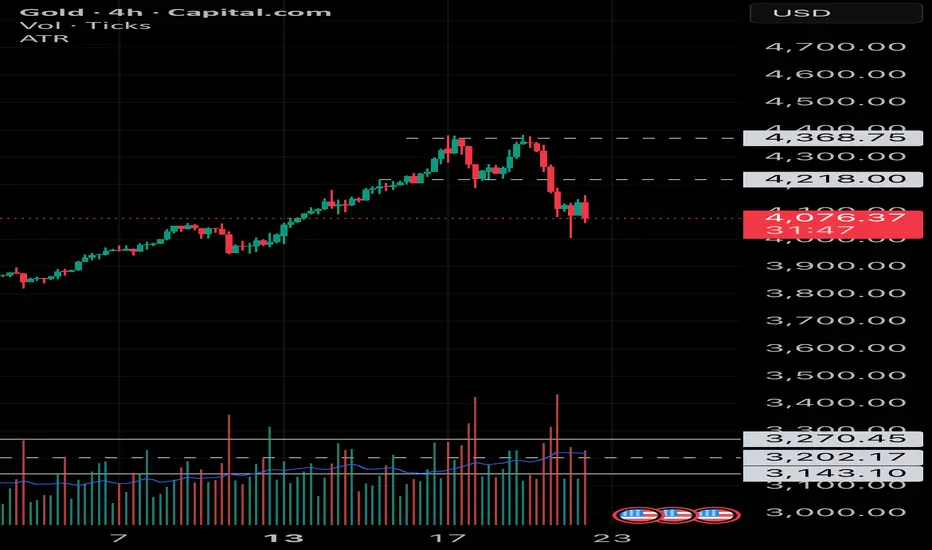
Time to book profits in Gold. Textbook Double Top spotted on 4H.After the terrific rally in Gold, it finally showed first sign of reversal with the double top formation on 4H chart. That is actually 70% of the times a good enough indicator/sign/pattern for a reversal/pause/correction. Thus to book the profits, imo this is the right to take atleast part profits off the table in the range of 4100-4200.
Around 3800-3700 would be a good buying zone.
XAU/USD🪙Gold dropped over 6% on October 21 due to profit-taking and a stronger dollar, but this pullback is healthy after a 60% rally in 2025. At $4,050, the market is likely executing a liquidity grab before resuming its bullish trend toward new highs.🪙
---
📈 Gold Trade Idea – Liquidity Grab Before New Highs📈
Gold experienced a sharp correction on October 21, falling over 6% from its all-time high of $4,382 to around $4,100, marking its largest single-day drop since 2013. This move was driven by profit-taking after an extraordinary rally, alongside a stronger US dollar, improved risk sentiment, and optimism over US-China trade talks.
Despite the volatility, this pullback is not a trend reversal—it’s a healthy correction following a 60% surge in gold prices this year, fueled by economic uncertainty, central bank accumulation, and expectations of interest rate cuts.
Currently, gold is trading around $4,050, a key zone where I anticipate a liquidity grab. This level likely holds clustered stop-losses from late buyers and short-term traders. Once this liquidity is absorbed, I expect gold to resume its bullish momentum, targeting new highs above $4,400.
### 🔍 Why Gold Is Still Bullish:
- Macro uncertainty remains elevated, keeping demand for safe-haven assets strong.
- Central banks continue to accumulate gold, supporting long-term demand.
- Rate cut expectations from the Fed and other central banks reduce opportunity cost for holding gold.
- Technical structure shows a classic retracement after a parabolic move—ideal for continuation setups.
This correction is a textbook example of market mechanics: after a euphoric rally, the market shakes out weak hands before continuing higher. I’m watching for confirmation of support around $4,050 and signs of absorption before entering long.

BTCUSD Triple Bullish ConfluenceI am seeing multiple confirmations for going long on BTC at the moment:
1. An H4 TF Double Bottom Rejection
2. A broken and retested H4 resistance trendline
3. Price has retested that same H4 demand zone 3 times and keeps respesting it.

OOO GOLD IS THAT A DOUBLE TOP?I feel like I see a double top formed on the daily! The real test will come with the fib pull back in the 4249-4255 price range but only price will show us but I think we are seeing a key area for gold and If I had to choose I would say we may be heading for a minor pullback to let off some steam and also take some par profits!
Let me know yall thoughts tho and what do you think! GD luck tomorrow, I cant wait for the NY session.

Gold at a CrossroadShort-Term View:
Gold (XAUUSD) has recently bounced from the $4,100 zone after a sharp decline, and is now testing the first resistance area at $4,185–$4,200, which coincides with the 50-period SMA on the 15-minute chart.
If the price fails to break and close above this zone, the current move may only be a technical pullback before another drop. In that case, $4,075 → $4,000 would be the next potential downside targets.
Medium-Term Outlook:
If bulls manage to reclaim and hold above $4,200, short-term sentiment could shift bullish again, opening the way for a move toward $4,260 → $4,310. However, price action remains vulnerable as long as gold trades below $4,300, the key structural pivot.
Risk Levels:
• Bullish Scenario: Entry above $4,200, stop loss $4,110, target $4,300.
• Bearish Scenario: Sell below $4,100, stop loss $4,185, targets $4,000 and $3,950.
Summary:
Gold is at a critical short-term decision zone. A clean break above $4,200 could fuel a short-term rally, but rejection from this level would likely trigger another leg down.


Double Bottom. Bullish continuation.Upward trend following possible end of government shutdown and lower interest rates later in the month.

GN Sells might be near-termFrom top-down analysis, GN is positioned to retrace a low after being rejected in a weekly high. Here is how I am positioned to follow the trade

AUDNZDDaily resistance zone around 1.14000 is still keeping price down since it crossed below in 2013. Every time price gets here it's pushed down with pressure. Daily TF has printed a double top just like it did in October 2022. There's an H4/H1 support at the moment, once broken we could see downward movement to 1.11500 which was the last daily resistance that was broken.


Gold appears to have peaked.Gold double top on the 4 hrly + broken down through the green 50 SMA line.
Rotation into crypto next?

Gold Double Top Forming – Correction Ahead?When an asset hits an All-Time High(ATH) , technical analysis can get a bit tricky because there’s no historical resistance above and the usual technical rules might have less impact. However, right now it seems like some technical principles are still visible on gold’s chart, at least on the 1-hour timeframe , and I’d like to share that with you.
At the moment, Gold has broken below the lower line of its ascending channel, the Support zone($4,320 – $4,279) , and the neckline of a Double Top Pattern . This could indicate the start of a short-term correction. Given how strong gold’s momentum has been in recent weeks, this correction might not last too long since gold remains very attractive globally.
From an Elliott Wave perspective , the formation of a double top pattern might signal the end of an impulsive wave and the beginning of a corrective phase .
I expect that in the next few hours, Gold could at least drop to the Double Top Pattern’s target around $4,183 . If Gold breaks the Support zone($4,193 – $4,156) , we could see a deeper correction .
Second target:$4,143
Stop Loss(SL): $4,385(Worst)
Please respect each other's ideas and express them politely if you agree or disagree.
Gold Analyze (XAUUSD), 1-hour time frame.
Be sure to follow the updated ideas.
Do not forget to put a Stop loss for your positions (For every position you want to open).
Please follow your strategy; this is just my idea, and I will gladly see your ideas in this post.
Please do not forget the ✅ ' like ' ✅ button 🙏😊 & Share it with your friends; thanks, and Trade safe.
