Understanding ELLIOT WAVES ---a technical B waveJust wanted to share this part of the chart because it was pretty hard to see live — it formed on a very low timeframe. I’m posting it on the 15-minute since TradingView won’t let me publish anything lower, but I’ll drop it down and link the lower timeframes below so you can see more of the detail.
This is today’s Ethereum move. I was waiting for the bullish breakout and got in right at the low because I spotted the B wave setup forming. The B wave is the cipher — it tells you where you are within the Elliott structure if you know how to read it.
In this case, the B wave formed a big expanding triangle. You could also map it as an internal ABC inside the B itself. It was a very technical structure, so I wanted to post it to show how a complex B wave can look in real time. Recognizing these patterns helps a lot when you’re tracking the transition from correction to impulse.
FOLLOW AND COMMENT FOR MORE ELLIOT WAVE EXAMPLES AND LESSONS
Double Top or Bottom

Bitcoin is forming a double bottom pattern on the 4H chartBitcoin CRYPTOCAP:BTC is forming a classic double bottom pattern on the 4H chart, signaling a potential reversal.
The neckline sits around 104,594, that’s the key level bulls need to break. Until that neckline is broken, there’s nothing to see here.
If it breaks and confirms with volume, the target points toward 110,000, which could open the door for a much larger move.

EURGBP: Top Formation, More Opportunity Of Short.EURGBP is on a current downward move, forming a partial double Top pattern as been displayed in the structure. the pair intends to continues its bearish after indicating the top formation. also the bigger time frames reflects to sell possibility.
Meanwhile a clear breakdown below this top support would persist the downward movement.
Key points:
Price eyes 0.8673 as next potential support.
Happy new week.
Thanks for reading.

1980 Redux? SILVER set to Outshine the NYSE Composite.Has Silver set the stage to approach its all time high's versus the "Big Index" that was last seen close to 50 years ago.?
Why this chart is spectacular:
Silver has moved sharply higher this year, breaching it's historic $50 threshold, a feat last seen in 1980 and 2011.
Notable the Silver/US Equities ratio (using the TVC:NYA as a broad proxy) is forming a multi year bottom structure. Suggesting we are in the process of a powerful repricing from equities to commodities.
This is not a crash call on Stocks.
Simply put Metals and commodities are just likely be faster horses and receive higher capital allocations.
We've seen the Big short during the GFC.
We've seen Saylor's Big long trade on #BTC
is Silver the Big Reversal?

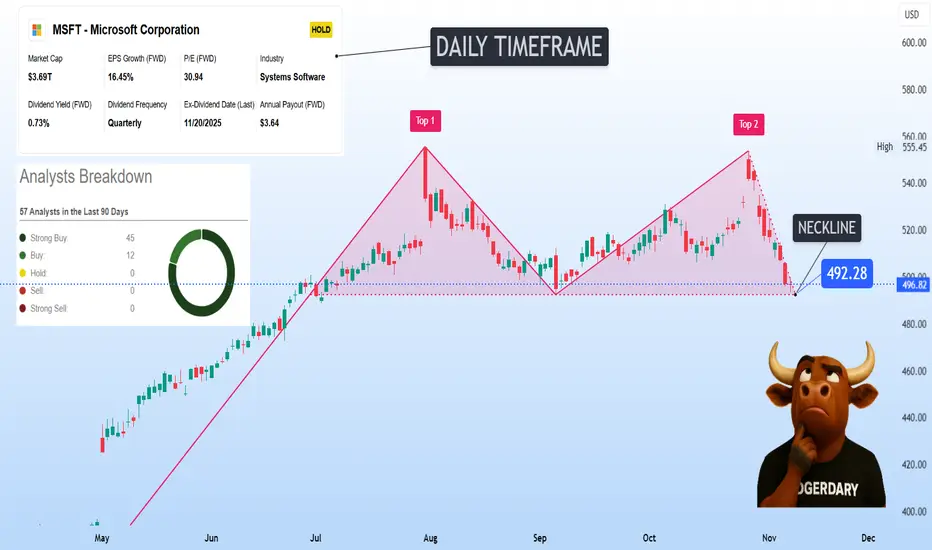
Microsoft has formed a textbook double-top pattern on the dailyMicrosoft NASDAQ:MSFT has formed a textbook double-top pattern on the daily chart, a sign that the recent rally may be losing steam.
Price is now testing the neckline around $492, a crucial level that could decide the next major move.
If this support breaks, the door opens for a deeper pullback. But if it holds and buyers step back in, it could mark the start of a powerful recovery.
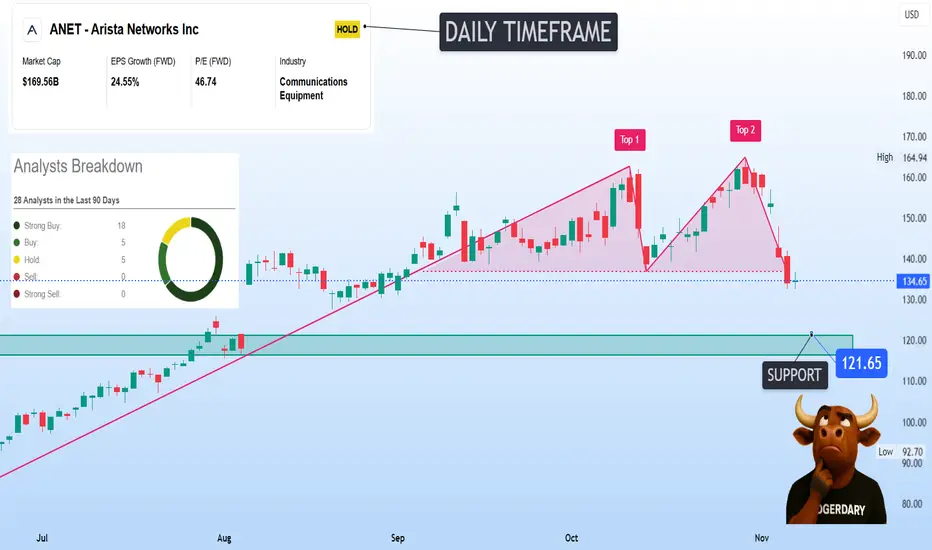
Arista Networks is forming a clear double-top patternArista Networks NYSE:ANET is forming a clear double-top pattern on the daily chart, signaling a potential short-term trend reversal after a strong uptrend.
Price has broken below the neckline near $134, confirming weakness and putting the next major support zone around $121.65 in focus.
If buyers fail to defend this level, momentum could shift from consolidation to correction.

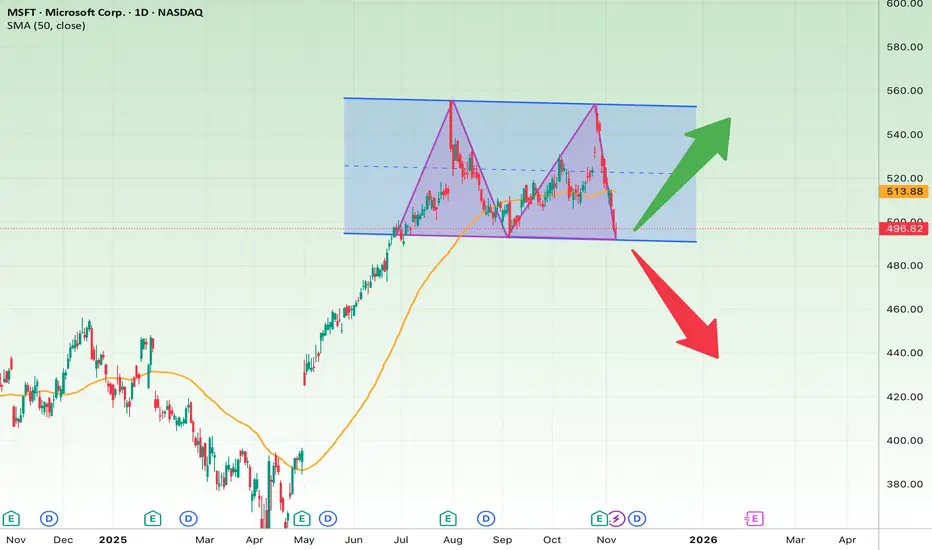
Microsoft on the Edge — Double Top or Beginning of a Rebound?The daily chart of Microsoft (MSFT) shows that the stock is moving within a horizontal range between approximately 495 and 540 dollars, with a potential bearish Double Top pattern forming. The price is currently testing a critical support area that could determine the next major move.
Structure and Trend Analysis
After a strong rally from early 2025, Microsoft entered a consolidation phase with sideways movement. Two clear peaks near 540 dollars indicate a possible Double Top pattern, which is often a signal of a trend reversal. The 50-day moving average, located around 488 dollars, has started to flatten, confirming the loss of short-term momentum. At the moment, the price is trading slightly above the key horizontal support at 495 dollars, which aligns with previous reaction lows.
Bullish Scenario
If Microsoft can hold above 495 dollars and bounce from this level, it will likely retest the upper boundary of the range near 540 dollars. Final confirmation comes if the price breaks above 540 with strong momentum. In this case, the short-term target would be between 525 and 540 dollars, and the mid-term target between 565 and 580 dollars. A reasonable stop loss for this setup would be a close below 490 dollars. A rebound from this area would indicate accumulation and the potential continuation of the long-term uptrend.
Bearish Scenario
If the price breaks below 495 dollars with increased selling volume, the Double Top pattern would be confirmed. In that case, the price could fall toward the 430 to 440 dollar range. The short-term target would be around 465 dollars, and the long-term target near 430 dollars, while the stop loss would be set above 510 dollars. A decisive close below the support zone would confirm a change in direction and could trigger a deeper correction.
Timeframe Outlook
In the short term, over the next one to three weeks, the stock may continue moving sideways between 495 and 520 dollars as traders wait for a breakout or breakdown signal. In the medium to long term, over the next two to four months, a breakout above 540 dollars could lead to a rally toward 580 dollars, while a breakdown below 495 dollars could open the path to 430 dollars, aligning with the Double Top pattern’s projected target.

Multiple pattern breakoutThe stock has broken down trendline with volumes. It has broken double bottom pattern. It is trading above 50 Ema. Targets are marked on the chart.


Bullish trend reversal with divergence & Double bottomIn a 1H chart, AUDJPY is showing a "Bullish divergence" and "Double bottom" that may reverse the trend to be bullish soon...
Entry can be initiated once the neckline is broken at around 99.6

$BTC Double Bottom Near 98K, Eyes on 109K Liquidity HuntBitcoin is currently retesting the crucial 98K support area, forming a potential double bottom pattern on the 4H chart. This zone is acting as a decisive pivot — a confirmed bullish 4H close from here could trigger a sharp liquidity grab toward the 109K region, where late short positions might get squeezed.
However, if the 98K support fails to hold and the candle closes below it, the structure weakens, opening room for a deeper correction toward 95K–90K.
For now, this area remains a high-reward zone for cautious long entries, only after confirmation of a bullish 4H close.
📊 Trade Plan Summary:
Bullish scenario: Longs above 98K confirmation → Target 109K
Bearish scenario: Breakdown below 98K → Downside to 95K–90K
Key zone: 98K (Major structural support)
⚠️ Always wait for confirmation before entering; market may still sweep liquidity before the real move begins.

Xvg bullish She will be the one to start this alt season.
No one can't convince me that bull run is over .
There will be an altseason . This is the right time for them to take us out of investments . Panic selling is working .Everyone is scared . What if bitcoin goes to 60k? Alts will die !!!
This is what everyone thinks .
I dont think the same.
Something that has never happend before , will happen during this bull run.
We will get that alt season, But when we do everyone is already too tired and won't believe ,they will think it is just another pump and dump .It has worked perfectly for them to make us not believe in alt season .
Get rich quick does not exist ,and everyone got in crypto because of that dream .People are now witnessing that crypto is not easy.
Once everyone starts thinking : that's it ,it is over , "i am going to sell because bitcoin is going down,and alts will die " ,that is the right moment to start putting the money in to the crypto projects .
See you in 2026 .
Hope everyone makes it out of this battle.

O'Reilly Breaks Down from Double Top + Evening Star Confirmation🧩 Pattern Overview
O'Reilly has broken down from a well-defined Double Top pattern , signaling a potential reversal in trend from bullish to bearish. The breakdown suggests that sellers have regained control after failing to push the price to new highs.
🌇 Candlestick Confirmation
Adding weight to the bearish view, an Evening Star candlestick pattern has formed on the daily chart. This classic reversal pattern indicates exhaustion of buying momentum and the beginning of a downward move.
📊 Technical View
Price has closed below the neckline of the double top formation.
The breakdown structure indicates a shift in sentiment from accumulation to distribution.
Momentum indicators are aligning with the bearish bias, confirming weakness.
🎯 Target Projection
Based on the double top breakdown, the projected downside target is around 98.4 , derived from the measured move of the pattern.
💡 Trading Insight
Traders can watch for a minor pullback or retest towards the breakdown zone as a potential entry opportunity. The combination of a confirmed pattern breakdown and an evening star candlestick provides a strong bearish setup with clear directional bias.

Broadridge Financial Breakout from Double Bottom | Target: 239.8🧩 Pattern Overview
Broadridge Financial has given a strong breakout from a Double Bottom pattern , signaling a potential bullish reversal after a prolonged downtrend. This pattern typically represents the end of selling pressure and the beginning of a new upward phase.
💫 RSI Indication
The RSI was in the oversold zone prior to the breakout, suggesting that the stock was undervalued and ripe for a technical rebound. The recovery in RSI now supports the bullish sentiment, indicating improving momentum.
📊 Technical View
Price has closed above the neckline of the double bottom formation.
The structure confirms a shift in sentiment from bearish to bullish.
Momentum indicators are showing early signs of strength and potential continuation.
🎯 Target Projection
Based on the breakout measurement of the double bottom pattern, the upside target is set at 239.8 . Sustained movement above the neckline could drive prices toward this level in the near term.
💡 Trading Insight
Broadridge Financial’s breakout from the double bottom, combined with an oversold RSI recovery, strengthens the bullish outlook. Traders can monitor for follow-through price action as confirmation of trend continuation toward the projected target.

EURUSD Long: Rebound Setup Targeting 1.1560 Pivot ResistanceHello traders! EURUSD continues to trade within a clearly defined descending channel, maintaining a consistent bearish structure characterized by lower highs and lower lows. The recent rejection from the 1.1660 Supply Zone once again confirmed strong seller presence at that level. Additionally, the fake breakout above the channel resistance further highlighted the inability of buyers to shift the market structure.
Currently, price continued moving lower and is now testing the 1.1475–1.1500 Demand Zone, which aligns with the lower boundary of the descending channel. This area has previously acted as a reaction zone, meaning buyers have shown interest here before. The recent candle structure suggests that bears are slowing down near the demand area, indicating potential for a corrective pullback rather than immediate continuation downward.
In my opinion, If buyers manage to defend the 1.1475 Demand Zone, we could see a short-term bullish rebound toward the 1.1560 Pivot Resistance. This creates a favorable area for short-term long positions aiming for corrective upside movement. However, if sellers break below 1.1475 and price closes beneath the demand line, this would signal continuation of the primary bearish trend, opening the path toward lower levels around 1.1420–1.1380. For now, as long as price holds above the demand zone, a corrective rebound remains the more probable scenario. Manage your risk!

EURUSD: Bearish Move From Resistance Confirmed 🇪🇺🇺🇸
EURUSD finally retested a broken structure that I showed you earlier.
There is a high chance that the pair will continue retracing from that,
following a formation of a double top pattern and bearish imbalance.
Goal - 1.152
❤️Please, support my work with like, thank you!❤️
I am part of Trade Nation's Influencer program and receive a monthly fee for using their TradingView charts in my analysis.

Ethereum Drowning: 3500 Round Figure in Jeopardy, 3000 Awaits?🌊 Ethereum Drowning: 3500 Round Figure in Jeopardy, 3000 Awaits? 📉
ETH/USD (4H Timeframe) Analysis
Ethereum is facing intense selling pressure, mirroring the broader crypto market downturn. After failing to reclaim critical resistance levels, ETH has broken through several major supports and is now testing the key psychological level of 3500.
1. The Bearish Structure and Resistance Zones
The chart clearly illustrates a significant failure of the bulls to sustain momentum, leading to a strong downtrend.
🛑 4200 to 4300 Strong Resistance: This upper red zone was the ceiling for the entire period shown. The repeated inability to break above this area confirmed strong overhead supply.
🔴 3850 to 3950 1st Key Resistance: This zone served as a frequent turning point during the consolidation phase. Having been lost, it now represents the most immediate and critical resistance for ETH. Reclaiming this zone is essential for any sign of a bullish reversal.
⚠️ 4085 Intermediate Resistance: An important minor level that also contributed to the overall bearish structure.
2. Current Price Action and Support Levels
The recent price action is defined by a sharp breakdown below the established consolidation range.
💥 3700 Support Broken: The green box at 3700, which served as support throughout the extended consolidation period, has been decisively lost. This signals a structural break to the downside.
⚪ 3500 Round Figure Testing: The price is currently battling around the 3500 major round figure. The black box highlights this ongoing test. A confirmed break and hold below 3500 would open the floodgates for further selling.
🛡️ 3000 Key Support Level: The market is now looking toward the ultimate demand zone at the 3000 Key Support Level (deep green box). This is the next major psychological and technical support, likely to be the target if 3500 fails to hold.
3. Trade Plan Scenarios
Bears (Short):
Entry Trigger: A confirmed breakdown and candle close below the 3500 Round Figure Testing zone.
Target: The next major demand zone at the 3000 Key Support Level.
Bulls (Long):
Entry Trigger: A successful defense of the 3500 level, followed by a strong close and push above the 3700 broken support.
Target: A retest of the 3850 to 3950 Key Resistance zone.
In summary, Ethereum is on precarious footing, having lost its key support structure. The battle at 3500 is critical; if it fails, a move toward 3000 is highly probable.
Disclaimer:
The information provided in this chart is for educational and informational purposes only and should not be considered as investment advice. Trading and investing involve substantial risk and are not suitable for every investor. You should carefully consider your financial situation and consult with a financial advisor before making any investment decisions. The creator of this chart does not guarantee any specific outcome or profit and is not responsible for any losses incurred as a result of using this information. Past performance is not indicative of future results. Use this information at your own risk. This chart has been created for my own improvement in Trading and Investment Analysis. Please do your own analysis before any investments.

History Seems to Be Repeating on MSTR
Lately, I’ve been noticing something interesting on MicroStrategy (MSTR) — the price action appears to be forming a structure very similar to what we saw earlier in the chart.
⸻
🟨 Repeating Consolidation Zones
Looking back, the first highlighted zone (around early 2024) shows how price moved sideways for a while after a strong rally. That consolidation eventually resolved in a sharp move upward once momentum returned.
Now, if we look at the current structure (mid-to-late 2024 into 2025), the setup looks quite familiar. After another strong upward phase, price has again been consolidating in a broad range roughly between $250 and $450.
⸻
🧩 Observing the Fractal Behavior
This kind of repeated structure—where a period of consolidation follows a strong expansion—often suggests that market participants are adjusting to previous volatility and finding equilibrium before the next major phase.
While past movements don’t predict future outcomes, it’s interesting to note how similar the rhythm of this current range is compared to the previous one. It almost feels like the market is “echoing” its earlier behavior.
⸻
🔍 Key Points I’m Watching
• The lower area of this range (around $230–$250) has acted as an important zone of interest before.
• The upper boundary near $425–$450 has repeatedly capped upward movement.
• How price behaves between these levels may give insight into the broader structure of the trend.
⸻
🕰️ Final Thoughts
This analysis isn’t a prediction or a recommendation — just an observation of how patterns sometimes reappear in the market.
Whether or not this current range resolves in a similar way to the last one remains to be seen, but the repetition in structure and timing is fascinating from a technical perspective.
Markets often rhyme, and MSTR might just be showing another verse of a familiar song. 🎵


AUDJPY: Short Term Bearish Movement 🇦🇺🇯🇵
AUDJPY may drop from the underlined intraday horizontal resistance.
We can expect a retracement at least to 99.9 level.
❤️Please, support my work with like, thank you!❤️
I am part of Trade Nation's Influencer program and receive a monthly fee for using their TradingView charts in my analysis.

GBPUSD DAILY SHORTAfter the formation of the double top pattern, the price experienced a sharp and rapid drop, reaching its last major low. It is now pulling back to that same price level, and I expect another decline toward the specified zone.
