ETHUSDT.P - November 14, 2025ETHUSDT.P on the 15-minute chart remains in a short-term downtrend, defined by a clear descending trendline that continues to cap price. Current price action is consolidating beneath the $3,240 resistance zone, where repeated rejections suggest sellers are still in control unless a clean breakout and retest occur above this level. Immediate support sits near $3,104; a breakdown below this shelf would likely accelerate momentum toward the broader demand zone around $2,960–$2,900. Conversely, if buyers manage to reclaim the trendline and hold above the $3,240 region, a short-term relief rally could develop, but until then the bias leans bearish within the current structure.
E-signal

BTCUSDT.P - November 14, 2025BTCUSDT.P – 15m
Trend:
Price remains in a clear short-term downtrend, confirmed by the descending trendline that continues to act as resistance.
Current Structure:
Price is consolidating just above a nearby support area around 96,800–97,200.
A second, larger support area sits lower at 93,500–94,200, which may be tested if the current support fails.
Key Levels:
Resistance: 99,300–99,800, which aligns with the descending trendline. This is a strong area where sellers have previously reacted.
Support:
Immediate: 96,800–97,200
Major: 93,500–94,200
Scenarios:
Bullish:
A decisive break above the descending trendline combined with a move back above 99,300–99,800 would suggest a potential short-term trend reversal.
Bearish:
Failure to break the trendline and a drop below 96,800–97,200 would increase the likelihood of price moving down toward 93,500–94,200.
Momentum:
Recent candles show indecision and limited follow-through, indicating the market is waiting for a breakout or breakdown at this trendline–support intersection.

XRPUSDT.P - November 13, 2025Testing out the sell signal generated by my personal minimalist buy and sell signal indicator (signals by miljedtothemoon v1) on the XRPUSDT.P (5-minute chart).
Yesterday, the indicator printed two winning trades — one on a buy (long) signal and one on a sell (short) signal. Let’s see if it works out today.
Disclaimer: This tool is still a work in progress and not 100% reliable. The signals can be high-risk and may produce false entries or exits.
This is for personal and educational purposes only — not financial advice, an advertisement, or a promotion.

NZDJPY - The Wall of Sellers Awaits!⚔️NZDJPY is once again approaching a massive resistance zone highlighted in red, an area that has rejected price multiple times in the past, acting as a strong supply wall.
📉As the pair nears this level , I’ll be looking for potential short setups, expecting a bearish rejection that could drive price back toward the lower support zone around the previous lows.
This range has defined the market for months, and until a clear breakout occurs, playing the range remains the optimal strategy, sell high, buy low.
Will the bears defend this zone one more time? 👀
⚠️ Disclaimer: This is not financial advice. Always do your own research and manage risk properly.
📊All Strategies Are Good; If Managed Properly!
~Richard Nasr

BTCUSDT.P - November 13, 2025BTCUSDT is currently in a short-term downtrend on the 30-minute chart, trading around $102,450. Price action is consolidating below a descending trendline, with key resistance at $104,825–$105,090 and strong support near $99,896. The structure suggests potential accumulation around the $100K level, with a possible revisit below recent lows before a rebound. A breakout above $103.5K–$104K would likely confirm bullish momentum toward $105K, while a drop below $99,896 could signal further downside. Overall, the short-term outlook is neutral to slightly bullish, contingent on holding support.

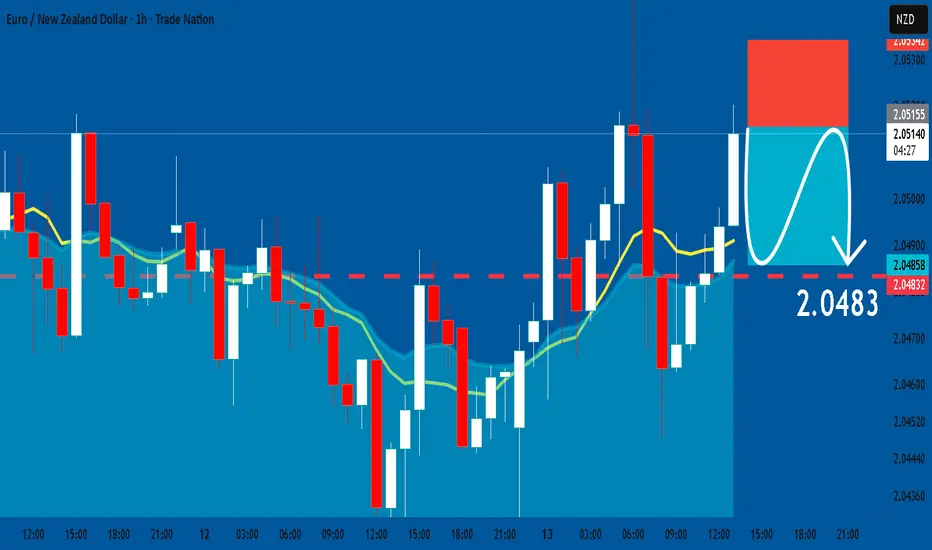
EURNZD: Short Trade with Entry/SL/TP
EURNZD
- Classic bearish formation
- Our team expects fall
SUGGESTED TRADE:
Swing Trade
Sell EURNZD
Entry Level - 2.0515
Sl - 2.0534
Tp -2.0483
Our Risk - 1%
Start protection of your profits from lower levels
Disclosure: I am part of Trade Nation's Influencer program and receive a monthly fee for using their TradingView charts in my analysis.
❤️ Please, support our work with like & comment! ❤️
CADCHF Technical Analysis! BUY!
My dear subscribers,
This is my opinion on the CADCHF next move:
The instrument tests an important psychological level 0.5682
Bias - Bullish
Technical Indicators: Supper Trend gives a precise Bullish signal, while Pivot Point HL predicts price changes and potential reversals in the market.
Target - 0.5706
About Used Indicators:
On the subsequent day, trading above the pivot point is thought to indicate ongoing bullish sentiment, while trading below the pivot point indicates bearish sentiment.
Disclosure: I am part of Trade Nation's Influencer program and receive a monthly fee for using their TradingView charts in my analysis.
———————————
WISH YOU ALL LUCK

EURCAD My Opinion! SELL!
My dear friends,
My technical analysis for EURCAD is below:
The market is trading on 1.6263 pivot level.
Bias - Bearish
Technical Indicators: Both Super Trend & Pivot HL indicate a highly probable Bearish continuation.
Target - 1.6246
Recommended Stop Loss - 1.6272
About Used Indicators:
A pivot point is a technical analysis indicator, or calculations, used to determine the overall trend of the market over different time frames.
Disclosure: I am part of Trade Nation's Influencer program and receive a monthly fee for using their TradingView charts in my analysis.
———————————
WISH YOU ALL LUCK

BTCUSDT.P - November 13, 2025BTCUSDT.P has formed a consolidation base above $101,600, indicating accumulation and potential for further upside toward the $103,685 partial profit zone and the $105,297 profit level.
A decisive close above $103,700 would confirm bullish momentum continuation, while failure to hold above $100,700 could expose the pair to renewed selling pressure toward $99,200.
Risk Assessment: Moderate — The price structure suggests potential bullish recovery from oversold levels, but the setup remains vulnerable to downside continuation if support near $100,700–$100,000 fails to hold. Traders should consider moving stops to breakeven once the $103,685 level is reached to manage risk effectively.

GOLD: Bearish Continuation & Short Signal
GOLD
- Classic bearish formation
- Our team expects pullback
SUGGESTED TRADE:
Swing Trade
Short GOLD
Entry - 4232.5
Sl - 4252.7
Tp - 4194.9
Our Risk - 1%
Start protection of your profits from lower levels
Disclosure: I am part of Trade Nation's Influencer program and receive a monthly fee for using their TradingView charts in my analysis.
❤️ Please, support our work with like & comment! ❤️

GBPCHF Expected Growth! BUY!
My dear friends,
Please, find my technical outlook for GBPCHF below:
The price is coiling around a solid key level - 1.0459
Bias - Bullish
Technical Indicators: Pivot Points High anticipates a potential price reversal.
Super trend shows a clear buy, giving a perfect indicators' convergence.
Goal - 1.0513
About Used Indicators:
The pivot point itself is simply the average of the high, low and closing prices from the previous trading day.
Disclosure: I am part of Trade Nation's Influencer program and receive a monthly fee for using their TradingView charts in my analysis.
———————————
WISH YOU ALL LUCK

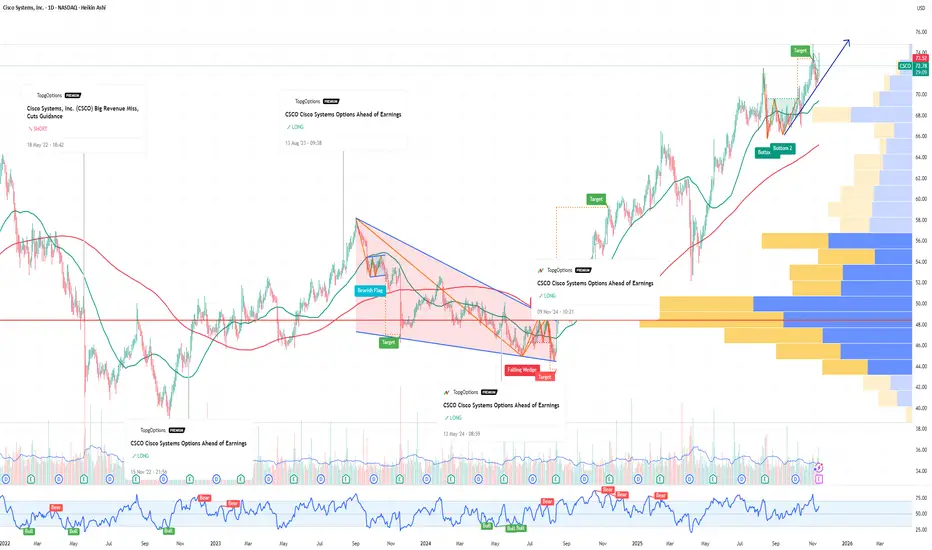
CSCO Cisco Systems Options Ahead of EarningsIf you haven`t bought CSCO before the previous earnings:
Now analyzing the options chain and the chart patterns of CSCO Cisco Systems prior to the earnings report this week,
I would consider purchasing the 74usd strike price Calls with
an expiration date of 2025-11-14,
for a premium of approximately $1.75.
If these options prove to be profitable prior to the earnings release, I would sell at least half of them.
BTCUSDT.P - November 11, 2025BTCUSDT.P is showing potential for a short-term bearish continuation after breaking below the ascending trendline support near $105,300. The pair has lost upward momentum, indicating potential downside movement toward the $103,530 partial profit zone and the $102,039 profit level. A stop level is positioned around $107,473–$107,714, marking the invalidation area for this bearish setup.
Risk Assessment: Moderate — The breakdown from trendline support favors further downside, but a sustained recovery above $105,600–$106,000 could signal a failed breakdown and shift sentiment back toward bullish consolidation.

AUDCAD: Short Trading Opportunity
AUDCAD
- Classic bearish pattern
- Our team expects retracement
SUGGESTED TRADE:
Swing Trade
Sell AUDCAD
Entry - 0.9163
Stop - 0.9170
Take - 0.9152
Our Risk - 1%
Start protection of your profits from lower levels
Disclosure: I am part of Trade Nation's Influencer program and receive a monthly fee for using their TradingView charts in my analysis.
❤️ Please, support our work with like & comment! ❤️

EURGBP Will Collapse! SELL!
My dear friends,
Please, find my technical outlook for EURGBP below:
The price is coiling around a solid key level - 0.8825
Bias - Bearish
Technical Indicators: Pivot Points Low anticipates a potential price reversal.
Super trend shows a clear sell, giving a perfect indicators' convergence.
Goal - 0.8804
About Used Indicators:
The pivot point itself is simply the average of the high, low and closing prices from the previous trading day.
Disclosure: I am part of Trade Nation's Influencer program and receive a monthly fee for using their TradingView charts in my analysis.
———————————
WISH YOU ALL LUCK

AUDJPY The Target Is DOWN! SELL!
My dear followers,
This is my opinion on the AUDJPY next move:
The asset is approaching an important pivot point 101.25
Bias - Bearish
Safe Stop Loss - 101. 42
Technical Indicators: Supper Trend generates a clear short signal while Pivot Point HL is currently determining the overall Bearish trend of the market.
Goal - 100.95
About Used Indicators:
For more efficient signals, super-trend is used in combination with other indicators like Pivot Points.
Disclosure: I am part of Trade Nation's Influencer program and receive a monthly fee for using their TradingView charts in my analysis.
———————————
WISH YOU ALL LUCK

EURUSD: Long Signal Explained
EURUSD
- Classic bullish setup
- Our team expects bullish continuation
SUGGESTED TRADE:
Swing Trade
Long EURUSD
Entry Point - 1.1565
Stop Loss - 1.1557
Take Profit - 1.1581
Our Risk - 1%
Start protection of your profits from lower levels
Disclosure: I am part of Trade Nation's Influencer program and receive a monthly fee for using their TradingView charts in my analysis.
❤️ Please, support our work with like & comment! ❤️

GBPAUD Expected Growth! BUY!
My dear friends,
My technical analysis for GBPAUD is below:
The market is trading on 2.0072 pivot level.
Bias - Bullish
Technical Indicators: Both Super Trend & Pivot HL indicate a highly probable Bullish continuation.
Target - 2.0141
About Used Indicators:
A pivot point is a technical analysis indicator, or calculations, used to determine the overall trend of the market over different time frames.
Disclosure: I am part of Trade Nation's Influencer program and receive a monthly fee for using their TradingView charts in my analysis.
———————————
WISH YOU ALL LUCK

DOGEUSDT.P - November 12, 2025DOGEUSDT.P is showing signs of potential directional breakout setup after consolidating near the $0.1710–$0.1720 zone. The pair is currently trading within a narrow range, bounded by $0.1736 resistance above and $0.1708 support below. A decisive breakout from this range could determine the next short-term trend direction.
A bullish breakout above $0.1736 may signal renewed upside momentum, targeting the $0.1765 partial profit zone and the $0.1836 profit level (long). Conversely, a bearish breakdown below $0.1708 could trigger a continuation toward the $0.1667 support and the $0.1613 profit level (short).
Risk Assessment: Moderate — The setup favors a breakout strategy, but volatility could increase as price approaches key trigger levels. Traders may consider waiting for confirmation before entering either direction. A false breakout or rejection at the $0.1736 or $0.1708 boundaries would weaken directional bias and maintain the current consolidation range.

XRPUSDT.P - November 12, 2025XRPUSDT.P is showing potential for a short-term bullish reversal after stabilizing near the $2.3779 support zone. The pair is attempting to break above a descending trendline, which has contained price action throughout the recent downtrend. A confirmed breakout and sustained move above the $2.4399 resistance level could signal renewed buying interest. If momentum builds, price action may target the $2.5758 profit level, representing the next key upside objective.
The stop level is positioned around $2.3148–$2.3200, marking the invalidation area for this bullish setup and protecting against a deeper correction.
Risk Assessment: Moderate to High — While early signs of a trend reversal are forming, XRPUSDT.P remains within a broader bearish structure. Failure to hold above the $2.38 zone or rejection from the trendline could trigger a renewed selloff toward $2.32 or lower. Confirmation above $2.44 is essential for a stronger bullish case.

BTCUSDT.P - November 12, 2025BTCUSDT.P is showing potential for a short-term bullish reversal after rebounding from the $102,400 support zone. The pair broke above the minor descending trendline resistance, suggesting that buying momentum may be building. If sustained, price action could target the $105,464 partial profit zone and the $106,844 extension level. A stop level is positioned around $101,376–$101,200, marking the invalidation area for this bullish setup.
Risk Assessment: Moderate to High — While the breakout above local resistance supports a potential short-term recovery, the pair remains within a broader corrective structure. A rejection below $103,000 would weaken the bullish outlook and could lead to a retest of $102,400 or lower.

GBP/JPY | GBPJPY Rejects from Supply Zone, Bearish Setup in PlayBy analyzing the GBP/JPY chart on the 4-hour timeframe, we can see that after an initial correction down to 200.315, the price found strong demand and invalidated the initial bearish scenario, climbing back up to the second key supply zone.
Currently, the pair is trading around 202.95, and if it manages to stay below 203, we could see another price correction soon. This analysis will be updated soon.
Please support me with your likes and comments to motivate me to share more analysis with you and share your opinion about the possible trend of this chart with me !
Best Regards , Arman Shaban

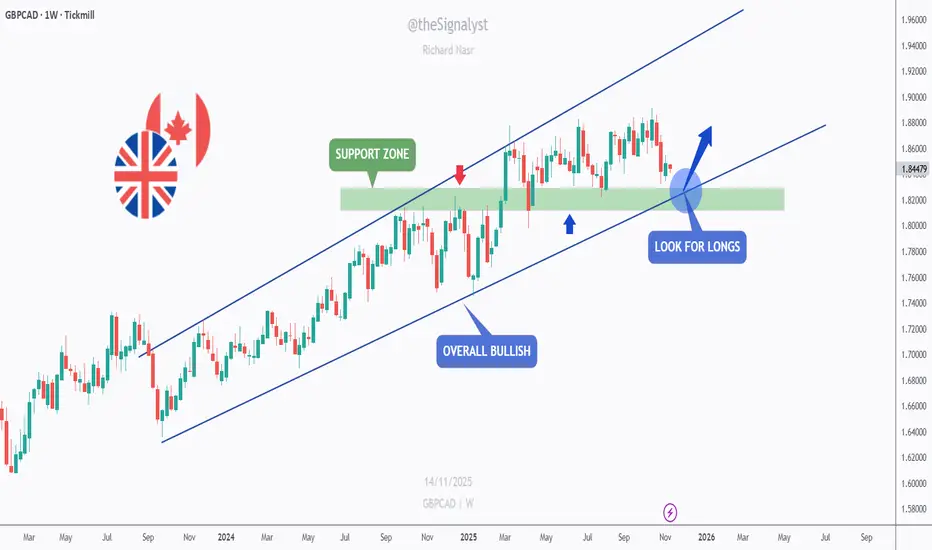
GBPCAD - Bulls Setting Up for a Comeback!📈 GBPCAD has been trading within a steady rising channel , maintaining a clear bullish structure for months. Recently, price retraced toward a strong confluence area where the green support zone aligns perfectly with the lower bound of the channel — a region that has repeatedly attracted buyers in the past.
⚔️As long as price holds above this zone , the pair remains overall bullish, and I’ll be looking for long setups in anticipation of another push toward the upper boundary of the channel.
🏹If the bulls take control from this intersection , we could witness the next impulsive move continuing the long-term uptrend.
⚠️ Disclaimer: This is not financial advice. Always do your own research and manage risk properly.
📊All Strategies Are Good; If Managed Properly!
~Richard Nasr