Why Sector Rotation Favors Booz Allen Hamilton (BAH) Over TechI have been watching the Chart for Booz Allen for the past several months, and now that I have received my Technical confirmation, my Fundamental thesis is matching what I am expecting to occur.
As the stock had their Blow off top in October, the RSI was already showing a massive Divergence with the weakening RSI and high prices.
Price 122 RSI 77
Price 147 RSI 73
Price 189 RSI 72
With the continuing downtrend, I was waiting for the large correction for the price to retest the 100 levels, but where it stands now, we have received our bullish signal.
RSI Divergence is now starting to push to the Upside, with RSI making higher lows, while price action on Lower Lows Occurred from February 2025 to November 2025. WIth this confirmation I have decided to Trim my Tech Positions and take those profits into an already destroyed Stock.
As the technology sector faces heightening "AI bubble" concerns and stretched valuations, a significant opportunity has emerged in Booz Allen Hamilton (BAH). While Alphabet (GOOGL) and Amazon (AMZN) remain fundamentally sound, their current multiples offer a diminishing margin of safety. Conversely, a temporary guidance reset at Booz Allen has created a classic "value-gap" opportunity, offering a defensive "moat" with superior asymmetrical upside over a 3-to-5-year horizon.
I. The Case for Booz Allen Hamilton: The Undervalued "Tech-Defense" Hybrid
1. Market Positioning and Moat
Booz Allen operates with a unique stability moat, deriving nearly all revenue from U.S. Federal Government contracts.
Defense & Intelligence (75% of Revenue): These segments represent the high-margin core, currently growing at ~19% as the company transitions from traditional labor-based consulting to tech-enabled solutions (AI and Cyber).
Margin Expansion: This strategic pivot has seen Net Margins double over the last decade, expanding from 4% to approximately 8%.
2. The Guidance "Reset" Opportunity
Recent revisions to FY26 guidance—citing procurement delays in the Civil sector—have led to a sharp contraction in the share price. However, fundamental indicators remain robust:
Valuation: BAH currently trades at a 13.0x P/E ratio, its lowest level since 2016 and significantly below its 10-year historical peak of 22x.
Insider Conviction: In October 2025, CEO Horacio Rozanski purchased approximately $2.01M in shares on the open market—a powerful bullish signal during a period of market skepticism.
3. Projected 2029 Valuation Framework
Applying a conservative 9% CAGR to Net Income and factoring in the company’s aggressive $500M share buyback program, we project a 2029 EPS of $8.77 – $10.00.
Bear Case (13x P/E): Price target of $130.
Bull Case (21x P/E Mean Reversion): Price target of $190 - $235, representing an upside of 105% - 154%.
Earnings

$NVO is NOT the free money you think it is, at least not yet.It's not hard to see that Novo Nordisk NYSE:NVO , Denmarks largest company by revenue, is long due for a bull run. Everything from fundamentals to technicals are saying that it's time for Novo to finally shine but is it really the rocket waiting to liftoff that most of the market thinks?
Donald Trump's threats to acquire Greenland are likely more than just talk. Whether you love him or hate him, it isn't unreasonable to expect that in the coming months talks about taking Greenland will flair up again just judging by his lack of care for international norms/laws and desire to strengthen American influence around the world while turning a profit. The biggest question is how far he is willing to go?
Nobody knows for certain but inferences can be made from one of his most recent actions. The capture of Maduro can be a great example of what he would do to gain influence over a resource rich country. Using common sense, I doubt that the Danish King will be kidnapped. However, it is within reason to believe Trump would be willing to any exert force on the nation short of military action as long as there is a somewhat defensible justification (don't underestimate the lengths he will go to). This force will more than likely put massive strain on the Danish economy, Novo included.
Keep in mind that 57.64% of Novo's revenue is concentrated in the US. The effect of losing this market, even temporarily, makes even the possibility of such action a catalyst for massive selloffs.
In a situation where Denmark is targeted by tariffs Novo would be somewhat shielded by manufacturing plants in the US although the majority of these are "fill-finish" sites. These sites only package the medicine into final form for distribution, no actual medication is synthesized in them.
My biggest takeaway is that caution should be exercised before maxing out your leverage and betting the house. Plenty of churn and uncertainty should be expected in the coming months and be prepared to hold for a while. There is tons of bullish sentiment on this stock and it seems that nobody wants to be the bearer (pun intended) of bad news.
Novo Nordisk is one of the best long term plays right now and should be treated as such, a long term play.
I'd love to hear your thought in the comments.

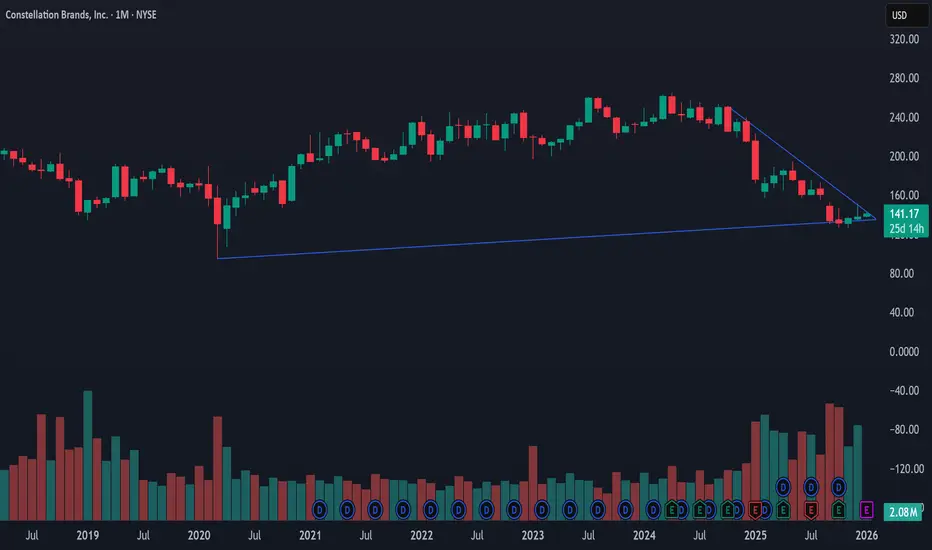
Constellation Brands: Navigating 2026’s Volatile SpiritsConstellation Brands (STZ) stands at a critical crossroads as it prepares for its January 7 earnings release. The beverage giant faces a complex cocktail of macroeconomic pressures and shifting consumer habits. While its Mexican beer portfolio remains a titan, the broader landscape suggests a challenging year ahead. Investors now weigh the company’s "premiumization" strategy against a cooling economy.
Geopolitical and Macroeconomic Headwinds
Geopolitical friction increasingly dictates the company’s bottom line. Recent shifts in U.S. trade policy have introduced fresh tariff concerns for Mexican imports. These duties directly impact the Beer Division, which relies on cross-border production. Management recently cited these "macroeconomic headwinds" as a primary reason for lowering fiscal 2026 guidance.
Simultaneously, inflation has eroded the purchasing power of the core Hispanic consumer base. High-end beer sales for this demographic showed more pronounced declines than the general market. Furthermore, the 2026 USMCA review adds a layer of geostrategy to supply chain planning. Constellation must navigate these regulatory waters to protect its dominant import position.
Business Model: The Power Brand Pivot
Constellation has aggressively restructured its business model to prioritize high-margin "Power Brands." The company recently divested "mainstream" wine assets and Svedka vodka to focus on labels like Kim Crawford and The Prisoner. This shift aims to insulate the company from the volatile lower-end market. However, the Wine & Spirits segment still faces persistent volume declines.
The strategy relies on the resilience of "premiumization"—the idea that consumers drink "less but better." Recent data suggests this trend is slowing as households tighten their budgets. Despite this, Constellation's beer brands like Modelo Especial continue to gain dollar share. This suggests the company’s brand equity remains robust even in a downcycle.
Innovation, Technology, and Patent Analysis
Innovation is no longer just about new flavors. Constellation is leveraging high-tech solutions to optimize its sprawling operations. The company utilizes AI and machine learning for advanced demand forecasting and route optimization. These digital transformations help mitigate rising logistics and raw material costs.
* Patent Strength: Constellation holds 74 global patents, with 54 already granted.
* R&D Focus: The company operates state-of-the-art centers for fast prototyping.
* Scientific Stewardship: A major focus remains on water restoration and ag-tech to ensure supply chain sustainability.
The patent portfolio reveals a focus on packaging efficiency and product stability. These intellectual assets provide a long-term moat against competitors.
Management and Leadership Discipline
CEO Bill Newlands has maintained a disciplined approach to capital allocation. The leadership team remains committed to an investment-grade rating while returning cash to shareholders. In late 2025, the company authorized a $4 billion share repurchase program. This move signals management’s confidence in the stock’s intrinsic value despite recent volatility.
Leadership is also implementing a "leaner" organizational structure. They aim to save over $200 million by 2028 through efficiency initiatives. This proactive management style is essential as the company navigates a period of "operating deleveraging."
Earnings Watch: What to Expect on January 7
Wall Street expects a contraction in both top and bottom lines this Wednesday. Analysts project quarterly earnings of $2.66 per share, an 18% decline year-over-year. Revenue estimates sit at $2.18 billion , reflecting a double-digit percentage drop.
| Metric | Consensus Estimate | Year-Over-Year Change |
| Revenue | $2.18 Billion | -11.6% |
| EPS | $2.66 | -18.2% |
| Beer Sales | $2.01 Billion | -1.0% |
Investors will focus on the Beer Division’s resilience and the rate of Wine & Spirits contraction. Management's guidance for the remainder of 2026 will likely dictate the stock's direction for the quarter.
The Verdict: A Value Play in Transition?
Constellation Brands is currently a story of short-term pain versus long-term potential. The stock trades at an attractive price-to-free-cash-flow multiple of roughly 13.8x. This is significantly below its five-year average. While cyclical downturns and tariffs create noise, the company's "Power Brands" continue to lead the market.
Netflix (NFLX): Why We Are Buying the 'New Media Major' DiscountTime Horizon: Long-term Directional Bias: Bullish (Long)
The "Big Picture" (Summary) We hold a High Conviction bullish bias on Netflix. The market is currently mispricing the company's "Mega-Merger" with Warner Bros.. While investors are fearful of the debt load, we view this as a "Generational Consolidation" event. Netflix is acquiring prime assets like HBO and Harry Potter while rejecting the toxic, declining linear cable networks.
The Analysis (Why We Are Bullish)
The Valuation Disconnect: Our bullish stance is built on a valuation arbitrage. The stock trades at roughly 36x this year's earnings. However, because the market is ignoring the "cherry-picked" nature of the deal, you are effectively paying only 21.6x for the projected 2027 earnings. We are buying future growth at a historical discount.
Underlying Strength vs. Headline Noise: The recent price action has been dampened by a "red flag" in the Q3 earnings: a $619M tax charge in Brazil. This one-time event masked the reality that organic revenue accelerated by 17% and adjusted operating margins are healthy at ~33.6%. The fundamental engine is stronger than the headlines suggest.
The Catalyst: The completion of the Warner Bros. asset integration (expected Q3 2026). We expect $2–3 billion in cost savings simply by shutting down redundant tech stacks and combining marketing efforts.
Investment Plan
Buy Zone: $90.00 – $92.00 We look to accumulate long positions in this area. We want to be positioned before the "synergies" become obvious to the broader market.
Invalidation Level (Stop): Close below $80.00 Our bullish bias is invalidated if the deal is blocked by regulators, likely causing an initial drop to $80.
Target: $105.00 (+15%) This is our conservative Base Case target. If Netflix achieves "utility" status and realizing full synergies, our Bull Case extends to $144.00.
________________________________________
Disclaimer: This content is for educational purposes only and does not constitute financial advice. All investments carry risk. Please do your own research or consult a certified financial planner.

Novo Nordisk (NVO): A Rare Value Opportunity in a DuopolyBias: Long (Bullish) Time Horizon: Long-term (2+ Years)
The "Big Picture" Novo Nordisk, the pioneer of the modern weight-loss market, has seen its stock price fall to roughly $52, a level not seen since mid-2021. The market has panicked due to competition from Eli Lilly and some temporary setbacks, effectively pricing Novo as if it has stopped growing. We believe this is a classic overreaction: Novo is still growing revenue at 15% (currency-neutral) and remains a dominant player in a global market large enough for two winners.
The Analysis:
The Trend: The stock experienced a "free fall" in late 2025, driven by a series of negative updates rather than a single catastrophic event. Sentiment shifted from "perfection" to extreme pessimism after the company lowered guidance and missed targets on an Alzheimer's trial. However, the business fundamentals remain strong, with the company generating over $33 billion USD in revenue in the first nine months of 2025.
The Valuation Gap: This is the core of the thesis. Novo Nordisk is currently trading at a Price-to-Earnings (P/E) ratio of roughly 14.2x. For context, its primary competitor, Eli Lilly, trades at over 50x earnings. This 73% discount suggests the market expects Novo to lose almost all relevance, which we view as analytically flawed given their pipeline and cash generation.
The Catalyst: Three main drivers will likely push the price back up:
1. Pipeline Success: The expected launch of "CagriSema" in late 2026, a next-gen drug with projected weight loss of 25%, which effectively neutralizes Eli Lilly's efficacy advantage.
2. Supply Chain Moat: Massive investments in manufacturing (CapEx) will allow Novo to meet demand that competitors simply cannot supply.
3. Leaner Operations: Following a painful restructuring in 2025, the company has cut costs significantly, which should improve profit margins moving forward.
Investment Plan
• Buy Zone: $50.00 – $55.00
o We view the current price of ~$52 as a "bear case" floor, offering an excellent entry point for long-term accumulation.
• Risk Level (Invalidation): Below $48.00
o While a hard stop isn't explicitly set in the report, a sustained drop below the $50 psychological and valuation floor would require re-evaluating the thesis.
• Target: $72.00
o This target assumes a recovery to a more reasonable valuation (20x earnings) over the next 12 months as market sentiment normalizes.
________________________________________
Disclaimer: This content is for educational purposes only and does not constitute financial advice. Past performance is not indicative of future results. Please do your own research before making any investment decisions.

Ultra Clean Holdings | UCTT | Long at $27.32Like Ichor Holdings NASDAQ:ICHR , Ultra Clean Holdings NASDAQ:UCTT is a prominent developer and supplier of critical subsystems, high-purity components, and specialized services, primarily for the semiconductor industry. I believe this is a very undervalued area in the semiconductor industry.
Growth
Earnings per share expected to more than triple between 2025 and 2028 and revenue is expected to be on the rise.
Health
Debt-to-equity: 0.9x (healthy)
Quick Ratio: 1.9 (great)
Altman's Z Score: 2.7 (good)
Action
Unless the semiconductor market implodes (or the company), the future looks bright for NASDAQ:UCTT in the next 2-3 years. It may dip into the low $20's in the near-term to close a few price gaps, but with a float of 44 million, it may get interesting at some point soon. Thus, at $27.32, NASDAQ:UCTT is in a personal buy zone.
Targets into 2029
$35.00 (+64.7%)
$60.00 (+119.6%)

Ichor Holdings | ICHR | Long at $20.41Ichor Holdings NASDAQ:ICHR is a major supplier in the semiconductor industry, specifically focused on the semiconductor capital equipment sector rather than directly manufacturing chips themselves. I believe this is a very undervalued area in the semiconductor industry. The other major competitor is Ultra Clean Technologies NASDAQ:UCTT .
Insiders
Buying between $14 and $17 share.
Growth
Earnings per share expected to more than double between 2026 and 2028 and revenue on the rise.
Health
Debt-to-equity: 0.2x (healthy)
Quick Ratio: 1.3 (good)
Altman's Z Score: 2.8 (good)
Action
Unless the semiconductor market implodes (or the company), the future looks bright for NASDAQ:ICHR in the next 2-3 years. With a float of 32 million, it may get interesting at some point soon. Thus, at $20.41, NASDAQ:ICHR is in a personal buy zone.
Targets into 2029
$32.00 (+56.8%)
$42.00 (+105.8%)

BITF - when structure starts to matter more than headlinesBitfarms Ltd. is a publicly traded Bitcoin mining company operating large scale mining facilities across North and South America. The core business is cryptocurrency mining with a strong focus on energy efficiency, infrastructure ownership, and geographic diversification across Canada, the United States, Argentina, and Paraguay.
From a fundamental perspective as of late 2025, Bitfarms remains a growth focused company still in its investment phase. The upcoming Q4 2025 report is expected to show EPS around −0.04 USD with projected revenue near 66.45M USD. Throughout 2025, quarterly revenue has remained relatively stable in the 69–78M USD range, driven primarily by the cryptocurrency mining segment. Cash flows remain volatile and free cash flow is still negative, which is typical for miners actively expanding capacity and upgrading infrastructure. This is not a dividend or value story, but a leveraged bet on scale, efficiency, and the broader crypto market cycle.
Technically, the structure is clean and well defined. On the 4 hour chart, price formed a falling wedge that has already broken to the upside with a clear and confirmed retest. The breakout held, sellers failed to push price back inside the pattern, and momentum stabilized. All previously existing gaps have now been fully closed, reducing downside risk from unfinished price imbalances. Price is currently sitting on a strong daily support zone, while the working timeframe remains the 4 hour chart. Higher timeframe structure confirms support validity, and price action shows early accumulation behavior.
From a tactical standpoint, Bitfarms is transitioning from a corrective phase into a potential new impulse. As long as price holds the current support zone, the path opens toward the 3.91 area. If the broader structure remains intact and crypto sentiment stays constructive, continuation toward the 6.60 zone becomes technically justified. This is not a short term hype trade, but a structured continuation setup after a confirmed breakout and retest.
Sometimes the market clears all unfinished business first, and only then starts the real move. .

Major correctionI'm targetting a drop to 11 000 around Aug to Dec next year and back to more reasonable valuations than currently. This would also arrive at the very long term lower trend line on the log chart. The area around 11 000 looks to me like it need retesting. And it would need to be in this sort of time frame, before we run out of time to get back to such levels on this lower log trend line.
Ok possible, but far fetched, so it still needs a reason.
So why should that happen?
A confluence of factors:
- I believe inflation will stay elevated for some time and even potentially resurge. Trumps tariffs are not helping with disruptions and inefficiency on supply chains.
- I think its unavoidable that AI will destroy jobs. Long term it will balance out, as it always does. But in the interim this will be faster than the labour market can adapt. So a lot of job losses
- Due to the inflation backdrop, the fed's hands will be tied, regarding dropping rates. So they wont be able to rescue markets on this occasion with their Ponzi scheme. THAT will be a big problem. Or if that's not the case, the job losses may still be too much anyway, for their fiddling to prevent.
My only reservation with this analysis, is that the jobs losses may be a bit slower to start showing up, than the this time frame will allow. If so, then it may not make it as far down as11 000, due to missing the window of opportunity to reach this level before it becomes below the lower log trend line. Although if it gets near, i cant believe it will not target it. If it misses by this date, its still possible to break the trend line to reach this area, if conditions became bad enough. But that would be quite extreme. But maybe it will be so.
The final factor is contracting money supply. This could cause the above scenario alone anyway. As ballooning supply is mostly how we got where we are. But certainly if combined with any of the others, it could be nasty. So be very vigilant on this.
Note, that the chart posted is a monthly chart. So this is a longer term view. So dont expect this to happen imminently or on a particular day/week/month. But keep an eye out for the signs.
Lastly, potential labels for the 3 up waves of an elliot wave. The first and third are similar in terms of % gain. Less do in terms of time duration, but still more similar to each other than compared to the middle wave. Elliot waves are extremely discretional however and vary according to time frame. So much variation in delineation is possible. And it could still continue for some time. Mentioned more as a possible point of interest than a useful tool.

diwali pick 6 : ganesh consumer productkey facts about Ganesh Consumer Products, organized by category:
Product Portfolio (42 products, 232 SKUs)
– Whole Wheat Flour: Sharbati, White, Multigrain, Diabetes Control, Gluten-Free Atta
– Value-Added Flours: Bakery Maida, Super Fine Maida, Tandoori Atta, Rumali Atta
– Roasted Gram Flour (Sattu): Multigrain, Sweet, Jaljeera, Chocolate Sattu
– Spices: Turmeric, Chili, Coriander (whole & powder), Cumin (whole & powder), blended masalas
Manufacturing Footprint (7 plants)
– West Bengal (Kolkata): Jalan Complex I (Sooji/Maida 47,850 TPA; 72% util), Jalan Complex II (Spices 2,552–5,104 TPA; 2–27% util), Padmavati Unit (Atta 47,850 TPA; 80% util; Maida/Sooji 47,850 TPA; 54% util; Dalia 7,656 TPA; 74% util)
– Food Park: Sattu 15,950 TPA (49%), Besan 6,380 TPA (62%), ethnic flours 6,380 TPA (37%)
– Uttar Pradesh: Varanasi (Atta 47,850 TPA; 41%), Agra (Sooji/Maida 47,850 TPA; 63%)
– Telangana: Hyderabad (Maida/Sooji 63,800 TPA)
Business Model & Distribution
– 77% B2C revenue; remaining from B2B sales and by-product off-take
– 28 C&F agents, 9 super-stockists, 972 distributors, 70,000+ retail outlets
– Presence in 204 modern-trade stores and on multiple e-commerce platforms
IPO & Use of Proceeds
– Raised ₹409 crore in September 2025 IPO (listed Sep 29, 2025)
– Fresh issue ₹130 crore to: repay debt; fund Darjeeling gram-flour/Sattu unit capex; general corporate purposes
This comprehensive network, diversified SKU base, robust manufacturing capacity, and capital infusion position Ganesh Consumer for continued growth in its core flour and spice categories.

Dassault Aviation Société AnonymeFor my last idea of the year I have chosen to write one about Dassault Aviation. I really find aerospace and defense companies to be the most interesting to me in all of the stock market. As a matter of fact the majority of my holdings are invested into aerospace and defense companies. Aeronautics has always been an extremely competitive industry, ever since the first airplanes, engineers constantly strive to make the technology better, faster, safer and more cost effective.
I chose Dassault because I think the Rafale fighter program has a competitive advantage over the rest of the competition for the moment. There was also some issues, I remember around March of 2025 I saw on the news about how some nations were concerned with the credibility of the US and some nations even cancelled or suspended contracts with Lockheed Martin to delay F-35 purchases. I don't want to talk about that too much because I don't really know what is going on with that topic of discussion to tell you the truth. I do know nations take their national security very seriously though and aerospace and defense is no exception.
Like most aerospace and defense companies right now it is difficult to see very much upside intrinsically speaking. The sector has had some really nice attention and momentum this year, I don't see why it wouldn't continue into 2026 and beyond. I think its important to realize I am not really speculating about the topic though. I am not trying to say "buy it because I think it will go up". I think good ideas are just as important in the stock market as risk management itself and if you ask me I don't think its worth risking very much on Dassault right now.
Primary capital allocation is designated to research and development, industrial infrastructure and supply chain management. These are important elements when we look at the price of Dassault on a chart because the capital expenditures are primarily why certain price actions occur in real time. For example, if the company needs money to finance something new, the price of the shares might drop temporarily as money is being spent, alternatively if they get a new contract and its a big deal, they expect to make a lot of money from it the share price might go up. This is why I love these industrial companies, because we all know the products the company is providing is going to need a lot of maintenance over the years.
The company actively partakes in employee share programs, Dassault has allocated hundreds of millions of Euros toward employee incentives and profit-sharing in the current fiscal cycle. The company also likes to reward shareholders by engaging in share buy back programs from time to time. There is also a slight dividend that the company pays out as well if that is something you receive then you will know it helps out the portfolio a little bit.
The company has a pretty large cash position valued at about €10 billion at the end of 2025. This is primarily from advanced payments received by nations for major Rafale export contracts. Currently there is a record breaking order backlog on aircraft orders going into 2026, there is about €48 billion in backlog value. Don't quote me on this though because that was the value about 6 months ago so today it could be a little more or less, the value doesn't really matter to us as retail investors but I am just saying it for context. The company plans to take care of this backlog in a timely manner though, they plan to invest in more industrial capacity.
Recently the company celebrated production of its 300th Rafale fighter jet, and announced plans to increase production rates to four aircraft per month in the coming years to ensure deliveries stretch reliably into the 2030s. I think the stock would make a fine addition to any properly diversified portfolio as long as you understand the potential risks associated. Its a pretty interesting company I think there's definitely some great information on the internet and I am happy that I got to write this idea and share some information today.
Merry Christmas and thanks for putting up with me. Hope you enjoyed the idea.

Coty | COTY | Long at $3.00NYSE:COTY , one of the world's largest beauty companies, is known for its extensive portfolio of fragrances, cosmetics, skincare, and body care brands, such as:
Adidas
Bourjois
Bozzano
Bruno Banani
Burberry
Calvin Klein
Cenoura & Bronze
Chloé
CoverGirl
David Beckham
Davidoff
Escada
Etro
Gabriela Sabatini
Gucci
Hugo Boss
Infiniment Coty Paris
Jawhara
Jil Sander
Joop!
Jovan
Kylie Cosmetics
Kylie Skin
Lancaster
Leger by Lena Gercke
Manhattan
Marc Jacobs
Marni
Max Factor
Mexx
Miss Sporty
Monange
Nautica
Orveda
Paixao
Philosophy
Rimmel
Risqué
Sally Hansen
Swarovski
Tiffany & Co.
Vera Wang
Technical Analysis
Price double bounced off the top level of my selected historical "crash" simple moving average band. While the price may dip further to touch the lower end of this band (low $2 zone), this band is typically where share accumulation begins before a price reversal. The price may trade sideways for some time or jettison up, but my long-term outlook will simply require patience. Growth projections are modest and hinge on the company's successful execution of strategic restructuring and turnaround plans, delivery on new product launches and growth initiatives, and leadership stability / clear catalysts. Thus, at $3.00, NYSE:COTY is in a personal buy zone and not recommended for the risk averse.
Targets into 2028
$3.50 (+16.7%)
$4.70 (+56.7%)

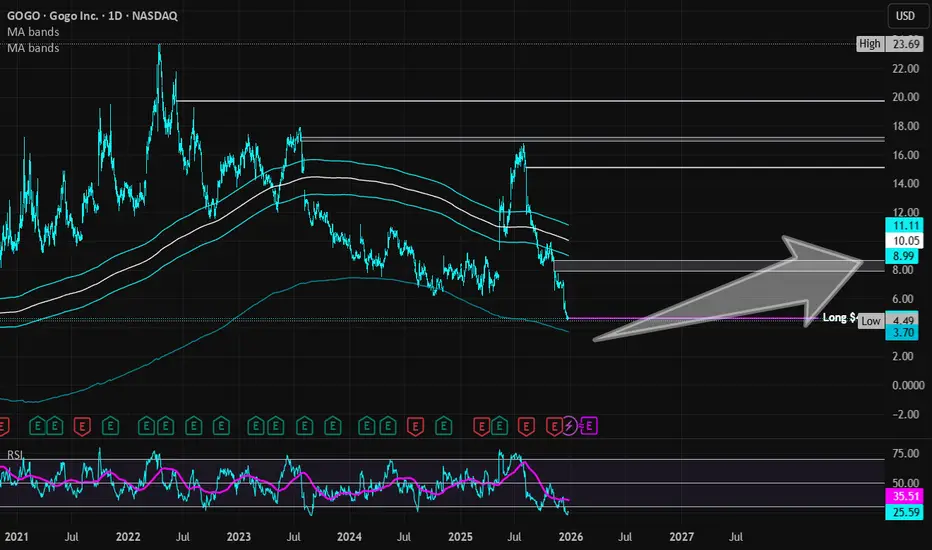
Gogo Inc | GOGO | Long at $4.65While NASDAQ:GOGO Inc may have competition from Starlink when it comes to providing internet service to airlines and its passengers, such a change isn't financially beneficial to many airlines. Instead, as GoGo has stated, it's evolving its services to match those of Starlink (i.e. upgrades). As more and more people fly and internet demand grows, NASDAQ:GOGO will likely continue to position itself as a monopoly within the ISP world for airlines in the near-term.
Pros
Dominates the North American business aviation connectivity market, especially for smaller jets
Projected Growth : EPS +278.9% between 2025 and 2028
Insider Buying : $2.3 million in purchases in the last 2 months
Cons
Starlink competition
High debt (but plans to use free cash flow to reduce it substantially beyond 2026)
Action
While price may further dip into the $3 range in the near-term, I believe interest rates dropping, projected growth, and insider buying are potential bullish signals. The cost for airlines to switch to other providers is beneficial to maintaining NASDAQ:GOGO market dominance. However, like any play, this is going to come down to management's control of debt and no major economic or world issues disrupting airline travel. Thus, at $4.65, NASDAQ:GOGO is in a personal buy zone with near-term risk of a drop into the $3 range.
Targets into 2028
$6.00 (+29.0%)
$8.00 (+72.0%)
FERTILIZERS READY TO RIPFertilizer stocks have yet to move off their wave 2 bottoms. If you think the short squeeze in precious metals is mind-boggling—just wait till you see what a squeeze in fertilizers will look like. NYSE:IPI is the ONLY producer of POTASH in the USA. Most supply comes from Russia and Canada. Potash, like TVC:SILVER , is on the list of US critical minerals. No fertilizers, no food. You do the math. NYSE:IPI is HIGHLY TORQUED with only 10 million shares. No debt; MASSIVE cash hoard. The company is also ramping up production as demand increases and supply is squeezing. When this baby moves she will melt faces.

Caterpillar, a Key Industrial CompanyGood morning, I was going to wait until later tonight to write this idea and even though I don't feel so great this morning I still want to write it now while the words are in my head. Lately my mind is like a waterfall because things keep coming that I want to say. I don't hold onto these thoughts for too long I just let them go away because I don't really think its important to hold onto anything too tight. That's why I think its important that I write the idea now instead of later. For those of you that have been paying attention to what I have been saying will know by now I am not constituting financial advice, there is actually some wisdom in what I have been saying however.
I don't think a lot of people actually notice what the point I am trying to make is. I have said it before that I never stayed at a job for more than a few months and people seem to think that there's something wrong with me. See the problem is not with me, rather the problem is within their own ignorance. I am not saying this hypocritically either because I have already come to terms with my own ignorance, I am not calling people ignorant because I want to offend them even though that is always what happens. Sometimes the truth hurts and I think its so incredibly important to be honest with ourselves most of all.
Anyways it may seem at times like I might go off topic but at this point I am not going off topic. The topic of my ideas from now on is not to provide you with information about a company so you can make money. I think it would be much more meaningful to write about some of the things that have helped me to become successful in the stock market. Obviously, since I am writing about specific companies I will still include the necessary information I think is relevant to the context of the writing. Just know that, I am doing my best to provide quality content without wasting anyone's time.
So many people just want someone to tell them which stocks to buy or whether or not the stock will go up or down. To tell you the truth I don't think this is conducive to a constructive learning environment. I see so many people who are struggling in their trading career and they are focusing on the totally wrong things. It makes me sad to see this because there is really nothing I can do except write some ideas and hope these individuals are paying attention. The problem is that, most of the best ideas I have had are already behind me and I do not like to repeat myself so it is unlikely that I will write another idea on the same company even if I think its a good time to buy or not.
It also makes me feel good to write down my thoughts, its almost like a therapy for me. I am only human and none of my relatives care about stock market talk. In fact I can put almost anyone to sleep talking about the stock market. Anyways I am sure you probably want to see what I have to say about why Caterpillar is a good stock so without further adieu.
One of the things I find most interesting about Caterpillar is the fact that, it shows some pretty nice upside still. I used the discount cash flow model to interpret a fair value for the stock and I think a fair value for it would be somewhere in the ballpark of $675. This implies a significant upside despite the fact that technically it doesn't look great to be a buyer right now. Actually I doubled down on my position last week on Caterpillar and closed my position on Deere I am not writing this to talk about myself though and I don't think anyone cares about what I am doing anyways.
There has already been plenty of people talking about why the stock has done so good this year and I don't think it would really add any value to write about something that's already been said. This is one of those times where I am going to say if you are serious about buying some Caterpillar shares that you should do a little research for yourself on the company and why it is doing so good. It is not rocket science to go into Google and type "how does Caterpillar use capital in their business" that is literally all I did in some of my previous ideas that ended up being a little popular.
I used to be pretty bad at writing and I think the problem was, that I was trying to hard to say the right things. I have been having way more fun just saying, or well, writing the words as the come into my head. Like I said it makes me feel better to do this, I know someone has been paying attention to what I am saying and I truly hope that you don't take it the wrong way. Normally when I start writing these ideas I always feel like I would have more to say but it gets to a point where I kind of run out of words sort of speak. I know there's more I want to say but I don't know exactly what that is right now.
Anyways, thanks for reading my idea. I hope you make a lot of money and have a great day! Don't forget to have fun and stay safe this holiday season!

Palantir - H&S - ShortExpecting something like this to play out coming weeks for Palantir. Went short on the top of the right shoulder (It is still in process of being a shoulder).

SGMO May Be the Most Mispriced Opportunity of 2025-26
-SGMO is shaping up to be a high-potential trade with both short- and long-term upside. After entering an uptrend in late 2023, the stock is showing strong bullish signals, with technical indicators and moving averages pointing to a favorable buy zone. Fundamentally, it's hitting a key turning point — EPS is moving from negative to positive for the first time, and revenue is projected to grow from \$50M to \$200M by 2028.
-Typically, SGMO experiences a major price jump every year, and it’s currently coming out of a low period. A breakout is expected within the coming month. Even under conservative estimates, a 200% return is possible in the near term. But if SGMO revisits its historical highs around $20 — a level it’s touched multiple times in the past — the upside from its current $0.50 range could exceed 4,000%. The financial structure is far stronger than it was during previous lows (like March 2020), making this a classic high-risk, high-reward setup worth watching closely.

Rambling off about Mitsubishi Heavy IndustriesAs you can see by the title of this idea it will be me writing about a company i think is interesting. It might end up being a lengthy read but I don't know how much I will manage to write before I get bored or covered all the topics I think are important from an investors point of view because I want to try and stay on topic when I write my ideas as best I can. Don't think that this is some kind of trading advice because its not, actually it makes me upset when people ask me to tell them if I think the price of a stock or index will go up or down. I can say that I wouldn't buy it if I didn't think it would go up, but I don't know when it will go up.
Looking at the valuation of the stock first, it appears to be quite overvalued and I'm going to hold off on buying it for awhile. There's a few reasons why I am going to wait to buy it, the first reason actually is because I only wanted to allocated 1 or 2 percent of my portfolio to the stock and for some reason right now it is prohibited to open a new position on the depository receipts. I would already start buying the stock if this was not the case but there's nothing I can do except wait for the trading permission to be available again. Like I said the stock is also very overvalued right now, there's really not any realistic room for upside in the near future. Granted that would not have stopped me from buying it, I probably would have still bought it if the OTC exchange would have allowed me because I just want to own the stock and price is not the most important thing to me when making these decisions.
I have started expanding my knowledge beyond most conventional ideas and have made my way into the Japanese stock market. Since I worked in the industries for a majority of my life I can't help but find the Japanese stock market incredibly interesting to me. I feel like a lot of the companies are major industrial entities in the world, I think most people might overlook the importance of some of the companies that trade on the Tokyo stock exchange. Mitsubishi Group is actually a vast conglomerate company which expands across hundreds of companies. Mitsubishi Heavy Industries is responsible for managing its business operations in sectors like aerospace, defense, energy and heavy machinery, which also happen to align with my personal preference of companies that I like to invest in.
As you can see I have added some photos to my idea and I'm not trying to offend anyone when I posted photos of airplanes but this is one of the core business operations of the company and I have to say what I want to. That being said I also added some other photos of Mitsubishi products. The company is famously an engineering company at its core, I don't want to write too much about the history of the company even though I probably can dedicated several paragraphs to just that.
I am going off topic a little bit here so I am going to go back on topic and now write about some of the ways Mitsubishi Heavy Industries uses capital in their business. This is a key element for every investor to pay attention to when deciding whether they will buy shares of a stock or not. Since the company is a conglomerate it will be pretty straight forward, there's really nothing special about how they utilize capital, pretty much the same as other conglomerate companies. I wrote an idea about Berkshire Hathaway some time ago and I think that is a text book example of how an ideal conglomerate company would want to utilize capital. Mitsubishi is a little different though because they are actually an industrial company and not a financial company like Berkshire. So its like comparing apples to oranges essentially.
It would be safe to assume the business model for Mitsubishi Heavy Industries is so incredibly complicated and need I say, unpredictable but I would also use words like reliable or necessary. Since I worked in heavy industries for along time I know it well and its easy for me to interpret the things I think will make the company money over a long period of time. I am starting to feel like it would make me bored to try and write about the specific elements of capital allocation now. In all seriousness I really just like the company and that's why I decided to write this idea today. I will probably keep exploring the Japanese stock market and might come up with more random ideas to share.

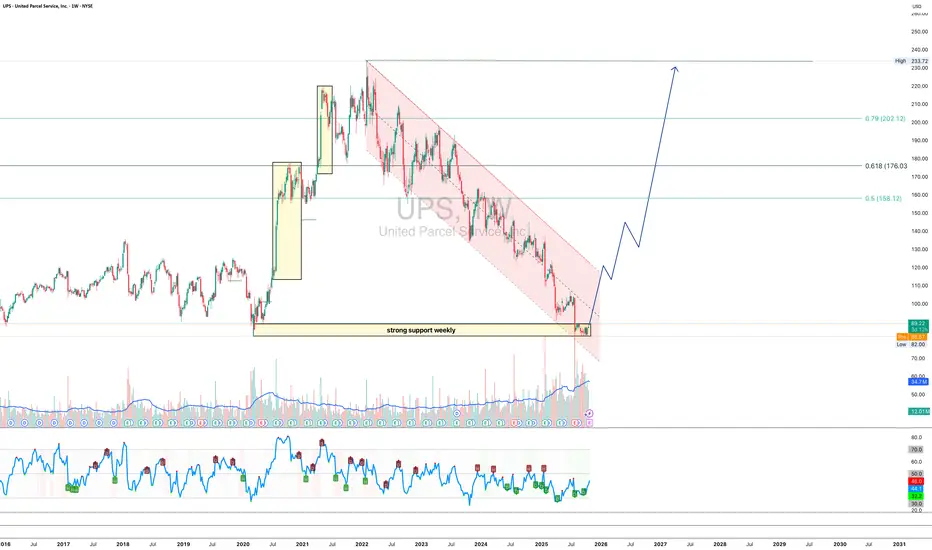
UPS 1W - delivery of a trend reversal is on the way?On the weekly chart, UPS is holding strong around the $82–90 support zone - a key level where buyers historically step in. The structure suggests the end of the long corrective channel and the potential start of a bullish reversal.
Technically, a confirmed breakout above the channel could trigger momentum toward $158, $176, and $202 - attractive targets for mid-term traders.
From a fundamental standpoint, UPS continues to streamline operations, improve automation, and prepare for peak season shipping. Growing e-commerce volumes and steady fuel costs may support stronger margins ahead. If earnings start to reflect these improvements, the stock could easily shift gears into a sustainable uptrend.
* UPS announced that it will report its Q3 results on October 28, 2025.
* The company is introducing increased seasonal charges and shipping rates starting October 26 ahead of the holiday season, which may temporarily reduce demand.
* UPS also announced plans to equip 5,000 of its trucks with air conditioning in the hottest regions of the US, a step to improve working conditions but at a cost.
* The high dividend yield (~7.5%) raises questions about sustainability, as the payout is almost equal to free cash flow.
Tactical play: as long as $82–90 holds, bulls have the initiative. Once the breakout is confirmed - the next big delivery might just be profits.
Searching for my entry in NVIDIA Significant resistance at $160, which if broken could lead to a drop to $140.
We will have to wait until February to see the results in terms of earnings (for my part, I expect it to continue to perform better than expected due to the high demand for the company's chips).
The world is driven by narratives, and no one wants to be left behind...
I haven't bought any yet, but I'll let you know when I do.

Pinterest | PINS | Long at $26.20Pinterest's NYSE:PINS continued user growth is quite impressive, especially among Gen Z. Factoring in global expansion, the revenue and earnings projections caught my attention. Currently trading around a 9x price-to-earnings, it's kind of a sleeper in the tech world *if* the user numbers and forecasts are accurate. Annual EPS is expected to almost double by 2028, going from $1.29 in 2024 to $2.46 in 2028. Projected revenue growth is almost the same, growing from $3.6 billion in 2024 to $6.3 billion in 2028. Also, the company has a very low Debt-to-Equity Ratio (4%) and very strong cash flow. Projections .
From a technical analysis angle, it's in a consolidation phase - trading sideways and confusing investors. The price is having a hard time staying above or below its historical mean, but there are plenty of gaps above and below the current price to fill. A company like NYSE:PINS can benefit significantly from AI utilization and capturing a share of the great wealth transfer, but the news is harping on a bad economy / reduced ad revenue.
Personally, this is one of those "why doesn't the price reflect the fundamentals" plays. Yes, there is competition, but the user growth continues to be impressive. Insiders are selling at an alarming rate ( openinsider.com ), though. Something doesn't add up. So, personally, a decision based on the numbers (as reported today) is the only way to go. Thus, at $26.20, NYSE:PINS is in a personal buy zone. If this ticker truly tanks and fishy company news emerges, it's going to drop near $12 or below.
Targets into 2028
$32.00 (+22.1%)
$50.00 (+90.8%)

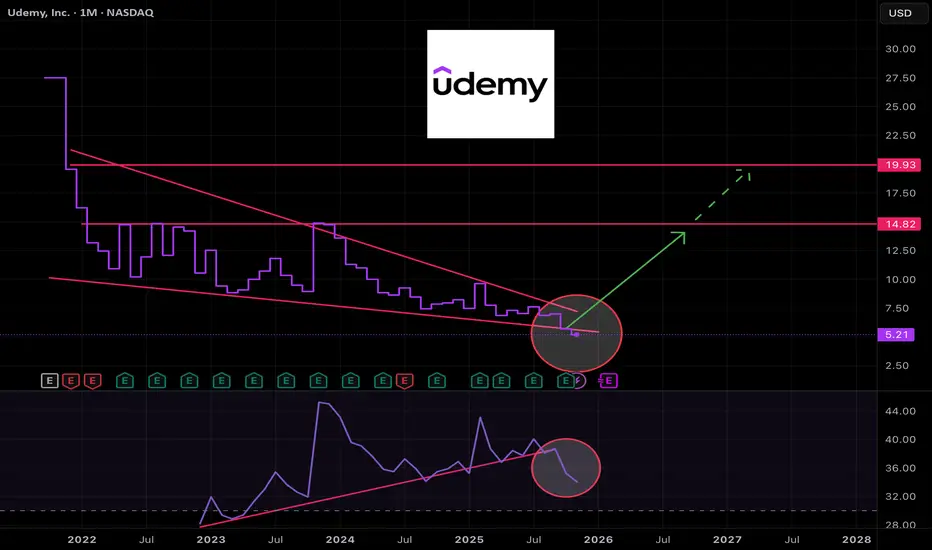
UDMY turning profitable and in deep value territoryNASDAQ:UDMY stock has been left for dead. It's formed a massive falling wedge on the monthly chart and until late has done so with improving momentum.
While not strictly aligned to disciplined charting techniques I view the recent meltdown in momentum as capitulation and a good time to start a small position.
Looking at the annual and quarterly profit figures we can see the company has been bleeding cash for years, but in recent quarters is starting to make a small profit.
It's a speculative buy, so keep the position sizing small, but I think there's room to double or even triple with sufficient time.
Investment Grade VS High Yield AMEX:LQD is meeting the demand zone here. Looks like risk appetite will start to cool down from here. Flight to safety is starting to show signs.
With all the private credit out there I don´t think AI is the go to at this point in time. Gold is likely to be benefiting from this aswell as creditworthy companies.
High beta stocks is at a danger zone from my perspective.
BOJ´s rate hike could be the trigger on friday.
As always. This is not a financial advise. Always do your own research and investment decisions.
