To 700 or Not To 700? OBV Might Be The ClueEdit: Sorry for the jank chart on the front of this idea, I didn't realize the view I had when I published this idea would be the main one for this idea. Anyway...
I ran upon an indicator new to me, and just thought I'd manifest my observations and thoughts on this interesting indicator. Here's what Google AI has to say about it:
The On-Balance Volume (OBV) indicator is a momentum tool that measures buying and selling pressure by adding volume on up days and subtracting it on down days. It is used to confirm trends when OBV moves with price, or to signal potential trend reversals (divergences) when OBV moves in the opposite direction.
+How to Use the OBV Indicator:
-Trend Confirmation: When both price and the OBV line are making higher peaks and higher troughs, a bullish trend is likely to continue. Conversely, lower peaks and lower troughs in both indicate a bearish trend is likely to continue.
-Identify Divergences (Reversals): A bullish reversal signal occurs when the price makes a lower low, but the OBV line makes a higher low, suggesting buying pressure is building despite price drops. A bearish reversal signal occurs when the price hits a higher high, but the OBV line hits a lower high, indicating selling pressure.
-Identify Accumulation/Distribution: During a flat, sideways trading range, a rising OBV indicates accumulation (smart money buying), while a falling OBV indicates distribution (selling).
So we all see the consolidation that has been going on with AMEX:SPY since October. Won't go up, but also won't go down...
So here's a throwback to the infamous bear market of 2022. As you can see, the OBV indicator fails to make new highs while the underlying AMEX:SPY not only retests ATHs but makes new ATHs.
And now, in what looks like our consolidation, we can see that the lack of new highs is shadowed by the AMEX:SPY also making new ATHs and retesting previous ATHs.
Additionally, we see that AMEX:SPY is bordering the upper trendline of a long-term bullish channel.
Counter theses to this idea is that NASDAQ:NVDA does NOT behave like its magnificent 7 brethren and instead edges higher or explodes after its earnings report comes out. Another counter would be a surprise jobs number or inflation data point that points to rate cuts, however as we have seen today (2/11/26) a really good job data point resulted in a slightly down AMEX:SPY as good news basically confirms a "higher for longer" fed rate. Unless we get a hot inflation print or horrible job numbers, an NASDAQ:NVDA sell the news reaction could result in a drastic decline in AMEX:SPY soon.
I would assume that a far down AMEX:SPY strike would outweigh the risk of a "day-one" scenario after NASDAQ:NVDA earnings. I'm no data center guru but I could see how RAM price surging in the last year could affect the bottom-line of data center / AI farm users who purchase NASDAQ:NVDA GPUs, and a hurting bottom-line for them could result in reduced sales in GPUs.
**This is not financial advice**
Also, this is the first idea I have written and published.
Earningsplay

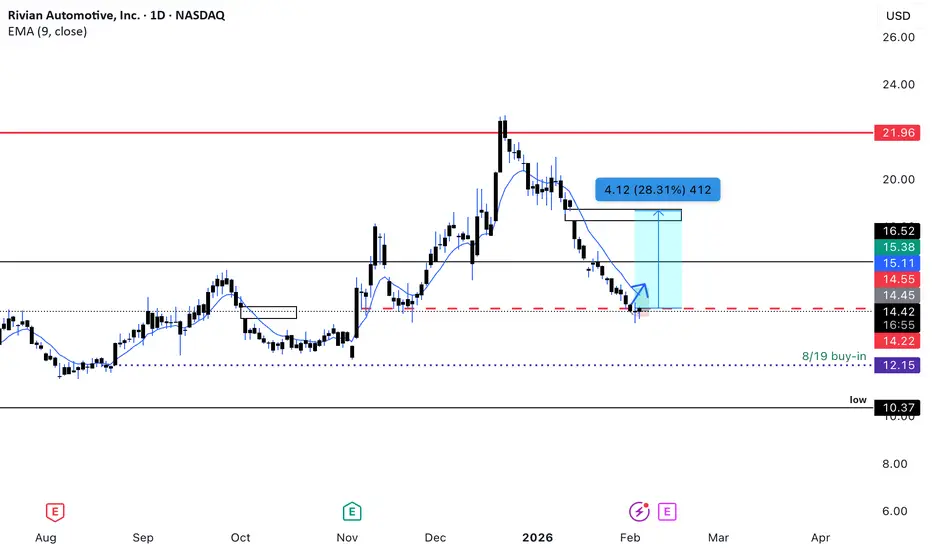
RIVN EV $17 elevator Earnings THIS IS NOT FINANCIAL ADVICE: These are my technical analysis in word format. DYOR
NASDAQ:RIVN saw a nice breakout early NOV 2025 from this $13 range to APEX $22 in DEC 2025.
- This was a 70% move
Consolidated in Jan 2026 around $19 until the selling pressure dropped it back to this $14 arena. As we have stayed above the initial $13 breakout zone I have noticed 3 hings:
Thing 1: Amazon also sold off during early JAN 2026 (amazon is RIVNs big buyer)
Thing 2: NASDAQ:AMZN earnings are strategically 7 days prior to RIVN
Thing 3. RIVN is picking up massive steam in the EV race and looks to give NASDAQ:TSLA a true run for its money in product value and US built sentiment.
NASDAQ:AMZN price to met: $245+
NASDAQ:RIVN price to meet: $17.50+
With amazon set to show positive growth on earnings we can expect a bullish pop on RIVN to test $15.
Next week we can see a larger push to $17 for RIVN earnings.
Possible 30% move on this stock in 14-28 days.
V Earnings Setup — Positive Gamma, Dealer Support Above 330💳 V (Visa) — Earnings Liquidity Playbook
🧭 Market Structure Snapshot
📈 Trend: Higher-timeframe pullback into weekly support + value
🏗 Structure: Acceptance holding above prior weekly lows
⚡ Momentum: SMI curling up from oversold → bullish momentum rebuild
📊 Volume: Selling pressure exhausted, volume stabilizing at support
🎯 Bias: Upside favored while above HVL
🗺 Key Levels (This Is the Map)
🟢 Bullish Control Zone
HVL (Gamma Flip): 327.5
0DTE HVL: 330
➡️ Above this zone = dealers stabilize price → upside expansion favored
🛡 Immediate Support
Primary Support: 326–328
Put Wall / Dealer Defense: 320
⛔ Hard Risk Line: Below 320 = thesis invalid
🚀 Upside Targets (Gamma-Driven)
330-335 → first squeeze zone
340 → major call resistance + gamma wall
345–350 → extension if earnings reaction is strong
🧲 Gamma + Liquidity Read
Gamma Condition: ✅ Positive / Call-Dominated
Net GEX: +10.15M (≈ +87% day-over-day)
DEX Explosion: +1700% → dealers increasingly long gamma
Volume Skew: Calls > Puts, P/C ratio falling
Heavy Call Interest: 330, 335, 345, 350
👉 Translation:
Above 327.5–330, dealers hedge upward → dips get bought, rips accelerate.
🎯 Execution Playbook
🟢 Bullish Scenario (Primary)
🔔 Trigger
Hold above 327.5–330
SMI crosses up with price holding value
No heavy rejection wick at 330
⚙️ Execution
Calls or call spreads after acceptance above 330
Scale on pullbacks into 330–328
🎯 Targets
Trim into 335
Core target 340
Runner toward 345–350 if volume expands
🔴 Bearish Scenario (Secondary / Hedge Only)
🔔 Trigger
Hard rejection at 330
Breakdown + acceptance below 327
SMI rolls over + downside volume expansion
🎯 Targets
322
320 (put wall / dealer defense)
⚠️ Below 320 = full reset, step aside

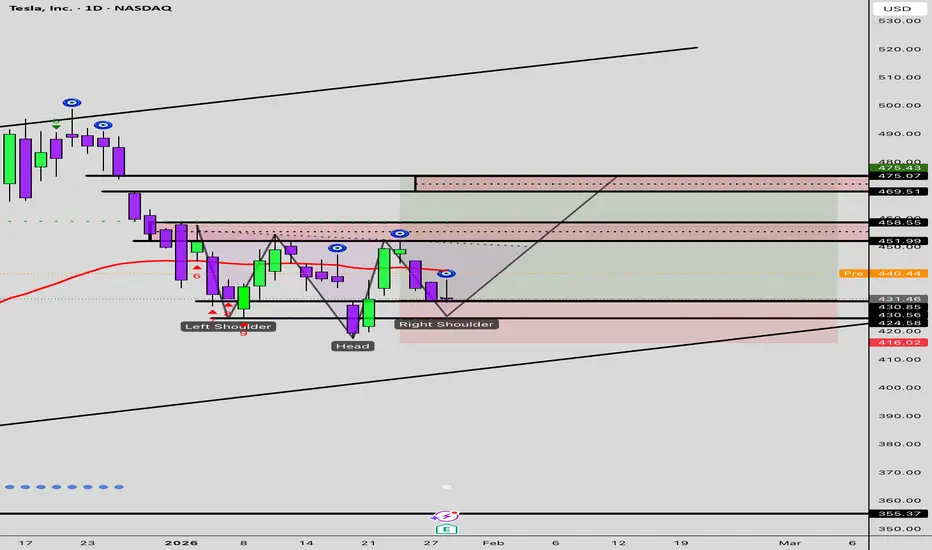
TSLA (Tesla) Long Set Up Entry Price 1: $432.00
Entry Price 2: $424.00
Stop Loss: $414.00
Take Profit 1: $442.00 (Close 25%)
Take Profit 2: $452.00 (Close 50%)
Take Profit 3: $462.00 (Close 75%)
Take Profit 4: $475.00 (Close 100%)
Can WEAV Repeat Its Past Bullish Earnings Performance?WEAV - CURRENT PRICE : 7.41
Historically, WEAV has shown strong rallies following positive earnings announcements, as highlighted by the green circles on the chart. The current price setup shows a similar early rebound pattern, suggesting potential for another upward move if bullish sentiment continues.
Technical Setup:
Price is rebounding from recent lows, forming a potential bottom structure.
Previous two rallies after earnings were followed by strong momentum — the current setup mirrors that historical behavior.
Volume has slightly increased, indicating renewed buying interest.
If price sustains above near-term support, a continuation move could follow.
ENTRY PRICE : 7.20 - 7.41
FIRST TARGET : 8.30
SECOND TARGET : 9.00
SUPPORT : 6.46 (Low of 30 October 2025 candle)
Notes: Investors who wish to review the company’s earnings details may visit its official website.

CRDO Earnings Swing: High-Conviction Call Play Amid Pre-EarningsCRDO QuantSignals V3 Earnings | 2025-12-01
Trade Type: BUY CALLS
Confidence: 65% (Medium conviction)
Expiry: 2025-12-05 (4 days)
Strike: $175.00
Entry Range: $12.40 – $13.90 (mid: $13.15)
Target 1: $19.80 (+50%)
Target 2: $26.70 (+100%)
Stop Loss: $9.25 (-30%)
24h Move: +16.48% (pre-earnings run-up)
Flow Intel: Neutral
Earnings Estimate: $0.50
Analysis Summary:
Katy AI predicts bearish movement (-17.92%) but composite bullish score (+5.3) favors calls.
Technicals: Overbought stochastics (89.4), resistance at $183.69, support $170.
News/Sector: Strong semiconductor momentum, 240% revenue growth, 100% historical beat rate.
Options Flow: Neutral, implied volatility high (174%), balanced delta 0.4–0.6.
Risk Level: HIGH – due to AI conflict, overbought technicals, and extreme IV.
Positioning Notes:
Use smaller position size due to risk/conflict.
Monitor for IV crush post-earnings.
Tight stop loss recommended.
Quick Trade Setup:
Instrument: CRDO
Direction: CALL (LONG)
Strike: 175.00
Entry Price: 13.15
Target: 19.80 / 26.70
Stop Loss: 9.25
Expiry: 2025-12-05
Position Size: 2% portfolio

LULU Analysis | Crucial Support & Resistance Before EarningsIn this video, I break down a complete Lululemon (LULU) stock analysis ahead of its upcoming earnings.
You’ll learn the key support & resistance levels, expected volatility zones, and the technical signals that matter most.
🔍 What’s Inside the Video:
Lululemon’s current trend & momentum
Technical breakdown (chart pattern + volume + indicators)
Key support & resistance levels to watch
Earnings expectations & potential price reactions
Upside and downside targets
Risk zones and invalidation levels
Short-term and swing-trade ideas
📈 Why This Matters
LULU earnings often create huge price swings.
This video gives you a clear, actionable view of how the stock might react and what levels traders should focus on.

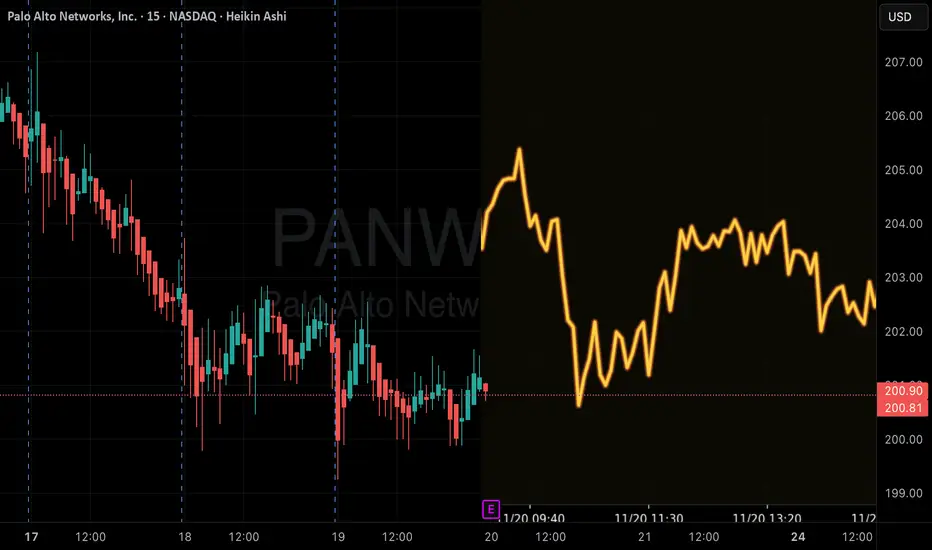
PANW Short-Term Reversal CALL – High-Probability SetupPANW QuantSignals V3 – Short-Term CALL Trade (2025-11-19)
Trade Signal:
Direction: BUY CALLS (Long)
Strike Price: $202.50
Entry Range: $6.20–$6.40 (mid $6.30)
Target 1: $9.30 (50% gain)
Target 2: $12.40 (100% gain)
Stop Loss: $4.65 (25% risk)
Expiry: 2025-11-21 (2 days)
Position Size: 2% of portfolio
Confidence: 65% (Medium)
Market Analysis:
Trend: Katy AI shows NEUTRAL trend with slight downward bias (-0.32% over prediction period)
Price Action: Current $201.10 near session lows, bearish momentum (ROC: -5.62%)
Technicals: RSI 26.4 (oversold), resistance $203.99, support $199.00
Options Flow: Bullish, Put/Call Ratio 0.48, institutional call interest at $245 strike
News Sentiment: Positive – IBM quantum-safe partnership, strong earnings focus
Volatility: Medium – technical bounce potential from oversold levels
Competitive Edge:
Oversold RSI + strong call flow creates a high-probability reversal setup
2-day expiry captures potential short-term bounce
Tight stop limits downside while allowing technical reversal play
Risk Notes:
Katy AI neutrality with slight bearish bias requires careful monitoring
Earnings not until 2026-02-11 – this is a technical/reversal trade, not earnings-driven
Low volume (0.8x average) suggests position size should be moderate
Strategy Rationale:
Overrides Katy AI neutrality due to strong technical and options flow evidence
Bullish reversal opportunity supported by oversold RSI, institutional calls, and positive news
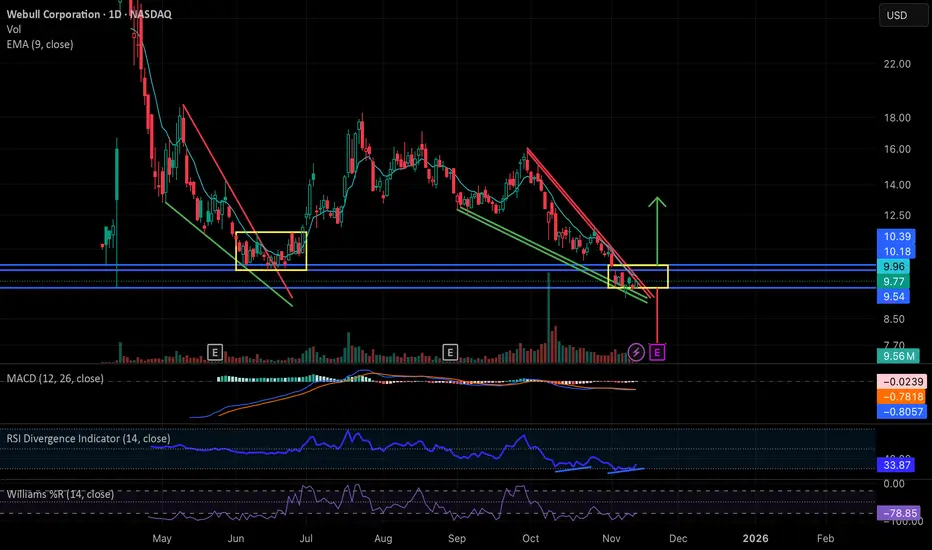
Webull: Falling Wedge Breakout ImminentNASDAQ:BULL has been in a steady decline essentially since the start of the government shutdown, forming a clean falling wedge structure very similar to the setup we saw in May and June. Back then, the wedge resolved with a brief breakout but ultimately moved into a sideways consolidation inside the yellow range before finally lifting in late June/early July.
Price is now sitting at the apex of a new wedge right as the government has officially reopened, almost to the day. With the president signing the bill, this may act as a macro green light for liquidity into year end, and BULL is positioned to potentially benefit from that.
Technically, the stock is deeply beaten down (roughly 40 percent from pre-shutdown levels), the MACD is starting to curl up, and there’s a clear daily RSI divergence. Together, these conditions make a relief move or breakout increasingly plausible.
If we don’t get a meaningful directional move between now and earnings on 11/20, then the most likely scenario is a replay of the May/June pattern: a period of sideways chop inside its current established support and resistance band zone around 9.54-10.18/10.39 while the market waits for the earnings catalyst. That report would then determine the next substantial move up or down.
In short: BULL is at a technical decision point, with momentum indicators improving, macro pressure easing, and earnings close enough that either a near-term wedge break or a consolidation-before-catalyst are both reasonable outcomes from here.
AMD Trade Setup | AI Leadership + Strong Earnings MomentumAdvanced Micro Devices NASDAQ:AMD remains a key name in the ongoing AI and semiconductor rally. Just ahead of earnings, AMD announced a $1B partnership with the U.S. Department of Energy (DOE) (Oct. 27), a major validation of its role in high-performance computing. This bullish development set the stage for strong momentum into the earnings release.
🚀 Earnings Recap:
AMD delivered a solid Q3 report with 36% YoY revenue growth, margin expansion, and upbeat guidance. The Client and Data Center segments led the charge, while Embedded was softer. With macro support for semiconductors and increasing AI investment, market sentiment remains bullish.
🔧 Trade Plan:
Entry: $224
Take Profit 1: $248
Take Profit 2: $267
Stop Loss: $211

$SHOP: A 4-Year Pattern Breakout Before EarningsWith the AI bubble looking frothy, investors are hunting for the next big rotation. The consumer holiday play looks like the perfect switch, and all eyes are on $SHOP.
This is looking like a clean breakout from a massive 4-year rounding bottom—a pattern this big is a major deal.
The setup couldn't be more critical:
• Catalyst: Earnings are tomorrow (Nov 4) pre-market.
• Sector: AMZN just hit a record high. The e-commerce holiday season is the clear narrative right now.
• History: SHOP has a strong track record of beating revenue estimates for the last two years.
• Momentum: The stock is already up over 60% YTD and the RSI is high, showing strong buying interest.
• High Beta: The stock's beta is over 3.5. This thing is built to move on a catalyst.
You have a long-term technical break, a major sector rotation, and a huge earnings catalyst all hitting at the same time. This is a powerful combination. Watching this one very, very closely today.

META Buy Opportunity – KZDZ ModelMETA Game Plan – KZDZ Model
📊 Market Sentiment
On 29/10, the FED lowered rates by 25BPS, as expected. However, Powell’s remarks added uncertainty around further cuts in December, stating that future decisions will be data-dependent.
One FED member dissented, preferring no cut this cycle — a notable shift from September’s unanimous decision.
Following this, rate-cut expectations dropped from 95% to 68%, sparking short-term bearish sentiment as traders took profits and hedged exposure.
Despite this volatility, the mid-to-long term outlook remains bullish given the broader liquidity cycle and easing policy stance.
📈 Fundamental
META earnings missed expectations, triggering a sharp sell-off. While short-term sentiment is bearish, the long-term outlook remains supported by ongoing AI development initiatives.
📈 Technical Analysis
1-Hit oversold RSI on the daily timeframe.
2-Retraced to the 0.5 Fibonacci equilibrium zone (≈ $640).
3-Tested a major HTF Key Zone around $625, signaling potential accumulation.
📘 Model in Use – Key Zone with Discount Zone (KZDZ Model)
The KZDZ Model identifies areas where discounted Fibonacci levels align with strong HTF liquidity zones, offering high-probability reversal opportunities.
1️⃣ Identify HTF Key Zone
2️⃣ Align with Discount Zone (0.5–0.75 range)
3️⃣ Look for confirmation structure on LTF
4️⃣ Execute and manage risk accordingly
📌 Game Plan
Scenario 1 (Black Path): Watch for price to hit $625 and close above $640 (daily). Upon confirmation, plan to buy C640 options targeting $680–$700.
Scenario 2 (Red Path): If price fails to reclaim $640, monitor for a deeper move to $560, then look for weekly rejection above that zone. Entry via C560 options, targeting $620–$700.
🎯 Setup Trigger
Scenario 1 → Daily close above $640 after retesting $625.
Scenario 2 → Weekly close above $560 zone.
📋 Trade Management
Scenario 1: Buy C640 Calls → take profits at $680–$700.
Scenario 2: Buy C560 Calls → partial profits $620–$640, rest at $680–$700.
Move stop to breakeven after first target is hit.
💬If this META breakdown supports your outlook, like, comment, and follow.
For deeper sentiment and strategy updates, subscribe to my Substack free access available.
⚠️ This analysis is for educational purposes only and does not constitute financial advice. Always conduct your own research before trading or investing.

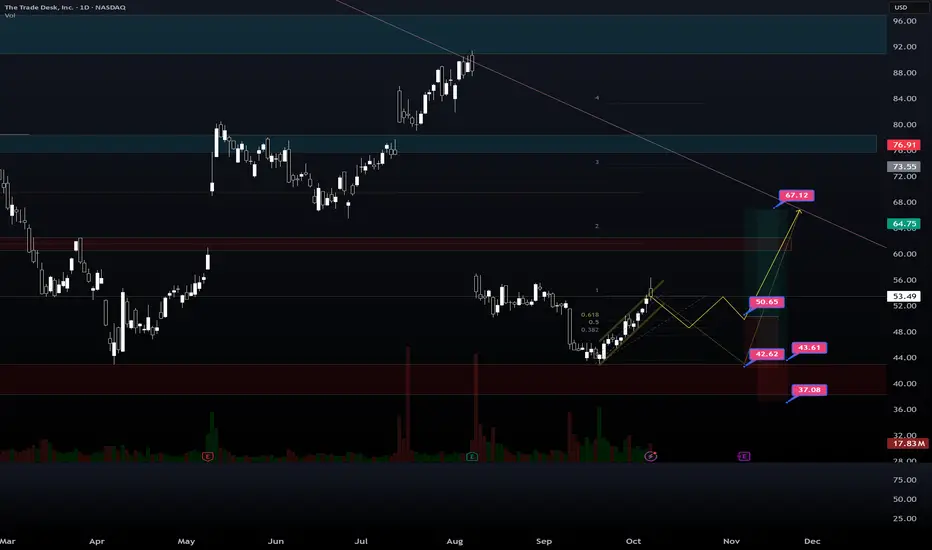
TTD (swingtrade) Earning plays, waiting for pullbacki have 2 option to entry TTD.
this set up to get entry when ttd earning.
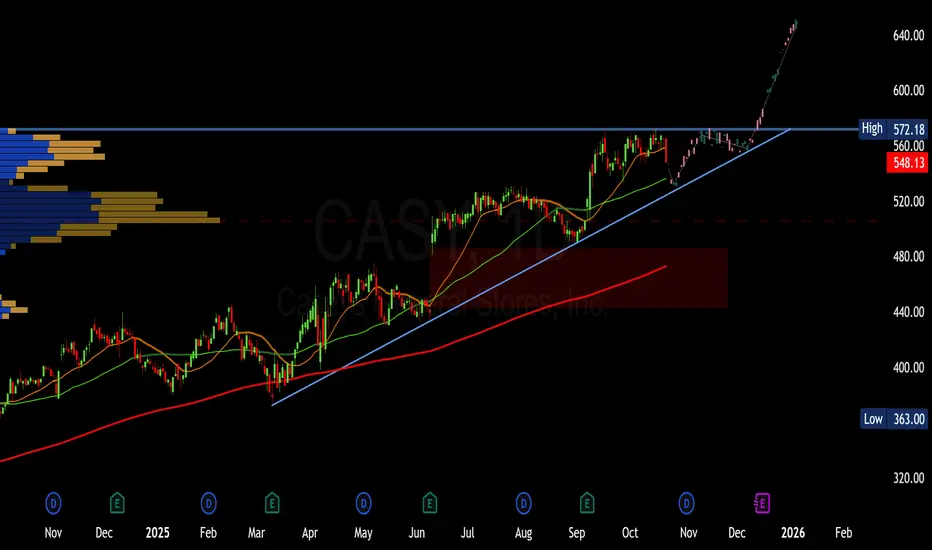
CASY Casey's potential ascending triangleNASDAQ:CASY Casey's is forming a potential ascending triangle, with higher lows (~$540–$550) and resistance at $580–$600. Bullish momentum (RSI ~65, positive MACD) suggests a breakout above $600 could target $620–$650 as Q2 earnings approach in December. A pullback to the $445–$480 gap offers a strong entry point for longs. Watch volume and earnings catalysts! Casey's General Stores, Inc. operates approximately 2,900 convenience stores in 19 states.
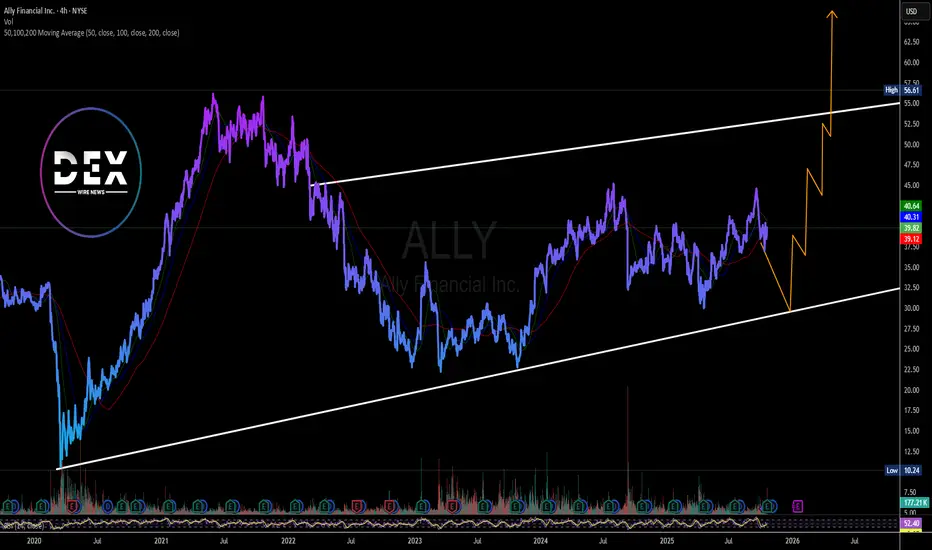
Just In: Ally Financial ($ALLY) Is Set to Breakout of A Wedge Ally Financial (NYSE: NYSE:ALLY ) is gearing up for a 35% surge that will break the ceiling of a falling wedge formed since April, 2025 amidst bullish sentiments.
The asset is trading in tandem to the moving averages with the RSI at 52, we might experience consolidation to the base of the wedge at $30 zone before picking liquidity up to the upside.
In another news, Ally Financial reports third quarter 2025 financial results.
Net income attributable to common shareholders was $371 million in the quarter, compared to $171 million in the third quarter of 2024. Net financing revenue was $1.6 billion, up $64 million year over year. Net interest margin (“NIM”) of 3.51% and net interest margin excluding core OIDA of 3.55% were up 22 and 23 bps year over year, respectively.
Other revenue decreased $31 million year over year to $584 million including a $27 million increase in fair value of equity
securities in the quarter compared to a $59 million increase in the third quarter of 2024.
Noninterest expense increased $15 million year over year.
View full press release in PDF: mma.prnewswire.com
Lovesac Bulls Loading: Strike $22.50 Call Opportunity
💖 **LOVE Earnings Alert | 2025-09-10** 💖
**Directional Bias:** Moderate Bullish (65% Confidence) ✅
**Why This Trade?**
* Historical beat rate: 88% over last 8 quarters 📊
* Recent accumulation & positive call OI bias
* Price above 20 & 50 DMA; strong pre-earnings drift
* Weak fundamentals (negative FCF & operating margin) reduce conviction → **moderate bias**
**💡 Trade Recommendation:**
* **Instrument:** LOVE weekly call
* **Strike:** \$22.50 💰
* **Expiry:** 2025-09-19
* **Entry Price (Ask):** \$1.35
* **Direction:** LONG ✅
* **Entry Timing:** Pre-earnings close
* **Position Size:** 1 contract (scale to 1–2% account risk)
**🎯 Targets & Stops:**
* **Profit Target:** \$4.05 (+200%)
* **Partial Profit:** \$2.70 (+100%)
* **Stop Loss:** \$0.675 (-50%)
* **Exit Timing:** Within 2 hours post-earnings or next open
**📈 Key Levels:**
* Support: \$19.00–19.20
* Resistance: \$20.70 intraday / \$21.62 (200-DMA)
**⚡ Key Risks:**
* Weak operating fundamentals → “beat but sell-off” trap
* Low liquidity / micro-cap spreads → slippage
* IV crush / theta decay post-print → exit quickly
* High beta → amplified downside if market turns
**💎 Trade Strategy:**
* Asymmetric risk/reward: limited downside = premium paid, unlimited upside if earnings beat & gap occurs
* Single-leg naked call; tight stops to manage volatility & IV
**📊 JSON Trade Snapshot:**
```json
{
"instrument": "LOVE",
"direction": "call",
"strike": 22.50,
"expiry": "2025-09-19",
"confidence": 0.65,
"profit_target": 4.05,
"stop_loss": 0.675,
"size": 1,
"entry_price": 1.35,
"entry_timing": "pre_earnings_close",
"earnings_date": "2025-09-11",
"earnings_time": "AMC",
"expected_move": 12.0,
"iv_rank": 0.70,
"signal_publish_time": "2025-09-10 15:49:59 UTC-04:00"
}
```
💥 **TL;DR:** Moderate bullish thesis for LOVE earnings. Buy \$22.50 call pre-print, exit fast post-announcement. Tight stops, small size, asymmetric upside — risk defined, potential huge reward.

RH Earnings Lotto: 250C Targeting 200%+ Overnight”
⚡ **RH Earnings Lotto (AMC 9/11)** ⚡
📊 **Setup:**
* 🎯 Strike: **250C**
* 💵 Entry: **8.90**
* 📅 Expiry: **2025-09-12**
* 📈 Confidence: **75% (Moderate Bullish)**
🎯 **Targets & Risk**
* 🛑 Stop: **4.45** (-50%)
* 🎯 Profit: **26.70** (+200%)
* 📏 Size: 1 contract (≈2% port)
* ⏰ Timing: **Pre-earnings close**
🔥 **Why this trade?**
* Options market pricing a **12.7% move**
* Heavy **call OI at 250 (853 contracts)**
* Positive narrative: European expansion + bullish analysts
* Low VIX environment supports luxury/growth names
💡 **Play Idea:** Buy RH 250C @ 8.90 → Stop 4.45 / PT 26.70.
Risk/Reward ≈ **1 : 2+** 🎯
---

CASY Bullish Setup — Strike $520, Profit Target $31.80!
🚀 **CASY Earnings Trade Alert** (2025-09-08)
**Directional View:** **Moderate Bullish** 💹
**Confidence:** 68%
**Trade Setup:**
* **Instrument:** CASY
* **Strategy:** BUY CALL (single-leg)
* **Strike:** \$520
* **Expiry:** 2025-09-19
* **Entry Price:** \$10.60
* **Entry Timing:** Pre-earnings close (AMC 2025-09-10)
* **Size:** 1 contract
**Targets & Risk:**
* **Profit Target:** \$31.80 (\~200% gain)
* **Stop Loss:** \$5.30 (\~50% loss)
* **Breakeven:** \$530.60
**Why This Trade?**
✅ Fundamentals: 8/8 quarters beat, avg +20% surprise, strong cash flow
✅ Technicals: Support at 20-DMA, accumulation into pre-earnings session
✅ Options Flow: Tradable 520 call, decent OI, positive gamma setup
✅ Sector Tailwind: Specialty retail resilient, low Beta 0.66
**Key Risk:**
⚠️ No official earnings date confirmed in dataset — verify before scaling.
⚠️ IV crush post-earnings could pressure premium.
⚠️ Wide bid/ask spreads → manage execution carefully.
**Expected Move:** \~8% upside potential → \$546 stock target, supporting large option gains
**Quick Takeaway:**
* Strong fundamentals + technical tilt = **bullish earnings setup**
* Manage risk strictly with **hard stop + time-based exit**
* Capture pre-earnings IV spike, exit within first 1–2 hours post-announcement
---
📊 **TRADE DETAILS (JSON for precision)**
```json
{
"instrument": "CASY",
"direction": "call",
"strike": 520.0,
"expiry": "2025-09-19",
"confidence": 68,
"profit_target": 31.80,
"stop_loss": 5.30,
"size": 1,
"entry_price": 10.60,
"entry_timing": "pre_earnings_close",
"earnings_date": "2025-09-10",
"earnings_time": "AMC",
"expected_move": 8.0,
"iv_rank": 0.70,
"signal_publish_time": "2025-09-08 14:07:24 EDT"
}
```
💡 **Pro Tip for Traders:** Scale out at +50%/+100% gains, respect stop, and never hold past the first 2 hours post-earnings reaction.

RBRK $97.50 CALL — Earnings Beat Setup You Can’t Miss!
# 💻🔥 RBRK Earnings Play: 200%+ Upside Setup!
📊 **Earnings Analysis Summary (2025-09-08)**
💡 **Trade Idea:**
👉 Buy **1x RBRK \$97.50 CALL** (exp. 2025-09-19) at **\$7.60** (pre-earnings close).
This is a **single-leg naked call** designed for a tactical earnings pop.
---
### 🧩 Why This Trade?
* 📈 **Revenue Growth:** +48.7% TTM 🚀 (SaaS momentum).
* 💰 **Gross Margin:** 76.4% → world-class unit economics.
* ✅ **Beat Machine:** 100% beat rate last 5Q, avg surprise +37%.
* 🛡 **Balance Sheet:** \$762M cash + FCF positive → de-risked growth.
* 📊 **Technical Setup:** Price \$90.93 > 20d/50d/200d MAs, RSI 65 (bullish).
* 🌎 **Macro Tailwinds:** Low VIX (15.4) + risk-on environment.
---
### 📊 Scores (1–10)
🔻 Fundamentals: 9
📈 Options Flow: 6
📊 Technicals: 8
🌎 Macro: 8
✅ Overall Conviction: **78% MODERATE BULLISH**
---
### 📌 Trade Plan
🎯 Entry: \$7.60 limit (pre-earnings close)
🛑 Stop Loss: \$3.80 (–50%)
💰 Profit Targets:
* +100% = \$15.20
* +200% = \$22.80
📆 Exit: within 2 hrs post-earnings to avoid IV crush
---
### ⚖️ Risk/Reward
* Max Loss: **\$760**
* Breakeven: \$105.10 (needs +15.6% move)
* Upside: +200% possible if earnings beat + guidance pop
---
📊 **TRADE DETAILS**
* 🟢 Instrument: RBRK
* 🟢 Direction: CALL
* 🎯 Strike: 97.50
* 💵 Entry: 7.60
* 🛑 Stop: 3.80
* 📅 Expiry: 2025-09-19
* 📈 Confidence: 78%
* ⏰ Earnings Entry: Pre-close
---
🚀💎🙌 This is a **high-conviction growth SaaS earnings bet**: risk \$760, aim for \$1,520–\$2,280 upside if history repeats with another big beat.

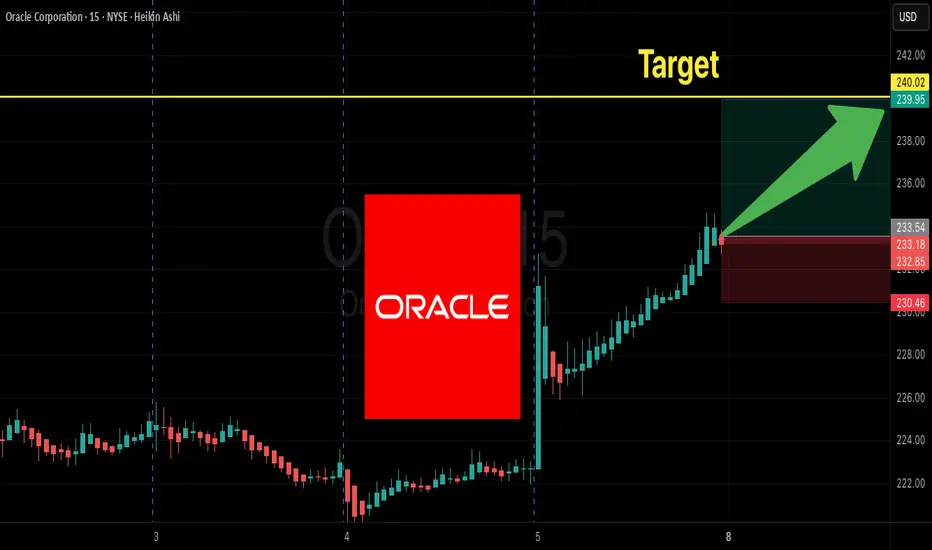
ORCL Weekly Call Setup — $240C Targeting Breakout!
# 🚀 ORCL Weekly Trade Setup (Sep 6, 2025) 🚀
### 🔎 Market Consensus
* **Momentum:** Weekly RSI strong (67.8 ↑), daily RSI improving (47.4).
* **Volume:** 1.5x weekly → institutional activity.
* **Options Flow:** C/P = **1.49** → bullish bias.
* **Volatility:** Low VIX (\~15) → cheap calls.
* **Consensus:** 📈 Moderate Bullish Weekly Bias
---
### 🎯 Trade Plan
* **Instrument:** ORCL
* **Direction:** CALL (LONG)
* **Strike:** 240C
* **Expiry:** 2025-09-12 (6 DTE)
* **Entry Price:** 8.30
* **Profit Target:** 10.40 (+25%) — stretch 12.30–16.40 if momentum holds
* **Stop Loss:** 4.95 (\~-40%)
* **Size:** 1 contract (scale by risk)
* **Entry Timing:** Market Open
* **Exit Rule:** Take profits in strength, exit **by Thu Sep 11** (avoid Friday decay/earnings risk)
* **Confidence:** 🔥 68%
---
### ⚖️ Key Risks
* Earnings risk inside 6-day window → binary volatility.
* High weekly volume could mean **distribution** if no follow-through.
* Theta/gamma crush into late week.
---
### 🧠 Alternative View
* Grok/xAI flags “No Trade” due to binary earnings event risk.
* Conservative traders may stay flat.
---
📊 **TRADE DETAILS (JSON)**
```json
{
"instrument": "ORCL",
"direction": "call",
"strike": 240.0,
"expiry": "2025-09-12",
"confidence": 0.68,
"profit_target": 10.40,
"stop_loss": 4.95,
"size": 1,
"entry_price": 8.30,
"entry_timing": "open",
"signal_publish_time": "2025-09-06 12:07:08 EDT"
}
```
---
🔥 \ NYSE:ORCL | \ AMEX:SPY | \ NASDAQ:QQQ | #OptionsTrading #TradingView #UnusualWhales #SP500 #StocksToWatch #UnusualWhales#GammaSqueeze#OptionsFlow#FlowTrading#WeeklyOptions#CallOptions#StockMarket#TradingView #Bullish#SP500Inclusion#StocksToWatch#MarketMoves#EarningsSeason#MomentumTrading#RiskReward
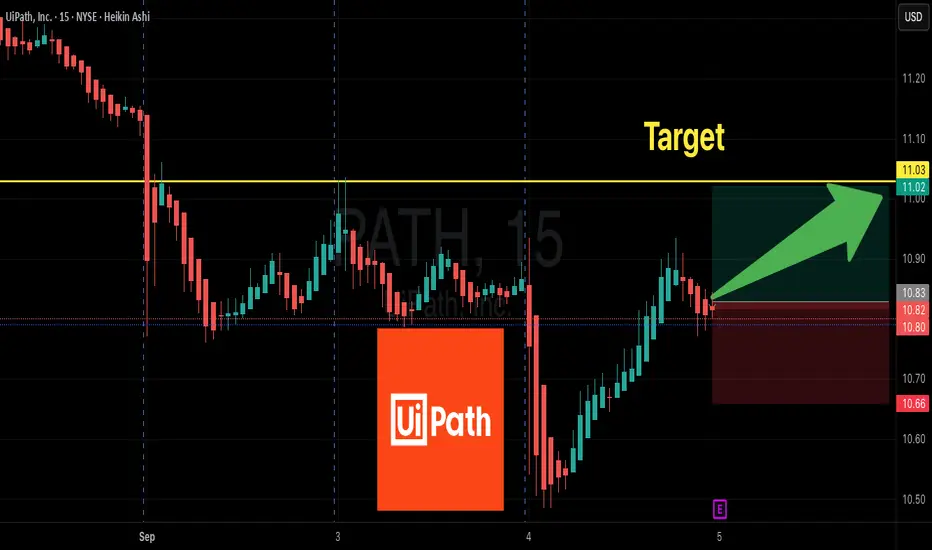
UiPath ($PATH) Earnings: Call the $11 Spike!
# 🚀 PATH Earnings Trade Setup — 09/04/2025
**Directional Bias:** **Moderate Bullish** (63% confidence)
**Event:** PATH FQ2 2026 Earnings (AMC 09/04/25)
**Strategy:** Short-dated, asymmetric **single-leg call**
---
## 🎯 Trade Details
| Item | Details |
| ----------------- | --------------------------------- |
| **Instrument** | PATH |
| **Direction** | CALL (LONG) |
| **Strike** | \$11.00 |
| **Expiry** | 09/05/2025 |
| **Entry Price** | \$0.58 |
| **Profit Target** | \$1.16 (+100%) |
| **Stop Loss** | \$0.29 (-50%) |
| **Size** | 1 contract (adjust per portfolio) |
| **Entry Timing** | Pre-earnings close |
| **Expected Move** | \~6% |
| **Confidence** | 63% (Moderate Bullish) |
---
## 🔍 Why This Trade
* **Guidance History:** 100% beat streak last 8 quarters → asymmetric upside.
* **Options Flow:** Heavy **call buying at \$11**, elevated OI & volume → potential **gamma squeeze**.
* **Technical:** Slightly bearish (below 50/200 MA) but neutral RSI — event-driven trade overrides weak technicals.
* **Fundamentals:** Strong cash & FCF; decelerating revenue & negative GAAP margins.
* **Macro/Sector:** Enterprise RPA tailwinds; cautious market sentiment.
---
## ⚡ Risk / Reward
* **Max Loss:** \$0.58 → \$58 per contract
* **Stop Loss:** \$0.29 → \$29 per contract
* **Target:** \$1.16 → \$116 per contract
* **R\:R (Stop / Target):** 1:2 (\~+200% upside vs -50% downside)
---
## 📈 Execution Tips
1. **Enter pre-close** on 09/04 at or near ask \$0.58.
2. **Scale out:** 50% at +100% (\$1.16), 50% at +200% (\$1.74).
3. **Hard stop:** 50% loss (\$0.29) or gap below \$10.00 → exit.
4. **Intraday exit:** Close within 2 hours post-market open if targets not hit.
5. **Size safely:** Risk ≤2–3% of portfolio.
---
## ⚠️ Key Risks
* Missed earnings / negative guidance → sharp drop, IV crush.
* High put OI below \$11 → downside hedges could exaggerate dips.
* Limited liquidity at open → use limit or mental price orders.
* Event-driven binary risk → only hold intraday; avoid overnight.
AVGO Earnings Lotto: $332.5C Could 3x Overnight!
🚀 **AVGO Earnings Trade Setup (2025-09-04)** 🚀
**Market Bias:** **Moderate–Strong Bullish** 💪
**Confidence:** 76% ✅
**Trade Idea:**
🎯 **Instrument:** AVGO
🔀 **Direction:** LONG CALL
💵 **Strike:** \$332.50
📅 **Expiry:** 2025-09-05 (Weekly)
💰 **Entry Price:** \$1.28
📈 **Profit Target:** \$3.84 (200% return)
🛑 **Stop Loss:** \$0.64 (50% of premium)
📏 **Size:** 1 contract
⏰ **Entry Timing:** Pre-earnings close (AMC on 2025-09-04)
**Rationale:**
* AI tailwinds & beat-and-raise history ⚡
* Strong call-side OI concentration at \$332.5–\$335 📊
* Favorable macro/tech rotation 🌐
* Risk: VMware guide-down or post-earnings IV crush ⚠️
**Key Levels:**
* Support: \$290–\$300 (put OI cluster) 🛡️
* Resistance: \$330–\$335 (call OI cluster) 🔝
**Risk/Reward:**
* Max loss: \$128
* Reward potential: \$256 → **\~4:1 R/R ratio** 🎯
* Breakeven at expiry: \$333.78
**Execution Notes:**
* Use **limit orders or algo** to reduce slippage
* Exit **by market open post-earnings** or at profit/stop targets
* IV crush expected: 30–50% ⚡
**Expected Move:** \~4.8% (implied by options)
**IV Rank:** 0.65
**Signal Published:** 2025-09-04 13:47 EDT
📊 **Trading JSON (for exact execution)**
```json
{
"instrument": "AVGO",
"direction": "call",
"strike": 332.5,
"expiry": "2025-09-05",
"confidence": 76,
"profit_target": 3.84,
"stop_loss": 0.64,
"size": 1,
"entry_price": 1.28,
"entry_timing": "pre_earnings_close",
"earnings_date": "2025-09-04",
"earnings_time": "AMC",
"expected_move": 4.8,
"iv_rank": 0.65,
"signal_publish_time": "2025-09-04 13:44:50 UTC-04:00"
}
``

CRM Earnings BEAR PLAY--$235 Put Target→Don’t Miss Out
## 💣 CRM Earnings Bear Play 🚨 | Put \$235 Setup (Sep 5 Expiry) 📉🔥
### 📊 Summary
CRM earnings setup skews **bearish** despite durable cash flow:
* **Fundamentals:** Strong margins & FCF, but **revenue slowing (7.6% TTM)** + high bar for AI guidance.
* **Options Flow:** Heavy put OI at **\$230–240** vs scattered calls → institutions hedging downside.
* **Technicals:** Price under 50/200-day MA, RSI overbought (71). Short-term bounce inside longer downtrend.
* **Macro:** Rising VIX + risk-off tone = higher downside sensitivity.
**📈 Net View:** 🔴 **Moderate Bearish (74% confidence)** → downside risk outweighs upside into earnings.
---
### 📝 Trade Plan
* 🎯 **Instrument:** CRM
* 🔀 **Direction:** Put
* 💵 **Entry:** \$2.61
* 📅 **Expiry:** 2025-09-05
* 🎯 **Profit Target:** \$7.83 (+200%)
* 🛑 **Stop Loss:** \$1.305 (-50%)
* 📈 **Strike:** \$235
* ⏰ **Timing:** Enter **pre-earnings close** (Sep 4, AMC earnings).
⚠️ **Exit:** Within 2 hours post-print — avoid IV crush & second-day reversal.
---
### 🚀 Hashtags (TradingView Viral)
\#CRM #EarningsPlay #OptionsTrading #PutOptions #BearishSetup #WeeklyOptions #EarningsTrade #GammaFlow #IVCrush #StocksToWatch #HighRiskHighReward #SmartMoneyFlow #TechnicalAnalysis
