Xometry (XMTR) — AI-Powered Manufacturing Marketplace at ScaleCompany Overview
Xometry NASDAQ:XMTR is an AI-driven digital manufacturing marketplace connecting buyers to a global supplier network for CNC machining, 3D printing, and injection molding, with instant pricing & lead times that compress sourcing cycles across aerospace, auto, and medtech.
Why It’s Winning
Category Disruption: Digitizing a $275B fragmented custom manufacturing market; stronger demand for resilience, speed, and ESG transparency.
AI Pricing Engine: Dynamic quoting + supplier matching increase fill rates, margin capture, and buyer retention.
Enterprise Adoption: Larger accounts leaning into digital sourcing for agility and cost certainty.
Q3’25 Highlights
Revenue: $181M (+28% YoY); Marketplace +31%
Margins: Record 35.7% gross margin
Profit Path: $6.1M adjusted EBITDA, demonstrating operating leverage
Setup & Catalysts
Expansion in regulated verticals (aero/med), supplier enablement tools, and cross-sell of fintech/logistics add-ons.
Flywheel strengthens as data density improves AI quoting accuracy and supplier utilization.
Trading Plan
Bullish above: $48–$50
Target: $110–$112 — supported by marketplace scale, AI-driven margin expansion, and accelerating enterprise mix.
📌 XMTR — the operating system for custom manufacturing.
Earningsreport

Breaking: Planet Labs PBC (NYSE: PL) Spike 25% Today The price of Planet Labs PBC (NYSE: PL) broke out of a bullish flag pattern surging 25% today albeit market turmoil. The stock is eyeing the $20 resistant amidst bullish sentiment.
However, with RSI at 76 the stock might experience a respite before picking liquidity up.
In another news, Planet Reports Financial Results for Third Quarter of Fiscal Year 2026
Earnings Highlight
Delivered Record Revenue in Q3 of $81 Million, Up +33% YoY
Increased RPOs +361% YoY to $672 Million; Backlog +216% YoY to $734 Million
Generated $114 Million of Year-to-Date Net Cash Provided by Operating Activities
End of Period Cash, Cash Equivalents, and Short-Term Investments Increased 180% YoY to $677 Million
Successfully Launched 2 High Resolution Pelican Satellites & 36 SuperDove Satellites
About PL
Planet Labs PBC engages in the design, construction, and launch constellations of satellites with the intent of providing high cadence geospatial data delivered to customers through an online platform the United States and internationally. The company’s platform offers planet monitoring, tasking, archive, apps, application programming interfaces (APIs), basemaps, and fusion, as well as analytic feeds and planetary variables.

ARM Holdings : First Long AttemptWhen I asked ChatGPT what Arm does for someone who is not in the chip industry or an electronics engineer, chatgpt gave a very nice answer:
"“A linguist who designed the world’s operating language.”
We're very close to the earnings date. (5 november 2025)
A target price between 200 and 230 is reasonable, but a sharp rise or fall is possible on earnings day.
Whether 230 should be maintained initially or whether a downgrade to the 200 target price will be determined then.
Arm Holdings has subsidiaries in China, making it a giant affected by the US-China trade war.
Reasonable position sizing should be made with this in mind.
We're above the 200 moving average on the 4-hour chart.
ATR % shows that relatively decreasing volatility can experience sharp increases in a short time.
(Not price , volatility )
First, let's try a target of 230 based on a Risk/Reward ratio of 3.
Parameters:
Stop-Loss : 137.5 ( or close under 137.5 )
Risk/Reward Ratio : 3.00
Take-Profit Level : 230.00
As I mentioned above, earnings or other developments can trigger a rapid stop-loss. Therefore, a small position is ideal for this trade.
Regards.

HD Alert: Insiders Bet Big on Downside Ahead of EarningsTicker: HD
Date: 2025-11-17
Signal: BUY PUTS (Speculative)
Confidence: 58%
Strike: $330
Entry Range: $0.85
Target 1: $1.60 | Target 2: $2.40
Stop Loss: $0.40
Expiry: 2025-11-21
Position Size: 2% of portfolio (low conviction)
Technical Snapshot:
Price down -2.61%, RSI oversold at 24.8
Bearish EMA alignment, MACD -6.14
Volume 2.1x average → institutional activity
Support: $358.44 | Resistance: $368.50
Options Flow:
Put/Call Ratio 4.47 → heavy institutional bearish positioning
Max volume at $420 PUT → strong downside bets
AI / Market Vision:
Katy AI neutral (50% confidence) → minor upside to $362.38
Composite signals indicate bearish trend continues
Risk Level: HIGH ⚠️
Earnings volatility, conflicting signals
Small position size advised
Implied volatility: 58.1% → significant time decay
Edge / Rationale:
Extreme P/C ratio signals institutions favor downside
Pre-earnings drop (-2.61%) and oversold technicals favor continuation
Small size mitigates risk while targeting potential 100–200% gains

Amazon (AMZN): Ready for a New Breakout!Amazon isn’t just delivering packages — it’s delivering earnings surprises and a chart breakout too! 😎
After reporting strong Q3 earnings on 30 Oct 2025 , AMZN’s chart popped with a clean cup & handle breakout on 31 Oct 2025 — just in time for a bullish Halloween rally 🎃🐂
💰 Earnings Highlights :
Revenue : Came in above expectations, boosted by AWS and advertising growth.
EPS : Beat market estimates, showing stronger profitability.
Operating cash flow : Improved significantly — partly thanks to deferred tax effects — giving Amazon more room for CapEx and expansion.
☁️ AWS Power :
AWS continues to lead the way with steady growth and improved margins. Analysts expect momentum to carry into Q4 2025 , supported by rising demand for cloud and AI-driven services.
📊 Technical View :
The chart shows a classic cup & handle breakout — volume confirmation looks solid, suggesting potential continuation into year-end.
🔥 My Take:
When strong fundamentals meet a clean technical setup, that’s where the magic happens. Amazon might just be brewing a latte-fueled rally into Q4 ☕🚀

Meta vs Microsoft – AI Euphoria or ExhaustionThe AI boom that lifted Big Tech to record highs may be entering its most delicate phase yet. Meta and Microsoft, two of the biggest winners of the AI wave, are now testing investors’ patience with a spending spree that’s starting to look excessive even by Silicon Valley standards.
In the last quarter alone, Meta, Microsoft, and Alphabet poured a combined $78 billion into data centers, GPUs, and AI infrastructure — an 89% increase year-over-year. The market’s reaction was telling: Meta and Microsoft both slipped after earnings, as traders began to question whether the growth in AI revenue can keep pace with the ballooning costs.
Microsoft’s $34.9 billion in capex didn’t deliver a higher growth rate for Azure, and Meta warned that next year’s spending will accelerate “significantly.” Google, by contrast, managed to calm investors with solid cloud growth and a more balanced tone — but even it now projects capex as high as $93 billion for 2025.
The common thread is clear: all three are betting the next decade on AI, but the near-term return on that investment remains murky. For Microsoft, capacity constraints still limit revenue growth. For Meta, the challenge is sharper — it’s spending on infrastructure without a clear monetization path, relying mostly on advertising optimization and early-stage hardware bets.
From a market perspective, both charts show fatigue setting in. After a year of relentless gains, momentum is flattening and volatility is creeping back in. The market still believes in AI — but it’s starting to question how much belief is already priced in.
If earnings growth doesn’t catch up with capex soon, these charts could be signaling the first cracks in the AI narrative. Whether this is just a pause or the beginning of a revaluation cycle will depend on how quickly these investments translate into tangible profit, not just GPU headlines.
Idea Summary:
NASDAQ:META and NASDAQ:MSFT are spending at record levels to stay ahead in AI, but returns are slowing. The charts hint at exhaustion — investors may be entering the first real “AI reality check.

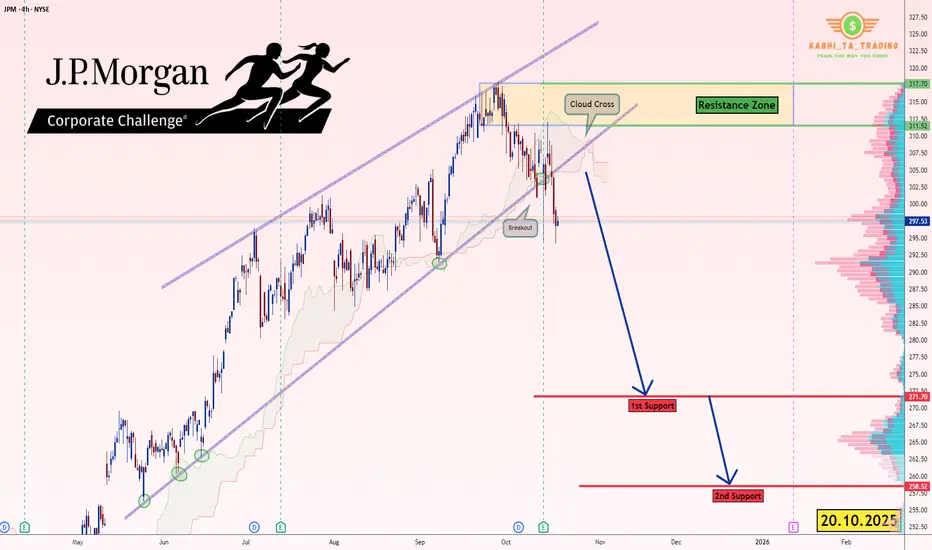
JP Morgan (JPM) - H4 - Breakout Pattern (20.10.2025)📊 Setup Overview:
J.P. Morgan ( NYSE:JPM ), presenting a bearish outlook based on the price action.
📈 Trade Plan:
Bias: Bearish below $310
1st Target: $272 ✅
2nd Target: $258.52 🎯
Resistance Zone: $311 – $318
🧩 Technical Confluence:
1.Price Breaks the Wedge Pattern.
2.Trendline break confirming reversal
3.Ichimoku Cloud crossover indicating bearish momentum
🏦 Key Fundamentals & Recent Performance
1.JPM reported third-quarter 2025 adjusted revenue of ~$47.12 billion, topping estimates.
2.Net interest income (NII) rose only ~2% YoY in Q3 to $24.1 billion, and the bank raised its 2025 NII outlook to ~$95.8 billion.
3.JPM itself flags major risks: ongoing geopolitical uncertainty, elevated asset valuations, potential credit stress and slower growth.
#JPM #JPMStock #NASDAQ #USStocks #TechnicalAnalysis #wedgePattern #BearishSetup #PriceAction #EarningsWatch #StockMarket #SwingTrading #TradingView #Ichimoku #CloudCrossover #ChartsDontLie #Kabhi_TA_Trading
⚠️ Disclaimer:
This analysis is for educational purposes only and not investment advice. Always perform your own due diligence and manage risk appropriately before taking any position.
💬 Support the Analysis:
If this chart helped you — LIKE 👍, COMMENT 💬 your thoughts, and FOLLOW ✅ for more daily stock & forex chart breakdowns from Kabhi_TA_Trading!
AMAZON (AMZN) - H4 - Double Top Breakdown (19.10.2025)📊 Setup Overview:
Amazon stock (NASDAQ: AMZN) is forming a Double Top Reversal Pattern on the 4H chart, signaling potential weakness after failing twice to break above the major resistance zone near $238–$240.The price has also broken below the ascending trendline with a cloud crossover, confirming bearish momentum building up. NASDAQ:AMZN
📈 Trade Plan:
Bias: Bearish below $220
1st Target: $197.91 ✅
2nd Target: $183.99 🎯
Resistance Zone: $238 – $240
🧩 Technical Confluence:
1.Double Top formation near major resistance zone
2.Trendline break confirming reversal
3.Ichimoku Cloud crossover indicating bearish momentum
4.Volume profile shows selling pressure increasing below $215
📉 Fundamental Amazon (AMZN):
Amazon remains one of the most dominant global tech giants, but several near-term factors could impact its price action:
⚡Upcoming Earnings (Late October 2025):
1.Analysts project Q3 FY2025 revenue around $158–160 billion, with EPS expectations near $1.24–$1.30.
2.Focus will be on AWS (Amazon Web Services) performance — which still contributes over 50% of total operating income, but has shown slower growth due to corporate cost-cutting and cloud competition.
⚡Retail & E-commerce Trends:
1.Amazon’s North America segment remains strong but margin pressure continues due to logistics and rising fulfillment costs.
2.The company’s push into AI-driven retail advertising could offset some of that weakness if ad revenue exceeds expectations.
⚡Broader Market Context:
1.With U.S. yields staying elevated, large-cap tech stocks like Amazon may face valuation compression.
2.Institutional rotation toward value and defensive stocks could further weigh on AMZN in the short term.
🎯Overall, fundamentals remain strong for the long-term, but the technical structure suggests a near-term correction before accumulation resumes.
#AMZN #AmazonStock #NASDAQ #USStocks #TechnicalAnalysis #DoubleTopPattern #BearishSetup #PriceAction #EarningsWatch #StockMarket #SwingTrading #TradingView #Ichimoku #CloudCrossover #ChartsDontLie #Kabhi_TA_Trading
⚠️ Disclaimer:
This analysis is for educational purposes only and not investment advice. Always perform your own due diligence and manage risk appropriately before taking any position.
💬 Support the Analysis:
If this chart helped you — LIKE 👍, COMMENT 💬 your thoughts, and FOLLOW ✅ for more daily stock & forex chart breakdowns from Kabhi_TA_Trading!

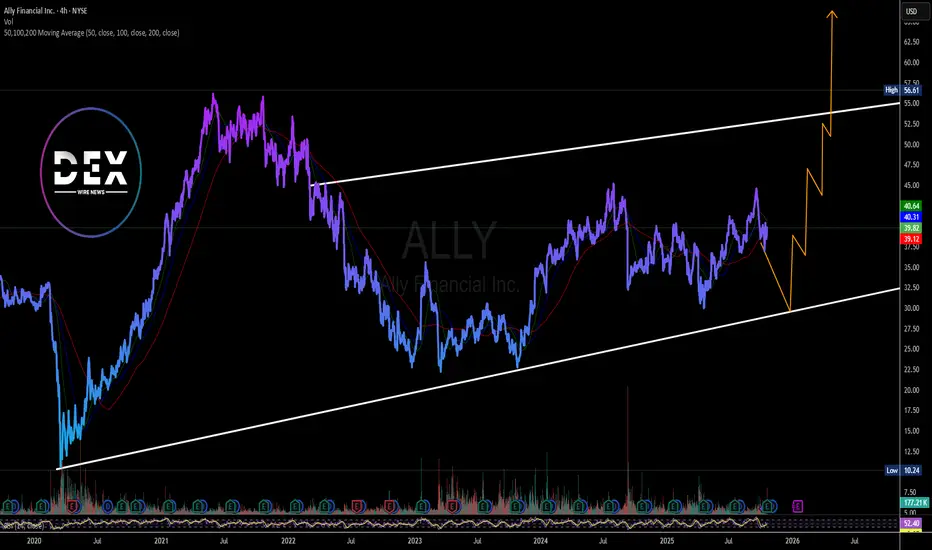
Just In: Ally Financial ($ALLY) Is Set to Breakout of A Wedge Ally Financial (NYSE: NYSE:ALLY ) is gearing up for a 35% surge that will break the ceiling of a falling wedge formed since April, 2025 amidst bullish sentiments.
The asset is trading in tandem to the moving averages with the RSI at 52, we might experience consolidation to the base of the wedge at $30 zone before picking liquidity up to the upside.
In another news, Ally Financial reports third quarter 2025 financial results.
Net income attributable to common shareholders was $371 million in the quarter, compared to $171 million in the third quarter of 2024. Net financing revenue was $1.6 billion, up $64 million year over year. Net interest margin (“NIM”) of 3.51% and net interest margin excluding core OIDA of 3.55% were up 22 and 23 bps year over year, respectively.
Other revenue decreased $31 million year over year to $584 million including a $27 million increase in fair value of equity
securities in the quarter compared to a $59 million increase in the third quarter of 2024.
Noninterest expense increased $15 million year over year.
View full press release in PDF: mma.prnewswire.com
BILI Earnings Trade Setup (High Conviction Call Play)
🚀 **BILI Earnings Trade Setup (High Conviction Call Play)** 🚀
📊 **Earnings Date:** Aug 25, 2025 (BMO)
🎯 **Expected Move:** +5–7%
💡 **Conviction:** 75% Bullish
---
🔥 **TRADE DETAILS** 🔥
* 📌 **Ticker:** \ NASDAQ:BILI
* 📈 **Direction:** CALL (LONG)
* 🎯 **Strike:** \$26.00
* 💵 **Entry Price:** \$0.87
* 🎯 **Profit Target:** \$2.61 (200%)
* 🛑 **Stop Loss:** \$0.44 (50% of premium)
* 📅 **Expiry:** 2025-08-22
* 📏 **Size:** 2 contracts
* ⏰ **Entry Timing:** Pre-Earnings Close
---
✅ **Why Bullish?**
* 📈 **Revenue Growth:** +23.6% YoY momentum 🚀
* 💰 **Margins:** Operating margin flipped positive (0.2%) 💡
* 📊 **Analysts:** 75% EPS beat probability + Strong Buy consensus
* 💎 **Options Flow:** Bullish skew → call volume stacking at \$26.00 strike
* 🔥 **Technical Setup:** Above key MAs, RSI = 65.3 (strong momentum)
---
⚠️ **Risk Management Plan** ⚠️
* 🎯 Take profits @ \$2.61 if stock hits \~\$28.68
* 🛑 Cut @ \$0.44 if trade goes against
* ⏰ Exit within 2 hours post-earnings if neither target nor stop is hit (avoid IV crush!)
---
📌 **Hashtags / Tags for Reach:**
\#BILI #OptionsTrading #EarningsPlay #CallOptions #TradingSignals #BullishSetup #OptionsFlow #EarningsAnalysis #MarketStrategy #RiskManagement #TradingView #SwingTrade #StockMarket

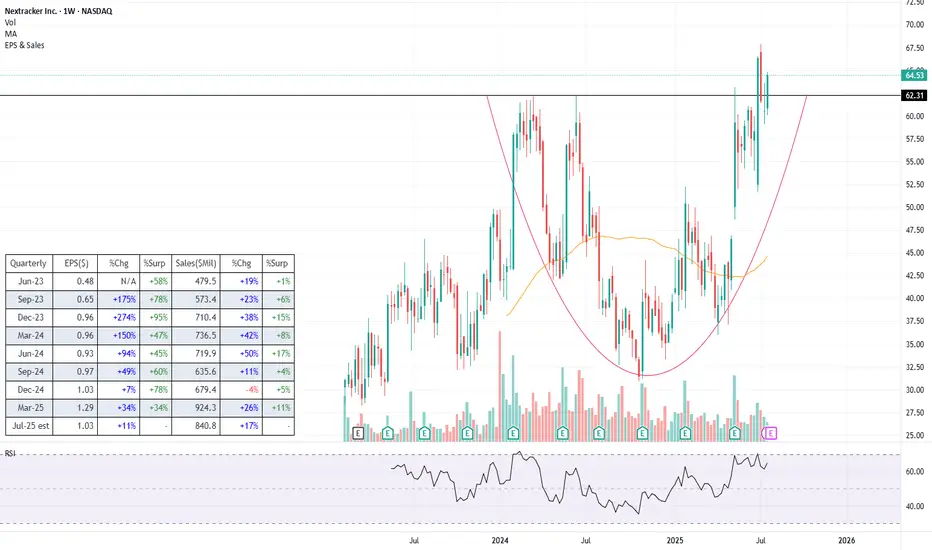
NXT (Long) - Clean energy player with even cleaner financialsLet's preamble with what the company actually does (as I imagine a lot of traders trade without even bothering... understandably). In short, Nextracker operates in the solar energy space where it is a leader in providing energy output optimization solutions, i.e. mechanical systems that rotate solar panels to follow the sun, along with software (TrueCapture) that uses sensors and machine learning to fine-tune positioning in real time.
Fundamentals
NASDAQ:NXT has been growing very strongly in recent years (see the table) despite the numerous hiccups this space has seen since 2022. There is also a backlog of $4.5bn , giving us clear visibility into the next year. Profitability is strong with earnings growth even outpacing revenue growth, showing strong operating leverage .
This all comes on the back of a relatively cheap valuation , with P/E of just below 18, which is significantly lower than some of its competitors like NYSE:NVT at 52, and NYSE:RRX at 43. No clear reason for why the markets are discounting the stock.
The balance sheet is rock solid , with no debt and $766m in cash. Moreover, free cash flow is plentiful with the firm most recently generating $622m in FCF.
Overall, the company is growing, has strong financials and is cheaply valued compared to its competitors - the kind of smoothie I usually look for. One obvious risk is policy , given that the current administration doesn't really see eye to eye with renewables and two thirds of NXT's revenue still comes from the US.
Technicals
Just breaking into an all-time high is a nice-to-have advantage when entering a new trade. The stock is breaking out from a decent, almost year-and-half long base , though I would prefer the base to be a tad more prolongated.
The stock broke the ATH on higher volume, pulled back to around the breakout point and is currently establishing the next leg higher
The price is some distance away from its moving averages, so there is a chance that there still might be some more consolidation around this level before we proceed higher
Trade
Main caveat is that the stock is about to release its earnings on Tuesday , so naturally it is a slight gamble to buy ahead of it. I decided to jump in beforehand just because I have strong conviction (and I love to punch the wall when I always get it wrong), but I would advise others to first wait on the results as a potential catalyst.
For gamblers like myself, the ATH breakout point likely serves as the best possible stoploss (black line).
One more reason why these earnings in particular could be even more of a gamble is that the BBB bill was passed since the last earnings, so if the executives decide to sprinkle the release with some not-so-positive comments regarding that, it could spook investors.
Follow me for more analysis & Feel free to ask any questions you have, I am happy to help
If you like my content, please leave a like, comment or a donation , it motivates me to keep producing ideas, thank you :)
Netflix Faces Rising Volatility and Bearish Technicals Ahead of Netflix (NASDAQ: NFLX) will announce its results after the close of trading in New York on Thursday, 17 July. Analysts forecast the NASDAQ-listed streaming media company to report second-quarter earnings growth of 45%, reaching $7.08 per share, while revenue is expected to increase by 15.6%, amounting to $11.1 billion. Net subscriber additions are predicted to decrease by 42.9%, falling to 4.6 million.
For the third quarter, analysts forecast guidance for revenue of $11.3 billion, up 14.7%, and earnings of $6.68 per share, reflecting growth of 23.6%. The options market is pricing in a 6.4% move, either up or down, in Netflix shares following the earnings report.
The significant expected move in the stock is driven by implied volatility levels for options expiring on 18 July, which were high at nearly 70% as of the 13 July close and are likely to increase further as results approach. Options positioning in Netflix also appears notably bullish, with call delta values surpassing put delta values. This indicates that once the company reports its results and options begin to decrease in value due to the decay of implied volatility, market makers might find themselves overly hedged on the long side, potentially forcing them to sell shares. This scenario could exert downward pressure on the stock if it fails to breach the $1,300 level, which acts as the gamma call wall.
Additionally, technical analysis shows a downside risk for the shares both before and after the results. The Relative Strength Index (RSI) for Netflix has been trending lower and recently dropped below 50, signalling a shift in momentum from bullish to bearish. Furthermore, the stock has broken down from a rising broadening wedge pattern, which is traditionally seen as a bearish reversal signal, indicating a possible decline back towards the pattern’s origin, around $1,100.
Written by Michael J. Kramer, founder of Mott Capital Management.
Disclaimer: CMC Markets is an execution-only service provider. The material (whether or not it states any opinions) is for general information purposes only and does not take into account your personal circumstances or objectives. Nothing in this material is (or should be considered to be) financial, investment or other advice on which reliance should be placed.
No opinion given in the material constitutes a recommendation by CMC Markets or the author that any particular investment, security, transaction, or investment strategy is suitable for any specific person. The material has not been prepared in accordance with legal requirements designed to promote the independence of investment research. Although we are not specifically prevented from dealing before providing this material, we do not seek to take advantage of the material prior to its dissemination.

$NVDA – Earnings Super Bubble?🚨 Nvidia is reporting earnings tomorrow, and the market is waiting with bated breath.
While analysts pile on with hyper-bullish predictions extrapolating the AI super bubble, they seem to ignore one glaring fact:
👉 The last time Nvidia beat earnings, the stock crashed -45% shortly after.
Technical view:
We’re near resistance at the previous post-earnings high.
RSI sits at 63.80, hinting at possible exhaustion.
Volume spikes hint at indecision, not confirmation.
This could be a make or break moment for NASDAQ:NVDA and by extension, the entire Tech sector.

Barrick Gold Corporation ($ABX): Golden Opportunity or Risky
Barrick Gold Corporation (ABX): Golden Opportunity or Risky Prospect? 🏆💰
1/10
Barrick Gold TSX:ABX has seen a solid financial performance recently. EPS for the last quarter hit C$0.42, with next quarter estimates at C$0.63. They beat estimates 75% of the time in the past year. 📈
2/10
Analysts are bullish! The average price target is C$33.57, implying a potential upside of 50.13% from the current C$22.36 price. Strong Buy ratings dominate: 10 Buy, 2 Hold. 🔍 What do analysts know that the market doesn’t?
3/10
However, ABX is facing operational challenges. A suspension in Mali due to government intervention highlights geopolitical risks in mining. 🛑 Regulatory challenges are part of the gold mining game.
4/10
Stock price check: ABX currently trades at C$23.15. That’s 20.94% below its 52-week high of C$29.28 but 21.59% above its low. What does this tell us? Room for recovery, but risks loom. 📊
5/10
Valuation time! Compared to sector peers, Barrick offers an attractive price level, especially given the 50% upside target. Analysts love undervalued plays like this, but what about the risks? 🤔
6/10
Strengths: Barrick operates across multiple countries, ensuring diversified production. That’s crucial in a volatile gold market. 🌍 Diversification is a key defensive strategy here.
7/10
Challenges: High operational costs are always a concern. Pair that with political instability, like the Mali suspension, and ABX faces a steep uphill climb. 🏔️ How much risk are you willing to take on?
8/10
Opportunities: Expansion is always on the table. With gold prices looking stable, Barrick could capitalize on new projects or mines. But timing matters in this market. ⛏️
9/10
Threats: Regulatory and political risks never sleep. Changes in mining laws or political unrest can hit Barrick hard—Mali’s situation is a prime example. Always know your risks. ⚠️
10/10
What’s your take on Barrick Gold TSX:ABX ? Will it strike gold again? Vote here! 🗳️
Buy for the long term 📈
Hold and watch growth 🔄
Too risky, avoid 🚫

AMD Earnings About To PrintTechnical Analysis NASDAQ:AMD
RSI: 🟡 Near overbought but showing strength
MACD: 🟢 Bullish crossover in progress
Support: $96.84 → $93.64 → $90.00
Resistance: $100.75 → $101.72 → $103.96
Key Level to Watch: $100.75 (immediate resistance)
💰 Earnings Play
🎯 Trade Signal: BUY
✅ Justification
Recent uptrend confirmed by bullish MACD crossover with price action above key short-term MAs. Strong momentum heading into earnings with positive sentiment from analysts.
⚠️ Risk Management
Stop Loss: $93.64 (-5.2%)
Expected Range: $93.64 to $103.96
Best AI Generated Signals.
Stay Alpha

ES Futures: Upcoming Mag 7 Earnings and NFP Report
This week, although there was not much market-moving macro newsflow over the weekend, we are approaching month-end. In addition, several key catalysts are on the horizon, including earnings from the Magnificent 7 and the release of Non-Farm Payrolls (NFP) data, which typically arrives on the first Friday of the month.
The Federal Reserve is currently in its blackout period ahead of the interest rate decision scheduled for May 7th, 2025.
As part of our process, we will be reviewing technical levels and drawing a plan based on current market structure. ES futures are currently trading above the March 2025 lows. A “death cross” — where the 50-day moving average crosses below the 200-day moving average on the daily timeframe — was recently observed. This pattern is commonly touted by analysts as a bear market indicator.
However, in a macro-driven environment, this could potentially be a false signal.
Key Levels:
• mCVAL: 5622
• Upper Neutral Zone: 5620 -5585
• March 2025 Low: 5533.75
• 2022 CVAH: 5384.75
• Lower Neutral Zone: 5171.75 -5150.75
Our scenarios are as follows:
Scenario 1: Range-bound price action
A P-shaped micro composite profile suggests resistance at our neutral zone. It is labeled neutral because the price is trading above the March 2025 lows. However, if the level above acts as resistance, we expect further range-bound price action. Markets may trade below the mCVAL for further price discovery and potentially establish a new short-term range, with the 2024 lows acting as downside support.
Scenario 2: Mag 7 and NFP as bullish catalysts
Four of the Magnificent 7 companies are reporting earnings this week. The Mag 7 collectively represent around one-third of the S&P 500 index by market capitalization. Microsoft and Meta are scheduled to report on Wednesday after the close, while Amazon and Apple report on Thursday after the close.
On Friday, the NFP data will be released. This could serve as a fundamentally net-positive catalyst for U.S. markets, especially in light of recent shocks that have weakened sentiment.
In this scenario, we will be closely watching our neutral zone and mCVAL as potential areas to initiate long trades.
Glossary Index for all technical terms used:
Blue Zones: Neutral zones.
C: Composite (prefix before VAL, VAH, VPOC, VP, AVP)
mC: micro-Composite (prefix before VAL, VAH, VPOC, VP, AVP)
VAL: Value Area Low
VAH: Value Area High
VP: Volume Profile
CME_MINI:ES1!

A Long-term Bullish Trend ?With an upcoming Earnings report we can observe rather uncertain future behavior.
But since the trend has been bearish for a longer period of time and the price is "nearly" at the same position which was achieved for the first time in early April in 2019, we can, mostly based only on the technical analysis and Earnings report, determine quite confidently that the price is ready to rise.
Important data:
EPS Estimate: -$3.12
Revenue Estimate: $106 million to $166.7 million
Notable developments:
Cost-cutting initiative = Targeting $1.1B in reductions by 2027
By the end of 2024 $9.5 billion allocated in investments

BOEING EARNINGS ABOUT TO PRINT Fundamental Outlook NYSE:BA
Boeing is heading into its Q1 2025 earnings with notable challenges. Ongoing quality-control issues, supply chain disruptions, and a reported negative profit margin are creating headwinds. Additionally, recent negative publicity surrounding production delays and regulatory scrutiny may further dampen investor sentiment. While potential defense contract wins or positive updates on 737 MAX production could provide a lift, the risk of a disappointing earnings report remains high, especially in a volatile aerospace sector.
Technical Analysis (Using Bollinger Bands Strategy)
On the 4-hour chart, Boeing’s stock price is currently trading at $175.46, as seen in the provided chart. Applying Bollinger Bands, the price has recently broken below the lower band, signaling a potential oversold condition but also confirming a strong bearish momentum. The price has been trending below the 20-period moving average within the bands, with the bands widening—a sign of increased volatility. This setup suggests a continuation of the downward move, especially with the recent sharp decline highlighted by the red arrow in the chart.
Target
Wait for bearish confirmation
Entry SHORT: Around $165.50, Targeting $152.00.
Secondary Target: $146.00.
Resistance Levels: $180.00, $185.00, $188.60.
Support Levels: $165.00, $155.00, $148.00.
The price is struggling to reclaim the 20-period moving average, and with earnings approaching, a breakdown below $170.00 could accelerate the decline toward $165.00 or lower. However, a positive earnings surprise—such as strong delivery numbers or improved guidance—could push the price back toward the upper Bollinger Band near $185.00.
QuantSignals.
Best AI news analysis and signals

Comerica (NYSE: CMA) Reports First Quarter 2025 Earnings ResultsComerica Incorporated (NYSE: NYSE:CMA ), together with its subsidiaries, a company that provides financial services in the United States, Canada, and Mexico reported her first quarter 2025 earnings results today before the bell.
The results are available on the Investor Relations section of Comerica's website: c212.net
Technical Outlook
Prior the earnings, shares of Comerica Incorporated (NYSE: NYSE:CMA ) are up 1.28% in Monday's premarket session. The asset is trading in tandem with the support point of $52, a break above the 38.2% Fib level could set the pace for a bullish reversal albeit the stock was already consolidating as hinted by the RSI at 46.
Financial Performance
In 2024, Comerica's revenue was $3.20 billion, a decrease of -8.79% compared to the previous year's $3.50 billion. Earnings were $671.00 million, a decrease of -21.43%.
Analyst Forecast
According to 21 analysts, the average rating for CMA stock is "Hold." The 12-month stock price forecast is $67.43, which is an increase of 27.35% from the latest price.

DoorDash (NASDAQ: $DASH) Gains Strength Ahead of May EarningsDoorDash, Inc. (NASDAQ: NASDAQ:DASH ) is showing strong momentum in a volatile market. As of April 11, DASH closed at $180.49, up 1.10% for the day. The stock has risen about 9% year-to-date, while the overall Computer and Technology sector has dropped around 11.8%. This places DoorDash ahead of many of its peers.
DoorDash belongs to the Computer and Technology group, which ranks #6 out of 16 sectors based on the Zacks Sector Rank. The company currently holds a Zacks Rank of #2 (Buy), signaling positive analyst sentiment. Over the last three months, analysts have revised DoorDash's full-year earnings estimate up by 14.7%. This indicates growing confidence in the company’s future performance.
Investors are now watching closely as DoorDash prepares to release its earnings report on May 7, 2025. The stock's upward trend and revised estimates may influence how it reacts to the upcoming results.
Technical Analysis
The daily chart shows that DASH recently bounced off a strong support zone around $162. This zone has acted as a demand area before, pushing the price higher in past sessions. Currently, DASH is approaching key resistance level at $200. A break above these could lead the stock toward the recent high at $215.25. The chart also suggests a possible retracement before a new leg up, reflecting a bullish continuation structure.
Volume increased during the bounce, indicating strong buying interest. RSI is at 48.16, which suggests neutral momentum with room for further upside. DoorDash remains one to watch heading into earnings season.

PVH Corp to Announce Q1 2025 Earnings After Market ClosePVH Corp. (NYSE: NYSE:PVH ) reported its fourth-quarter and full-year 2024 results on March 31, 2025. The company exceeded revenue expectations and outlined a stable 2025 outlook.
Fourth-quarter 2024 revenue fell 5% year-over-year to $2.372 billion. This included a 3% decline from the 53rd week in 2023. The company had guided for a 6% to 7% drop. On a constant currency basis, revenue declined 2%, beating expectations of a 4% to 5% fall.
Full-year 2024 revenue dropped 6% to $8.653 billion, slightly better than guidance. Constant currency revenue fell 5%.
PVH posted a GAAP operating margin of 8.9%, just under its 9.2% guidance. A pre-tax actuarial loss of $28 million on retirement plans affected results. On a non-GAAP basis, the operating margin was 10%, in line with expectations.
GAAP earnings per share were $2.83 for Q4, matching the lower end of guidance. Full-year GAAP EPS reached $10.56. Non-GAAP EPS came in higher at $3.27 for Q4, beating the forecast of $3.05 to $3.20. Full-year non-GAAP EPS totaled $11.74, above the $11.55 to $11.70 range.
In 2025, PVH expects flat or slightly higher revenue growth compared to 2024. The company forecasts a non-GAAP operating margin near or slightly above 10%. EPS is projected between $12.40 and $12.75, with a $0.20 negative impact from foreign currency translation.
In other news, the company repurchased $500 million of its stock in 2024. PVH plans another $500 million in share buybacks through accelerated share repurchase agreements in 2025.
Technical Analysis: Price At Key Support
As of writing, NYSE:PVH stock is trading at 65.54, -2.18 (-3.22%), and testing a key support zone. This zone combines horizontal support with an ascending trendline. A breakdown below this level could trigger further declines, with the next major support lying near $44, the previous low.
Upside Potential Hinges on Earnings Strength
If support at $64 holds, PVH could rally toward the $90 resistance zone and immediate target.
The future movement will likely depend on Q1 2025 earnings. A strong report may fuel a short-term rebound. A weak result on the other hand, could drive the price below the current support.

Guess?, Inc. Reports Fiscal Year 2025 Fourth Quarter ResultsGuess?, Inc. (NYSE: NYSE:GES ) a company that designs, markets, distributes, and licenses lifestyle collections of apparel and accessories for men, women, and children- operating through five segments: Americas Retail, Americas Wholesale, Europe, Asia, and Licensing, reports fiscal year 2025 fourth quarter results.
Reports Highlights
Fourth Quarter Fiscal 2025 Results:
Revenues Increased to $932 Million, Up 5% in U.S. Dollars and 9% in Constant Currency
Delivered Operating Margin of 11.1%; Adjusted Operating Margin of 11.4%
GAAP EPS of $1.16 and Adjusted EPS of $1.48.
Full Fiscal Year 2025 Results:
Revenues Increased to $3.0 Billion, Up 8% in U.S. Dollars and 10% in Constant Currency
Delivered Operating Margin of 5.8%; Adjusted Operating Margin of 6.0%
GAAP EPS of $0.77 and Adjusted EPS of $1.96
Full Fiscal Year 2026 Outlook:
Expects Revenue Increase between 3.9% and 6.2% in U.S. Dollars
Expects GAAP and Adjusted Operating Margins between 4.3% and 5.2% and 4.5% and 5.4%, Respectively
Expects GAAP EPS between $1.03 and $1.37 and Adjusted EPS between $1.32 and $1.76
Plans to Execute Business and Portfolio Optimization Expected to Unlock Approximately $30 Million in Operating Profit in Fiscal Year 2027
Financial Performance
In 2024, Guess?'s revenue was $3.00 billion, an increase of 7.88% compared to the previous year's $2.78 billion. Earnings were $60.42 million, a decrease of -69.15%.
Analyst Forecast
According to 5 analysts, the average rating for GES stock is "Strong Buy." The 12-month stock price forecast is $21.6, which is an increase of 115.14% from the latest price.
As of the time of writing, NYSE:GES shares closed Thursday's session down 11.78% extending the loss to Friday's premarket trading down by 2.38%. With a weaker RSI of 38, should trades open, NYSE:GES shares might break the 1-month low pivot and dip to the $7 support point. About $2.85 trillion was wiped out from the US stock market yesterday.

Breaking: nCino, Inc. (NASDAQ: $NCNO) Tanks 33% In Premarket nCino, Inc., (NASDAQ: NASDAQ:NCNO ) a software-as-a-service company, that provides cloud-based software applications to financial institutions in the United States and internationally saw its shares plummet 32.93% in Wednesday's Premarket trading amid slowing growth in cloud banking and mortgage markets.
nCino shares slumped in after hours trading Tuesday (April 1) extending the loss to Wednesday's (April 2) premarket trading in the wake of guidance that anticipates slowing growth in the core cloud banking segments and mortgage markets, though a reacceleration is envisioned for fiscal year 2027.
in the current fiscal year (2026) first quarter, top-line growth should be in the high single-digits year over year, to a range of roughly $139 million to $140.7 million, which would be a slowdown from the 14% growth rate notched in the most recent quarter. Fiscal year guidance also disappointed investors, who sent the shares down by 28%.
The company also announced the appointment of Sean Desmond as CEO, succeeding Pierre Naudé, who becomes executive chairman.
Financial Performance
In 2024, nCino's revenue was $540.66 million, an increase of 13.45% compared to the previous year's $476.54 million. Losses were -$37.88 million, -10.55% less than in 2023.
Analyst Forecast
According to 13 analysts, the average rating for NCNO stock is "Buy." The 12-month stock price forecast is $40.38, which is an increase of 43.60% from the latest price.
Technical Outlook
As of the time of writing, NASDAQ:NCNO is down 32.93% in Wednesday's premarket trading. the asset's daily price chart depicts a bearish pennant or a bearish symmetrical triangle that resorted to the 33% dip. NASDAQ:NCNO shares close Tuesday's session with a RSI of 39.77 which is weaker for a trend reversal and also potent for a continuous trend.
There is a possible chance of a gap down pattern evolving which is a very strong bearish pattern. For now investors will have to wait for a favourable grounds mostly likely the 25 RSI pivot to capitalize on the dip.
