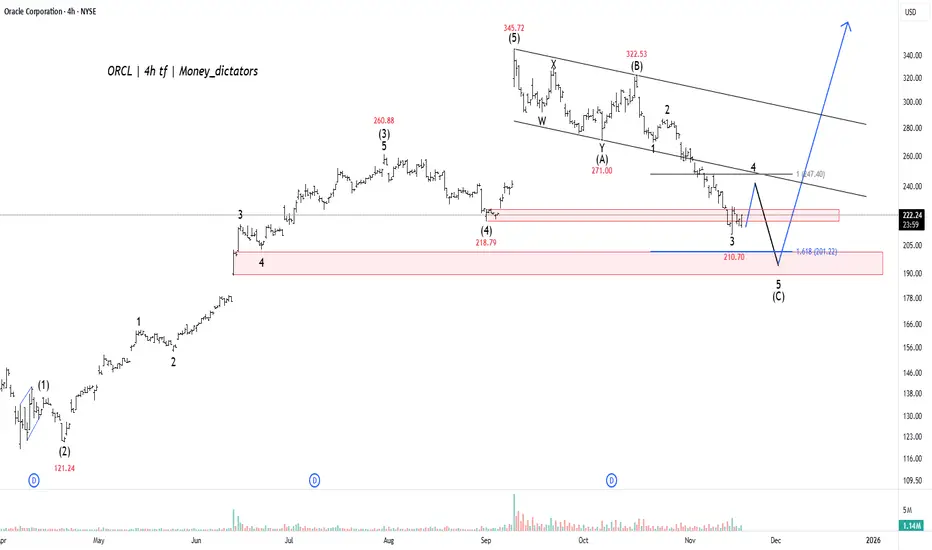
ORCL - Launchpad to New HighsWave Projection of Oracle (ORCL) suggests the stock is currently in the final stages of a major correction, specifically concluding the last downward leg, wave (C), of a larger pullback. The chart indicates that after a temporary bounce, the price is expected to make one final, sharp drop to complete this corrective phase. This action is essential for the market to "reset" before the next significant rally.
The critical support area for the end of this correction is identified in a tight range between $207.72 (the $1.618$ Fibonacci extension) and the immediate low of $210.70 . This zone offers strong confluence with previous structural support, making it the highest probability area for the market to find a decisive bottom. The analysis projects that the current selling pressure will exhaust itself within this $207-$211 range.
Once the price successfully reaches and holds this projected support zone, the analysis anticipates the launch of a major, long-term bullish impulse wave, likely the start of the final wave (5) of a large-scale uptrend. This new wave is expected to drive the stock significantly higher, with a target to surpass the previous all-time high of $345.77 . This pattern suggests that the current decline should be viewed as a final buying opportunity before a powerful upward trend begins.
Elliottwaveforecasts
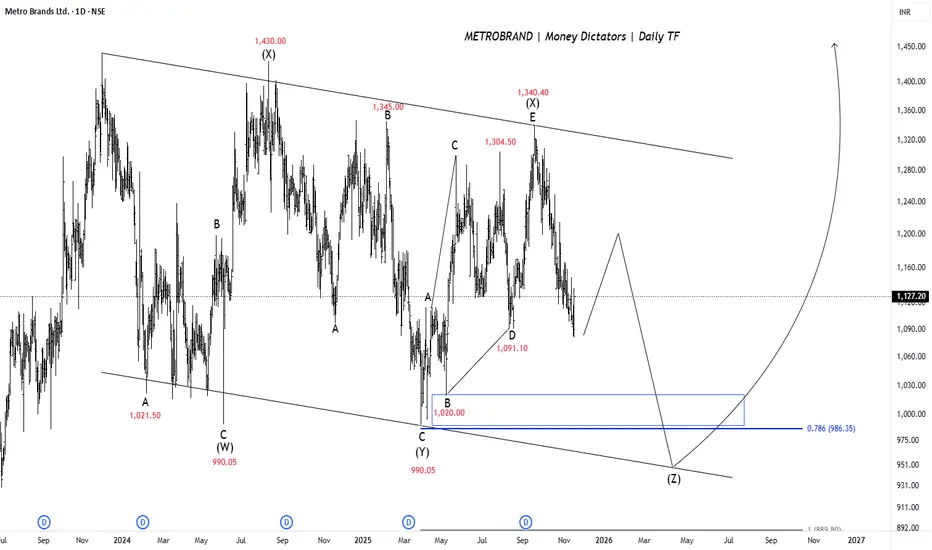
METROBRAND - An Important Case of Final Correction & ImpulseMetrobrand has been trading inside a broad downward-sloping channel for a long time, repeatedly getting rejected from the upper trendline. Each corrective structure appears as part of a complex W-X-Y-X-Z pattern, and currently, the price seems to be completing the final leg (Z). The earlier lows around 990 were tested twice, showing strong support, and now price is recovering from that zone. The recent rise indicates that sellers are losing strength and buyers are slowly stepping in again.
The ideal accumulation range lies between 1,020 and 986 (0.786 retracement), and as long as the stock holds above this zone, the downside risk remains limited. A minor dip or consolidation is still possible in the coming weeks before a stronger uptrend kicks in. Once the price stabilizes and confirms reversal with higher highs and higher lows, we may see momentum building toward the upper resistance.
If the stock sustains above 1,125 and later breaks out of the channel resistance, it has the potential to travel toward 1,245 initially. A successful breakout with volume can trigger a major upside move, extending toward 1,460 or even higher levels. Overall, the risk–reward now tilts in favor of long-term buyers, provided the stock respects the lower support zone near 986.
Stay Tuned!
@Money_Dictators
Daily Outlook on GSVR Guanajuato Silver CompanyThis is my updated daily outlook on TSXV:GSVR . The last outlook has played out pretty well so far (see linked publications), will the next leg?
We are at the point in the chart were yellow wave (3) could be underway, if so we should see a strong move higher with GSVR potentially moving 150+ %.
More comments on the chart.

USDJPY | Prices Starting to Exhaust and Potential to DeclineMarket Structure Overview
The current price is around 154.58 – 154.60. Overall, USDJPY has remained in a major uptrend (bullish) since early October 2025.
However, the current price pattern is showing signs of trend exhaustion in the upper area of the channel—approaching the supply zone of 155.00 – 155.50.
The RSI is starting to decline from the overbought area, while the momentum histogram also shows weak divergence (weakening upward momentum).
✅ Elliott Wave Structure (H4)
From the swing structure visible on the chart, the Elliott Wave pattern can be identified as follows:
✅ Elliott Wave Count:
- Wave (1): Initial rise from 149.00 → 151.50
- Wave (2): Correction to 150.40
- Wave (3): Strong impulse up to 154.00
- Wave (4): Mild correction to 152.00 – 152.20
- Wave (5): Final rally towards the 155.00 area (currently forming)
This means the price is at the end of the impulse phase (Wave 5) — which is usually followed by a major correction (ABC Correction).
✅ Technical Patterns and Confirmation
Technical Patterns Formed:
- A rising wedge pattern (a tapering upward pattern) is clearly visible at the end of the trend.
- A wedge like this often signals a distribution or reversal pattern at the end of an impulse wave (wave 5).
- The upper area of the wedge and the supply zone of 155.00 – 155.50 have the potential to become a strong reversal zone.
📊 Confirmation Indicators:
- RSI: forming a bearish divergence — higher price high, lower RSI high.
- Momentum Histogram: starting to shrink, indicating weakening bullish momentum.
- This supports the possibility that Wave 5 is nearing completion.
✅ Projected Movement Direction
📉 Main Scenario (Reversal / Downward Correction)
After Wave 5 completes around 155.00 – 155.50, the price has the potential to reverse downwards, forming a large ABC correction (the beginning of Wave A).
Initial correction targets:
- Target 1: 154.00 (minor support & lower wedge)
- Target 2: 153.00
- Target 3 (extension): 151.50 – 152.00
If the price breaks through wedge support (BOS downwards), it confirms the Wave A correction has begun.
📈 Alternative Scenario (Continued Breakout)
If the price breaks strongly above 155.50 with high volume, it indicates the Wave 5 extension is continuing.
Continued targets: 156.00 – 156.50, before a major correction begins.
However, this opportunity is smaller, due to numerous signs of exhaustion in the upper area.
--------------------------------------------------------------------------------------------------------
✅Short-Term Position (Potential Reversal)
- Sell Entry: 155.00 – 155.40 (supply zone & upper wedge area)
- Stop Loss: 155.80 (above wedge + structure invalidation)
- Take Profit 1: 154.00
- Take Profit 2: 153.00
🎯 RR ratio around 1:3
Entry confirmation: emergence of a bearish engulfing/minor downward BOS on H1–H4.
-------------------------------------------------------------------------------------------------------
✅Long-Term Position (Buy the Dip)
If the Wave A–B–C correction completes below (around 151.50 – 152.00), then a new potential Wave (1) of the major uptrend (the next cycle) could begin.
- Buy Entry: 151.50 – 152.00 (strong demand zone)
- Stop Loss: 150.40
- Take Profit: 155.00 – 156.00
🎯 RR around 1:4 – long-term accumulation position

Silver (XAGUSD) 4H – Potential Ending Diagonal in C of (B)Price action in the 4H chart for Silver suggests we’re nearing the completion of a possible zigzag, with wave C possibly building out a clear ending diagonal (wedge) in the final leg of (B). This aligns with classic Elliott Wave behaviour, where a wedge pattern often signals the conclusion of a strong corrective rally before a significant reversal or new trend begins.
The current rally is testing both the upper parallel and key Fibonacci zones (0.618/0.764).
Watch for breakdown triggers below wedge support, which would confirm the reversal and set up a new bearish sequence.
If price keeps grinding higher within the wedge, further subdivisions may occur before wave C/B finally tops.
What’s your view on this structure? Do you expect a deeper reversal or more upside first? Share your ideas below!

DXY (Dollar Index) Daily Outlook (Count 3)This is a daily timeframe outlook of the TVC:DXY . This is in alignment with my previously posted weekly outlook and is a slight alteration of the last posted Daily outlook, both shown in the related publications area.
In this update I am looking for the DXY to continue lower potentially in an ending diagonal pattern towards the red and yellow target zones at around 93.8. As mentioned on the chart, if we see price decline in a traditional impulse with no overlap between wave 4 and 1 then the measured move target will be surpassed.
I have a short trade shown on the DXY chart but this is only indicative of the move I expect, I am instead long FX:EURUSD which moves inversely to the DXY. More comments on the chart.

XAG/USD Set for Decline After Finishing Wave YSilver has completed a clear 5-wave upward move, ending near the 51.23 zone, which likely marks the completion of Wave C of the corrective structure. Price action shows rejection from the upper trendline, signaling that buying momentum is fading. This suggests the start of a new A–B–C corrective decline, where Silver could first drop toward 48–47 levels before any temporary bounce. The overall structure remains bearish in the short term unless the price breaks above the 52.76 invalidation zone. In simple terms: rally looks complete → downside correction likely ahead.
Stay tuned!
@Money_Dictators
Thank you :)

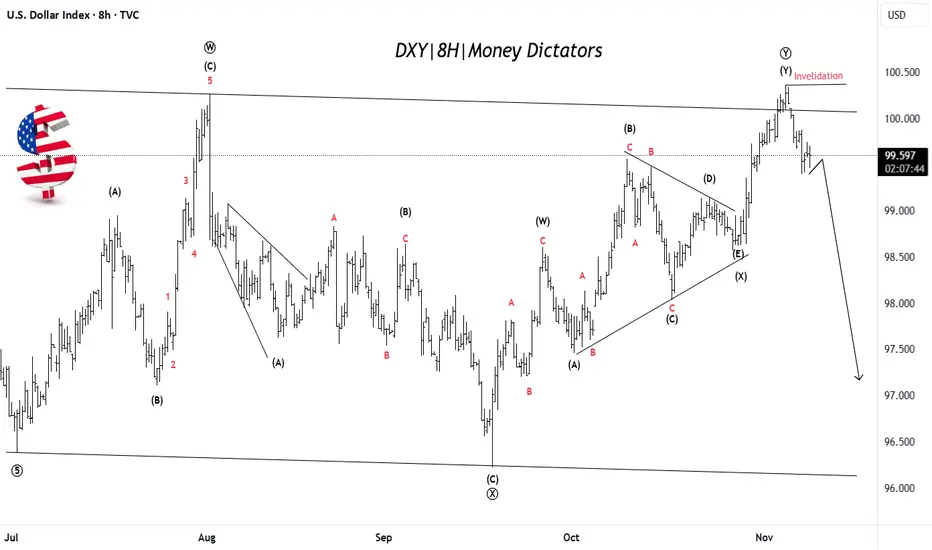
US Dollar Weakness Likely After Final Push UpDXY has completed a complex corrective W–X–Y pattern, with the final leg (Y) recently topping near the 100.50 zone. Price has failed to break above the invalidation level, suggesting the uptrend is losing strength. This signals that the dollar may have finished its corrective phase and could now start a fresh bearish wave targeting lower zones near 97–98. The overall structure indicates that momentum is shifting from bullish to bearish. In simple terms: rally is likely over → downside move toward new lows expected next.
Stay tuned!
@Money_Dictators
Thank you :)
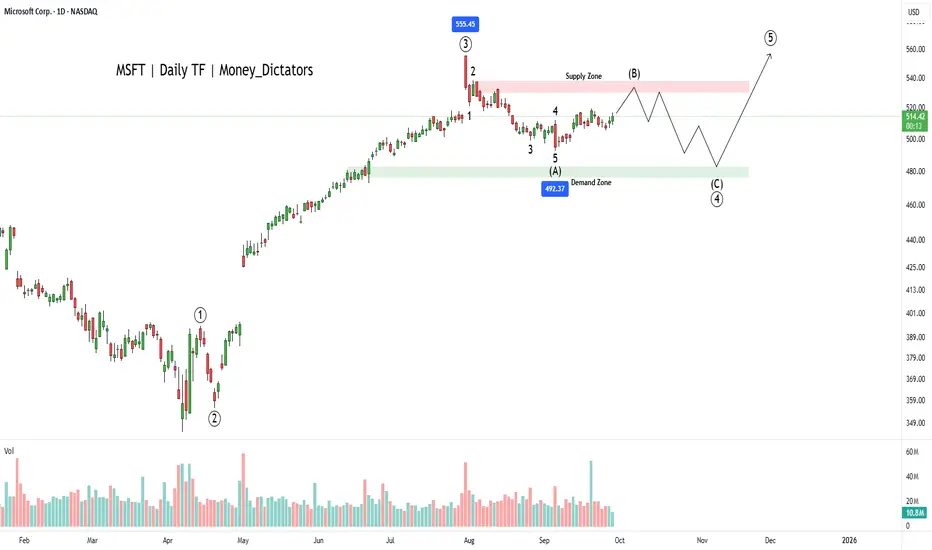
Why MSFT Could Be a Smart Pick in 2025?MSFT has bullish signals from the multiple moving averages, RSI and volume analysis. However, wave principle asks evidence from the buyers. The wave count suggests that the corrective wave (B) is ongoing, and bears will control the final wave of the primary wave 3.
Wave C will start falling nearby the supply zone and high of the 2nd wave of wave intermediate wave A. Wave C can fall up to 476 which will be the strength for wave primary wave 5. As per the chart, breakout above 540 will be a good signal for bulls to take charge back.
Zones:
Supply zone: 538 - 528
Demand zone: 482 - 476
I will update the chart and details shortly.
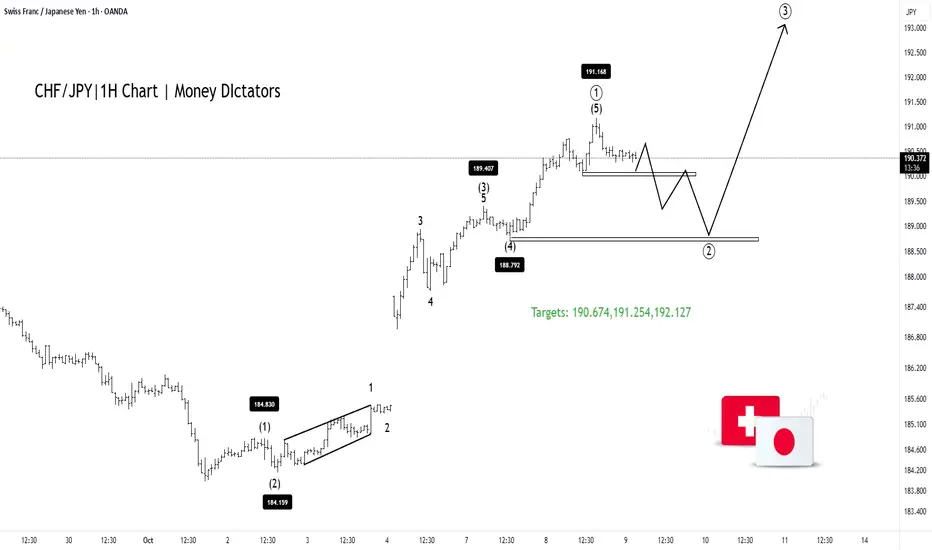
CHF/JPY Builds Momentum for Next Wave HigherThe CHF/JPY 1-hour chart shows a completed wave (1) near the 191.17 level, confirming a strong bullish impulse after a previous decline. The pair is now entering a wave (2) corrective phase, which is likely to retrace toward the 188.7–189.0 support zone before resuming the next upward move. This pullback appears to be a healthy correction within the broader uptrend. Once the correction is complete, wave (3) is expected to begin, targeting levels above 193.0 . The overall market structure remains bullish, suggesting that any short-term dips could offer potential buying opportunities for traders waiting for the next impulsive rally
Stay tuned
@Money_Dictators
Thank you.
NAS100 Forecast: A Fresh Bullish Impulse Toward New HighsThe NAS100 index is currently moving within a classic Elliott Wave structure. After completing wave (3), the market entered a correction phase that formed wave (4). This correction appears to have ended in the highlighted support zone, where buyers stepped in strongly. The five-wave pattern before wave (4) confirms a solid bullish trend. Now, the index seems to be preparing for the final upward move wave (5). This wave often represents the last push of a rally before a larger correction starts. As long as the price stays above the recent support near 24,400 , the next targets could be seen around 25,200–25,600 . In simple terms, the market is expected to continue its uptrend after a short pullback, following the typical Elliott Wave sequence of five upward waves and three corrective ones.

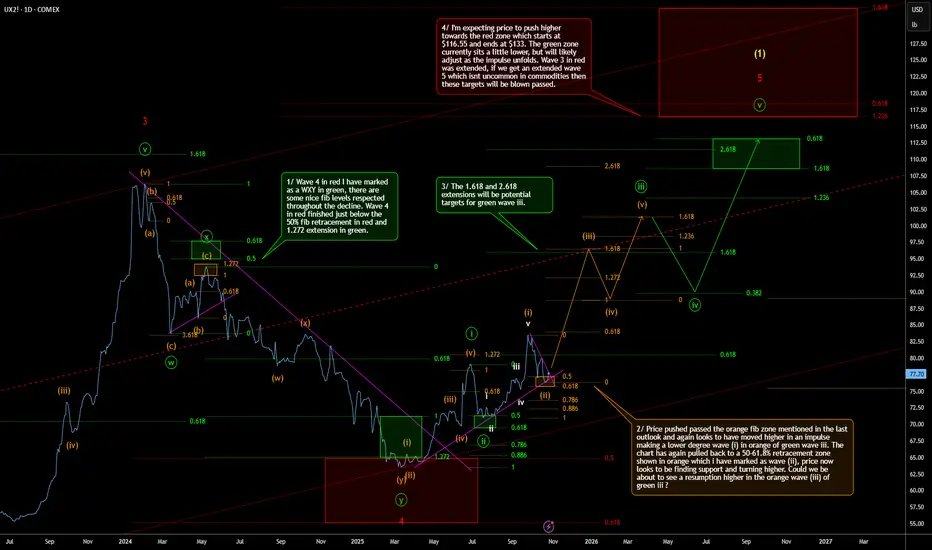
UX2! Uranium Futures Daily OutlookDaily update on the previously posted weekly outlook on COMEX:UX2! Uranium futures. Price is potentially making a i, ii, (i), (ii) with a bullish outbreak looming. Nice moves today on LSE:YCA and TSX:U.UN which i have covered recently, but need to update. The miners have moved more, haven't checked the news, but if Spot breaks out as the chart suggests then not going to hurt the upside is it!! More comments on the chart.
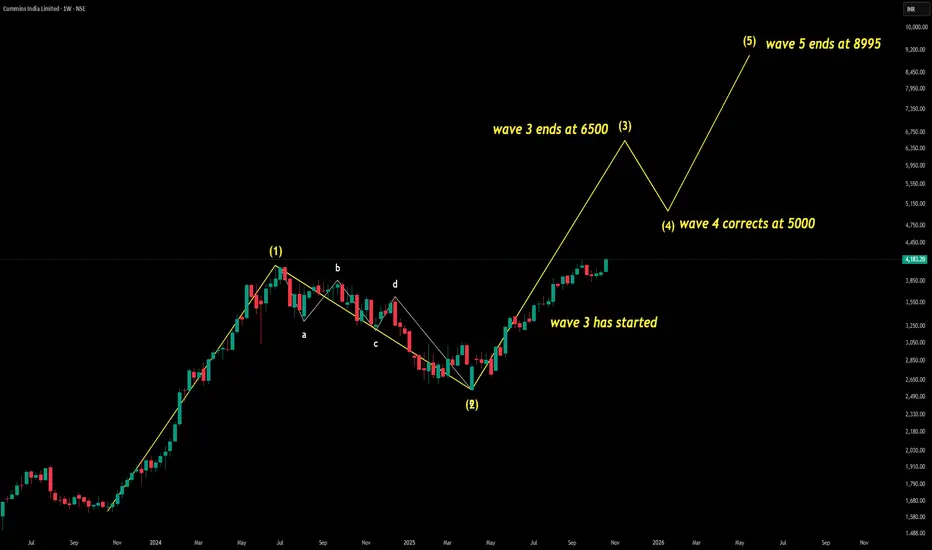
Elliot Waves showing teji in CUMMINS INDIAWave Structure Overview – Elliott Cycle Breakdown
This chart captures a full Elliott Wave impulse cycle (1–5) followed by the anticipated corrective phase (a–b–c). It reflects market psychology in motion—from early optimism to trend exhaustion.
Wave Summary:
Wave (1): Initial breakout – trend confirmation begins
Wave (2): Shallow pullback – bullish continuation
Wave (3): Ends at 6500 – strongest wave, broad participation
Wave (4): Corrects to 5000 – healthy retracement, sets up final push
Wave (5): Ends at 8995 – final rally, possible exhaustion or divergence
Wave a–b–c: Expected next – corrective structure likely
Technical Insights
Wave 3 shows classic acceleration – ideal for breakout teaching
Wave 4 respects Fibonacci zones – great for entry logic
Wave 5 overshoots – likely divergence, ideal for reversal training
Strategic Takeaways – For Traders & Students
Impulse cycle (1–5) is complete
Wave 5 has peaked at 8995 – trend exhaustion likely
What’s Next Prepare for a–b–c corrective structure
Watch for: RSI divergence
Volume drop
Fibonacci retracement zones (38.2%–61.8%)
“Wave 5 has completed at 8995. Expect a corrective a–b–c structure. Avoid fresh longs. Ideal time to teach reversal setups, divergence spotting, and Fibonacci retracement logic.”
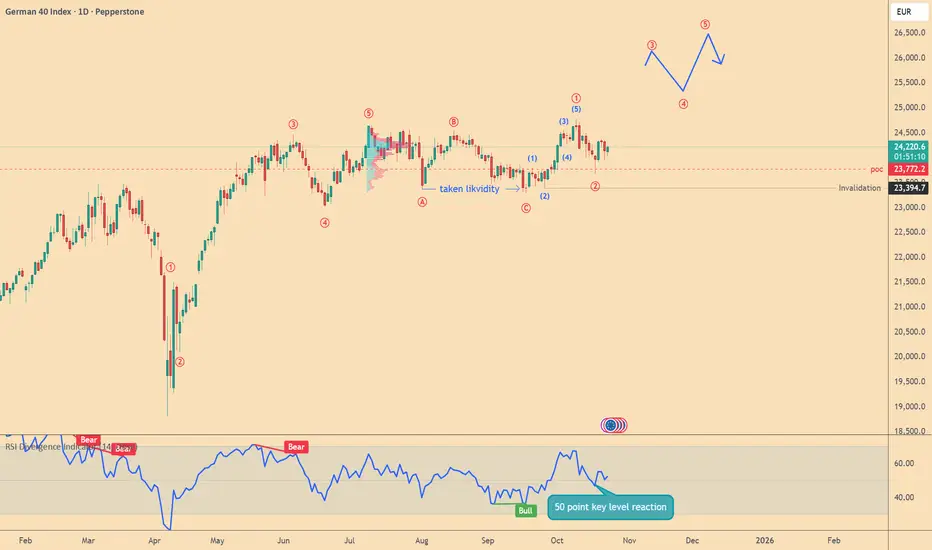
DAX/GER40, technical analysis 1DHello traders,
We bring you another important technical analysis on the DAX index.
We can see that according to Elliott Wave theory we have completed corrective ABC structure, also taken liquidity and started the bullish 12345 structure in smaller timeframe as u can see on the chart.
So the next outlook is that the value of the DAX index will increase.
But be careful!
It is necessary to respect the invalidation level in this case.
We also have to take into account the war in Ukraine, all of President Trump's statements, interest rates, and other stimuli that can change the market instantly!
WavePulse
LTCUSD Next Target for Bulls RevealedLTCUSD 4H Chart
The correction has already ended at 100.25 . We expect a small retracement before the trend continues. Upon closer examination, this correction appears to be subwave C of wave (4). For now, watch the 119 level for a potential bullish breakout.
LTCUSD Targets: 122 , 127 , and 132 .
Wave (4) has already reached the 0.382 Fibonacci retracement level, which may act as support near the upper boundary and serve as a possible reversal point.
Stay tuned!
@Money_Dictators
Thank you :)

XAU USD - keeps on giving in 2025Hello, it's been a while.
I've been on working building my pile in XAG, XAU reserves.
Now i am back, Gold is still giving a phenomenal return on printing up and right (meaning growth).
I don't know where price structure will end, however it's a highly probable chance we will hit $4,000USD per oz, and continue to raise.
Daily chart image shows my thought pattern and an opportunity I am waiting for price to revert to.
I'm referring to the Daily price chart and key counts are in line with Wave counting and supply and demand curve trading levels based on fair value gap intervals of weekly trading sessions plotted to a daily chart at intervals of 60.
Current wave - 3 of 5 in the Elliott wave count.
Master Key for zones
Red = Three Month
Blue = Monthly
Purple = weekly
Pink = Consolidative box example (Daily)
Orange = Daily
Risk Warning
Trading leveraged products such as Forex, commodities and CFDs, carries with it a high level of risk and so may not be suitable for every investor. Prior to trading the foreign exchange, commodity or CFD market, consider your investment objectives, level of experience and risk appetite. You should never risk more than you can afford to lose. If you fail to understand or are uncertain of the risks involved, please seek independent advice and remember to conduct due diligence as criteria varies to suit the individual.
Below are some of the take aways from the video - please listen again incase any detail is missed.
Do you enjoy the setups?
Professional analyst with 8+ years experience in the capital markets
Focus on technical output not fundamentals
Focus on investing for long term positional moves
Provide updates where necessary - with new updated ideas tracking the progress.
If you like the idea, please leave a like or comment.
To all the followers, thank you for your continued support.
Thanks,
LVPA MMXXIV

USOIL Near Final Leg USOIL is forming a clear corrective pattern inside a falling channel. Price is currently in the final leg of wave (5) of (C), suggesting one more dip is likely before reversal.
The downside target lies near 5,000–5,200 , where support from the channel base aligns. Once this level holds, a strong bullish reversal is expected, marking the end of the correction and the start of a new upward trend.
Stay Tuned!
@Money_Dictators :)

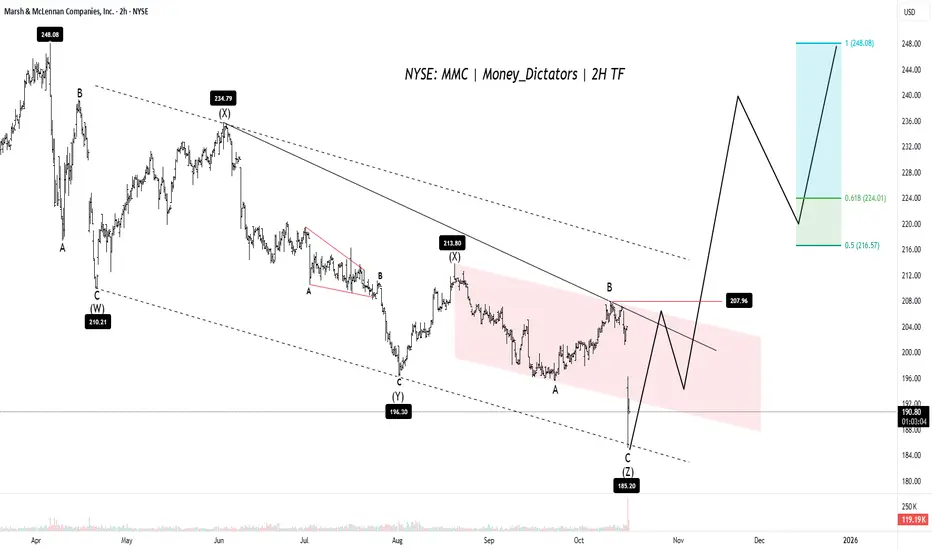
What Should You Expect From MMC?MMC is nearing the end of a recent price drop. The price is currently in its final downward phase, expected to bottom out around $184 to $186. Targets are 219, 234 & 245. Bulls can take control at wave B point(Resistance - $207).
If the price successfully holds above this $184–$186 support, the analysis predicts it will trigger a new, major upward trend. To officially confirm that the correction is over and a strong bullish trend has begun, the stock needs to break out above the $207 to $210 level. Once that breakout happens, the price is expected to rise sharply, potentially hitting the previous high of $248.
However, if the price drops below $184, this positive outlook will be invalidated, and the stock is expected to continue its downward correction.
Stay Tuned! Thank you:)
@Money_Dictators
M
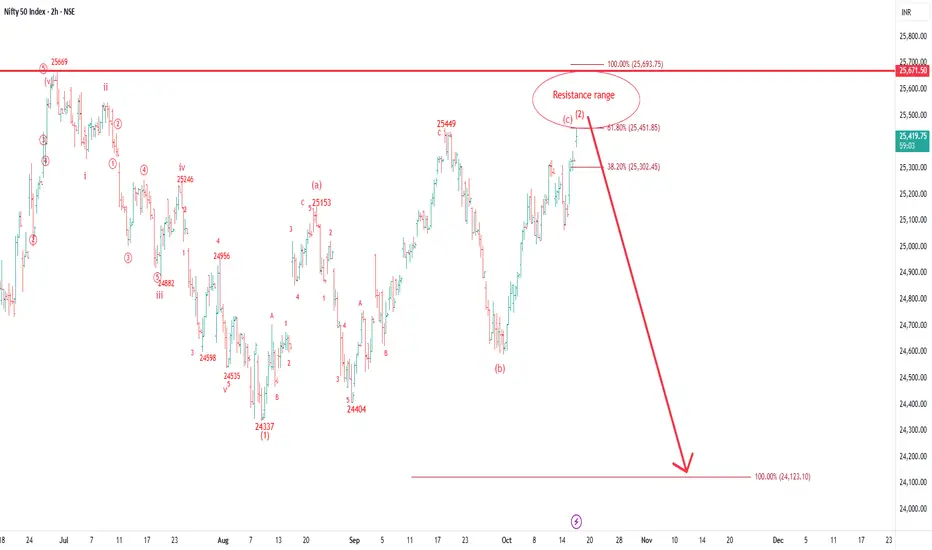
ALERT:Nifty is in Resistance range. Stay Cautious on Buying sideIn this 2hour chart Nifty formed a corrective pattern from 24337 and now it is near to its completion range and soon may decline below 24300 in coming days/weeks.
This analysis is based on Elliott wave Theory so If you have not understand Elliott wave then kindly ignore it.
Thank you.
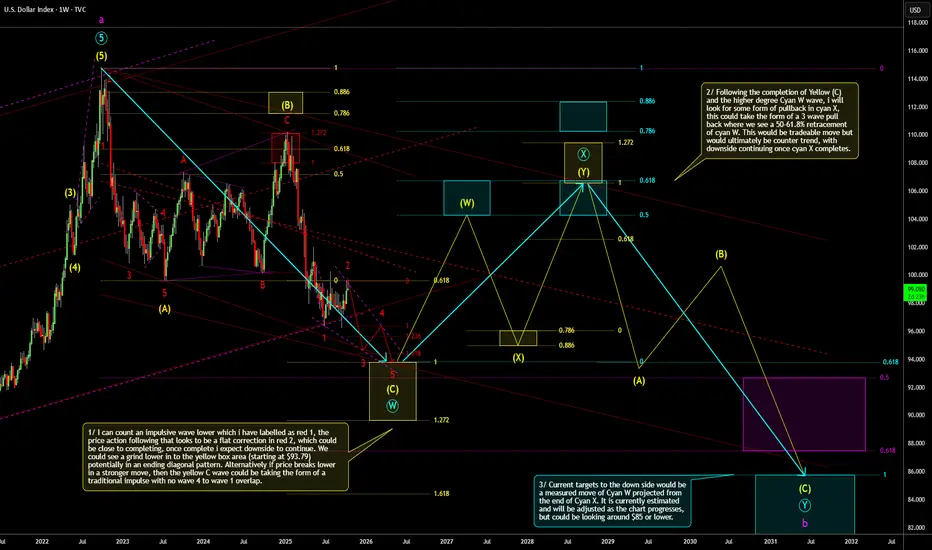
DXY Weekly Outlook (Count 3)This is a weekly timeframe outlook of the TVC:DXY . This is in alignment with my previously posted outlook which so far is playing out close to how I expected. This shows the wider view of what I think could be playing out. Still targeting the same yellow zone for a potential termination of the yellow (C) wave, after which we could see a counter trend consolidation. Current price action on the lower timeframe looks like it is forming a bearish flat correction which could be wave 2 in red. I'll look get a lower time frame update together, when time allows. More comments on the chart.
BTCUSDT – ABC Correction Hey traders 👋
Bitcoin might be setting up for a strong move downwards after completing what appears to be a 5-wave impulse structure on the higher timeframe.
There’s also a clear RSI bearish divergence, suggesting that bullish momentum is fading and a correction could be near.
I’m currently expecting a medium-term ABC corrective phase, though it’s still uncertain whether it will develop as a classic zig-zag or a flat/flag-type correction.
🎯 Trade Plan (Short Setup)
- Entry Zone: 112,000 – 118,000 USDT
- Stop Loss: above 125,000 USDT
- Take Profit 1: 75,000 USDT
- Take Profit 2: 52,000 USDT
- Final Target (Wave C): around 43,000 USDT
⚡ Notes:
If BTC breaks below the previous wave 4 area with strong momentum, that would add more confirmation to the corrective scenario. However, if the market maintains higher lows, we could still see an extended B-wave or even a continuation of the uptrend.
📘 Reminder:
This is not financial advice — always DYOR and manage your risk properly.

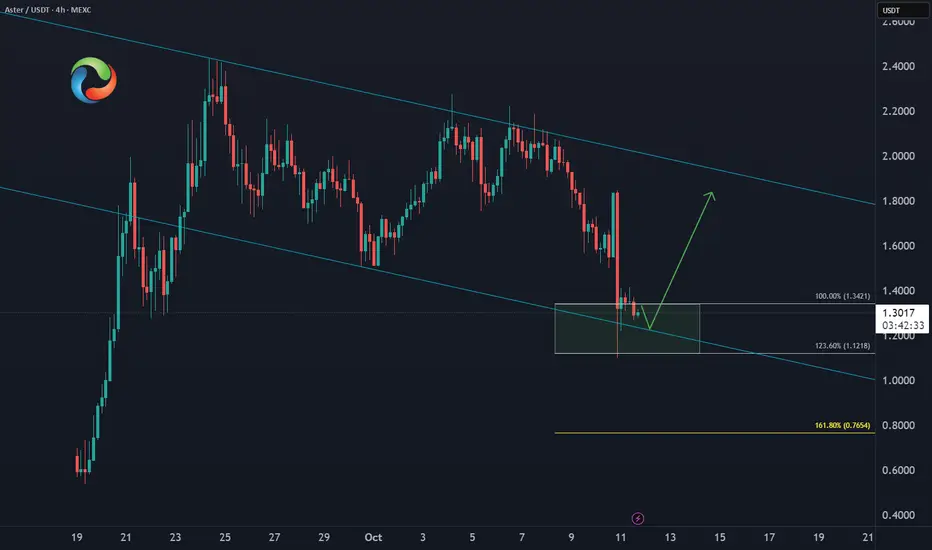
ASTER Short Term Update📊 BYBIT:ASTERUSDT Down ~50% from the highs, but the structure still screams correction, not collapse. We're seeing 3 clean swings into the equal legs zone:
🔹 $1.34 – $1.12 = key inflection area.
📈 A bounce from here is likely next week, potentially tagging the upper boundary of the downtrend channel.
But don’t get comfy, this move could be just a pause before the next decision leg.
🔹Watch for reaction, not prediction.
Primary targetsAVAX has a perfect book structure. Tonight, wave 2 reached its bottom, perfectly in line with the norms. According to mathematical statistics, wave 3 could reach ~2400 in January 2027. Wave 5 may end near 6800.
What is the most difficult thing about investing?
- Doing nothing.
:) Have a fat profits!
