GOLD → Ready for continued growth. Target 4100 - 4125FX:XAUUSD remains above $4,000, starting the week with a record high amid the escalating trade war between the US and China. Traders bought up all of last week's decline.
Key drivers: Trump's new tariffs: Introduction of 100% tariffs on all Chinese goods and export controls on software from November 1. China is not sitting idly by: Restrictions on exports of rare earth metals and technologies.
The ongoing shutdown and trade uncertainty are weakening the dollar.
US inflation data (CPI on October 24) will be the first key release after the shutdown.
Speeches by Fed officials may adjust rate expectations.
Gold remains in an uptrend, but momentum will depend on the progress of trade negotiations. A breakout to new highs is likely if tensions remain high.
Resistance levels: 4078, 4100, 4110
Support levels: 4059
A breakout of 4078 and a close above the key level could trigger a continuation of the growth to 4100. An additional scenario could be a correction to 4059 before further growth to 4100-4125.
Best regards, R. Linda!
Elliott Wave

Baozun -- The Perfect StormAs you've seen from my other Ideas....
I'm not one for extensively long descriptions, nor am I keen on tunneling in on fundamentals.
I see patterns.
I see opportunity.
Don't sleep on this one.
Take advantage during this stage of weakness right now.
I think the risk is no match for the reward.
God-bless.
-TradesTyrone

Klarna 1-2 SetupFirst 1-2 setup failed, however the moment we stop trying is the moment we stop believing, tight stop want to see follow through this time

SP500: Breaks Out Of Channel, Steps Into Wave Four I hope you had a nice weekend despite that nasty turn lower on stocks we saw on Friday. As you know, the move came after Trump threatened to impose new tariffs on China, following China’s own restrictions and tighter export controls on rare earth metals, which are crucial for the tech sector. We’ve seen this story before back in April, and if tariffs come back into focus again, traders will likely react with fear — so it’s not a surprise we saw such a strong drop in stocks on Friday.
Normally, markets are most sensitive when this kind of news first hits, and then they tend to stabilize afterward. What’s interesting, though, is that despite the strong sell-off in stocks, the dollar index didn’t show the kind of sharp upside reaction you’d usually expect. So I’m wondering if stocks can find some support, but seems like this can be only wave B rally, since we are in the middle of wave four retracement. Keep in mind there is an open gap lower on futures.
Big supports is at 6400 and 6200.
Grega
Eth looking for swing longThere is one last wave, Flat correction for the fourth wave the fifth major one.

ETH Elliott wave analysis 13/10 /2025In my view, ETH has not yet completed its upside cycle, and the recent decline is simply part of wave (c) within wave (IV).
I believe we are currently in wave (5), specifically within wave 3 of that structure. The reason is that if waves 1 and 3 were corrective ABC structures, then wave C should not exceed 138.2% of wave A, otherwise it would invalidate the b-failure flat pattern—and this limit has already been exceeded, confirming the impulsive nature of the current move.
The Shark harmonic pattern indicates a potential target zone around $5,000–$5,100, which aligns with the requirement for a higher high to complete wave 5. Interestingly, this target also coincides with a Gann Fan resistance level, adding further confluence to this projection.
The invalidation level for this bullish scenario is at $3,800.
A break below this level would suggest that a full bear market structure has already begun.

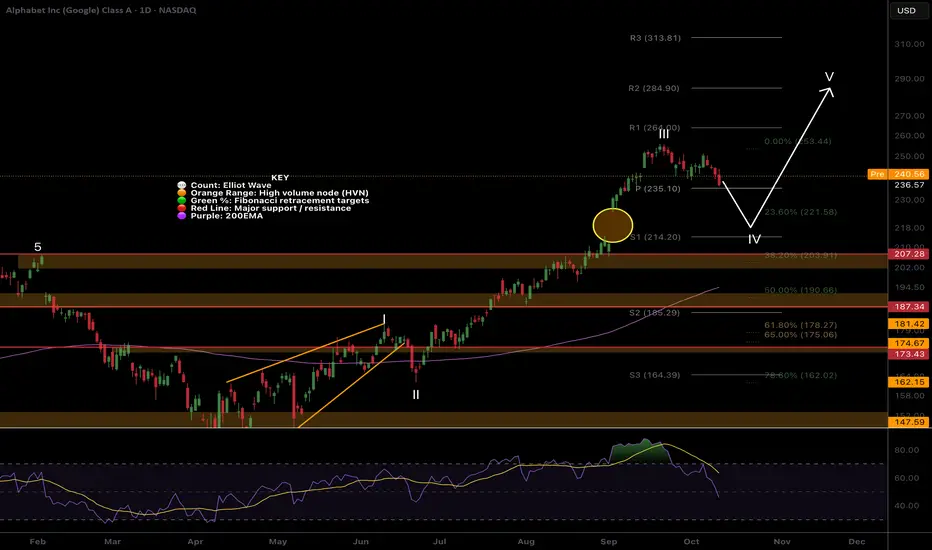
Google Gap fill + wave 4?Google has had a great run into price discovery in wave III uptrend but now appears exhausted and ready for a short term pullback setting up new signals.
The gap looks likely to be filled as coinciding the wave IV Fibonacci targets and the S1 daily pivot.
RSI is making its way into oversold with plenty of room to fall. Price may fal as far as the 0.382 Fibonacci and retest the previous all time high!
Safe trading
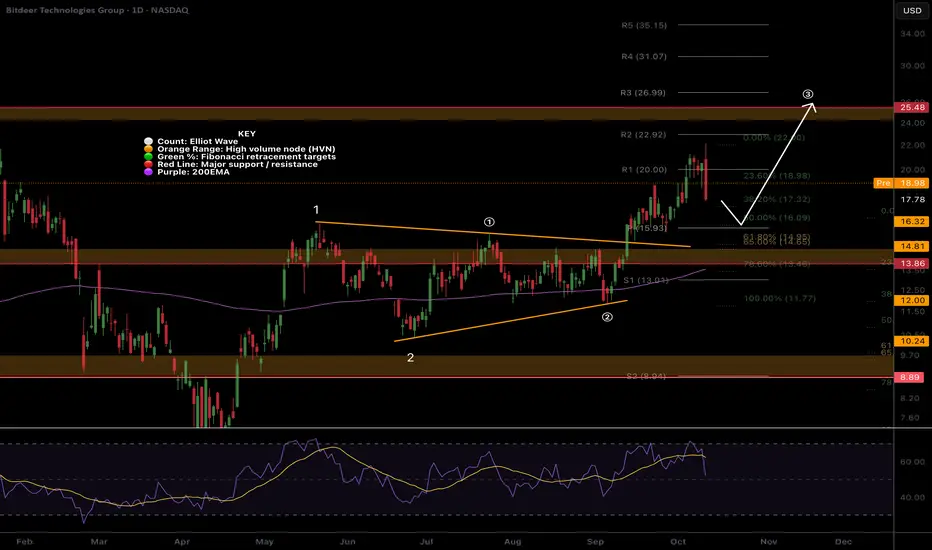
BTDR Volatile, but uptrend intactNASDAQ:BTDR had a huge bearish engulfing candle Friday. I keep my positions smaller on these assets.
Price is still in a wave 3 breakout towards the $25 High Volume Node target. It appears wave (1) of 3 is complete with a wave (2) target of the daily pivot and 0.5 Fibonacci or golden pocket zone nearby. That would also test the untested wave 1 high as support a highly likely event.
RSI has reset to the EQ where it often finds support in a strong uptrend.
Safe trading
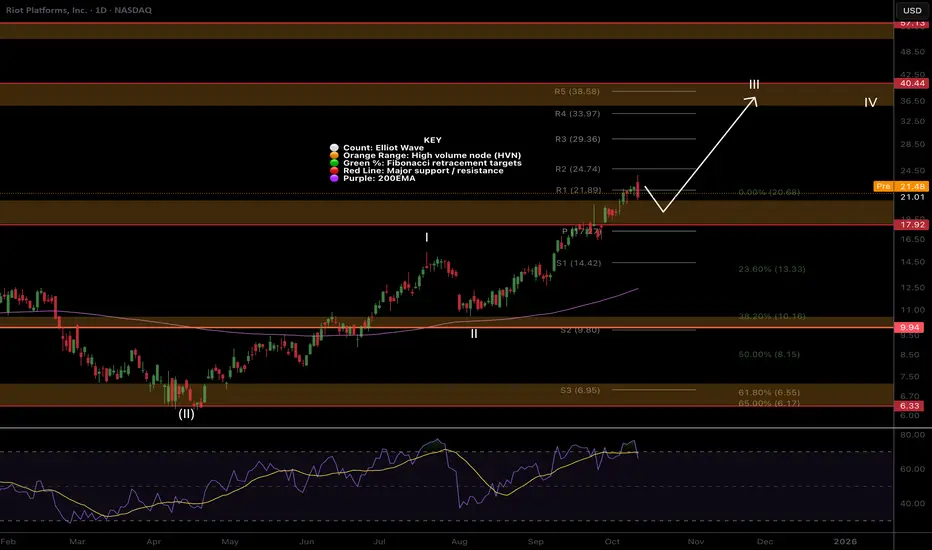
RIOT.. Nothing changed, $40 targetNASDAQ:RIOT broke out through resistance earlier than expected! A retest of the High Volume Node as support is highly likely event and price has a little down to go to get there. It may even be front run today.
RSI is overbought with no bearish divergence and can persist here for months in trending asset.
Wave II is underway and the next target is $40 High Volume Node resistance and the R5 daily pivot.
Safe trading
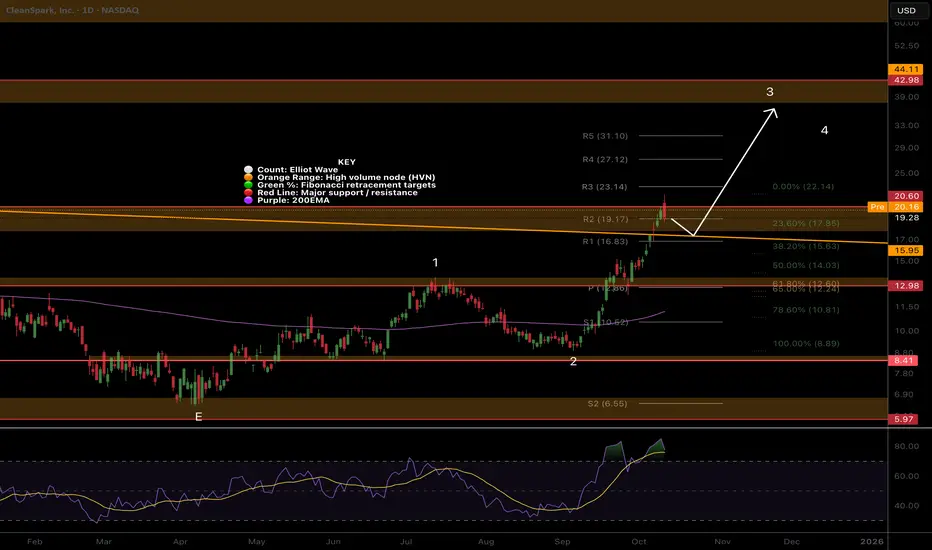
CLSK Rejected at thr major resistance, higher to go CLSK hit our first take profit target at the major resistance High Volume Node but has broken out of the macro triangle structure hinting at a big move still to come! Nothing concerning for me yet happening.
Wave 3 is underway to a minimum target of the $40 High Volume Node
RSI is overbought but no divergence and this can persist up here for months.
Safe trading
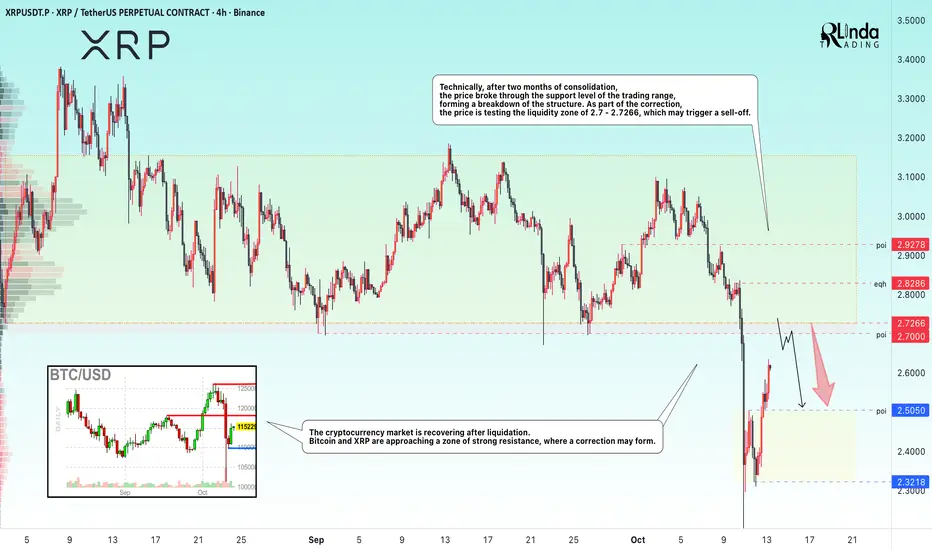
XRPUSDT → Resistance at 2,700 could trigger a correction BINANCE:XRPUSDT is forming a correction after a strong sell-off. It is not yet worth hoping for strong growth without pullbacks, as there is a strong resistance zone ahead.
The cryptocurrency market is recovering after liquidation. Bitcoin and XRP are approaching a strong resistance zone, where a correction may form.
Technically, after two months of consolidation, the price broke through the support of the trading range, forming a breakdown of the structure. As part of the correction, the price is testing the liquidity zone of 2.7 - 2.7266, which may trigger a sell-off.
Resistance levels: 2.7 - 2.7266, 2.8286
Support levels: 2.505
A sharp rise and the lack of technical potential to break through the resistance level of 2.70 may trigger a false breakout and a correction to the support level of 2.5050.
Best regards, R. Linda!
XRP, Terminal move complete. New all time high?What a mess Friday turned out to be with a recording breaking liquidation event with the numbers still growing - bigger than FTX!
SUNK COST FALLACY: THE DAMAGE IS DONE, DO NOT PANIC IN AND OUT OF POSITIONS.
So many alt-coins proved there is nothing but thin air holding them up - no real demand whatsoever! I'll take a look at some charts today. Now these wicks can be classed as 'anomalies' in technical analysis but in this case i think we've revealed some of the strong tokens now with real backing.
It is expected that with such large wicks we at least test the centre of the wick on one more terrifying shake-out that isnt actually as bad as the one we just has but feels it because traders and investors are been kicked while their down in a state of panic.
-------------
CRYPTOCAP:XRP showed a lot of weakness on that dump hitting the High Volume Node target and macro 0.382 Fibonacci retracement at $1.5, a target i was laughed at for posting a couple of weeks ago! The more 'bullying' that takes place the more I assign probability of hitting that target. Sentiment wins.
Price left a long lower wick which is likely to be revisited as we are now in a bearish structure. The $2 High Volume Node is the likely target. Price is tough quadruple resistance - daily 200EMA, channel lower boundary, High Volume Node and S1 pivot. Lots of supply may come in here.
Wave 2 appears to be complete so once we have one more fearful move down we may accelerate to new all time highs.
RSI hit oversold but with no bullish divergence.
Safe trading
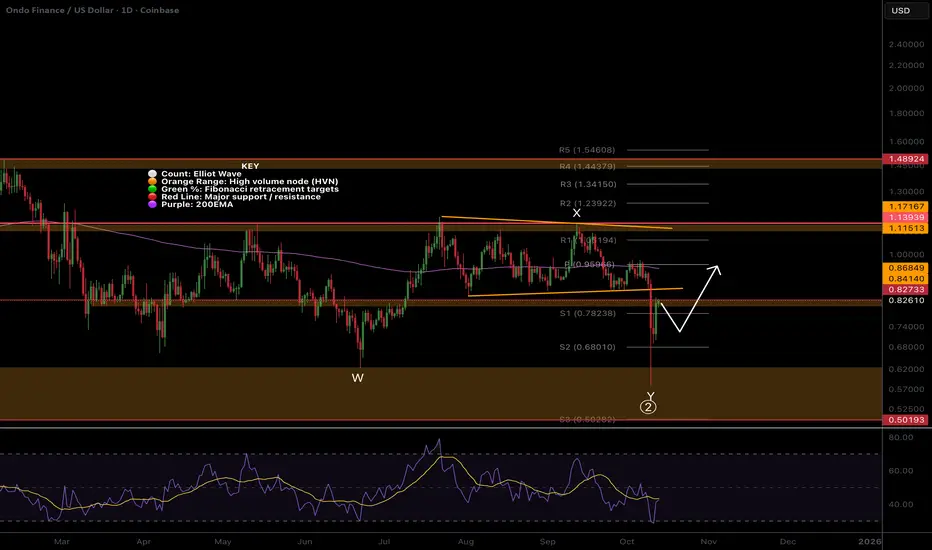
ONDO, Time for wave 3 up into ATH?What a mess Friday turned out to be with a recording breaking liquidation event with the numbers still growing - bigger than FTX!
SUNK COST FALLACY: THE DAMAGE IS DONE, DO NOT PANIC IN AND OUT OF POSITIONS.
So many alt-coins proved there is nothing but thin air holding them up - no real demand whatsoever! I'll take a look at some charts today. Now these wicks can be classed as 'anomalies' in technical analysis but in this case i think we've revealed some of the strong tokens now with real backing.
It is expected that with such large wicks we at least test the centre of the wick on one more terrifying shake-out that isnt actually as bad as the one we just has but feels it because traders and investors are been kicked while their down in a state of panic.
-------------
LSE:ONDO appears to have completed a WXY wave 2 complex correction finding strong support in the High Volume Node.
Price is in a bearish market structure at double resistance- High Volume Node, channel lower boundary. Traders should be cautious.
Price is likely to have one more pullback to scare weak hands out before starting wave (3) of 3 to new all time highs. We could see $0.68 challenged at the S2 pivot.
If we break back into the channel the daily 200EMA will be the next resistance.
Safe trading
HBAR, hit the Golden pocket target ive discussed!What a mess Friday turned out to be with a recording breaking liquidation event with the numbers still growing - bigger than FTX!
SUNK COST FALLACY: THE DAMAGE IS DONE, DO NOT PANIC IN AND OUT OF POSITIONS.
So many alt-coins proved there is nothing but thin air holding them up - no real demand whatsoever! I'll take a look at some charts today. Now these wicks can be classed as 'anomalies' in technical analysis but in this case i think we've revealed some of the strong tokens now with real backing.
It is expected that with such large wicks we at least test the centre of the wick on one more terrifying shake-out that isnt actually as bad as the one we just has but feels it because traders and investors are been kicked while their down in a state of panic.
-------------
The WXY wave 2 complex correction has seemingly completed just above the golden pocket mentioned in previous analysis as target for any deep pullback.
But we are now in a bearish structure and we should be cautious. Just ahead lies the quadruple resistance, S1 pivot, 200EMA, major High Volume Node and channel boundary bottom.
Its typical for price to pullback into the wick to smash the fear into weak hands before flying up in a wave 3 to new al time highs. The S3 pivot is the target $0.15 adn I will look out for longs here.
RSI does not have bullish divergence but did bounce from oversold.
Safe trading

ETH is still following my plans pretty preceiselyWhat a mess Friday turned out to be with a recording breaking liquidation event with the numbers still growing - bigger than FTX!
SUNK COST FALLACY: THE DAMAGE IS DONE, DO NOT PANIC IN AND OUT OF POSITIONS.
So many alt-coins proved there is nothing but thin air holding them up - no real demand whatsoever! I'll take a look at some charts today. Now these wicks can be classed as 'anomalies' in technical analysis but in this case i think we've revealed some of the strong tokens now with real backing.
It is expected that with such large wicks we at least test the centre of the wick on one more terrifying shake-out that isn't actually as bad as the one we just has but feels it because traders and investors are been kicked while their down in a state of panic.
-------------
CRYPTOCAP:ETH was looking toppy for a while especially with the 'poke above all time high' Elliot wave 1 rule and i shared my thoughts on downside targets. It is has my secondary target o the drop of the daily 200EMA and bounce hard with bullish divergence in RSI. This is also a shallow retracement of the .382 Fibonacci showing macro strength.
I expect another pullback to test the High Volume Node as support before a strong wave 3 to commence
Safe trading

AAVE local whats next? Total alt-coin leverage wipeout!What a mess Friday turned out to be with a recording breaking liquidation event with the numbers still growing - bigger than FTX!
SUNK COST FALLACY: THE DAMAGE IS DONE, DO NOT PANIC IN AND OUT OF POSITIONS.
So many alt-coins proved there is nothing but thin air holding them up - no real demand whatsoever! I'll take a look at some charts today. Now these wicks can be classed as 'anomalies' in technical analysis but in this case i think we've revealed some of the strong tokens now with real backing.
It is expected that with such large wicks we at least test the centre of the wick on one more terrifying shake-out that isnt actually as bad as the one we just has but feels it because traders and investors are been kicked while their down in a state of panic.
-------------
Price printed a topping wedge, broke down, tested as resistance and dropped. The drop was likely anyway but the extent of systematic failure made it worse.
Aave did not penetrate the lows of the larger range and found support in the High Volume Node all the way back to the 0.5 Fibonacci retracement and is now back testing the daily 200EMA as resistance.
Wave 2 is likely complete. We probably visit the wick on a scary candle to $209 High Volume Node before finding a bottom for a huge wave 3 of 3 move up to new highs! A likely scenario now that we have shaken out all the weak hands.
These events often mark the bottom. Daily divergence is not oversold or has bullish divergence yet. The macro structure is still in tact!
Safe trading

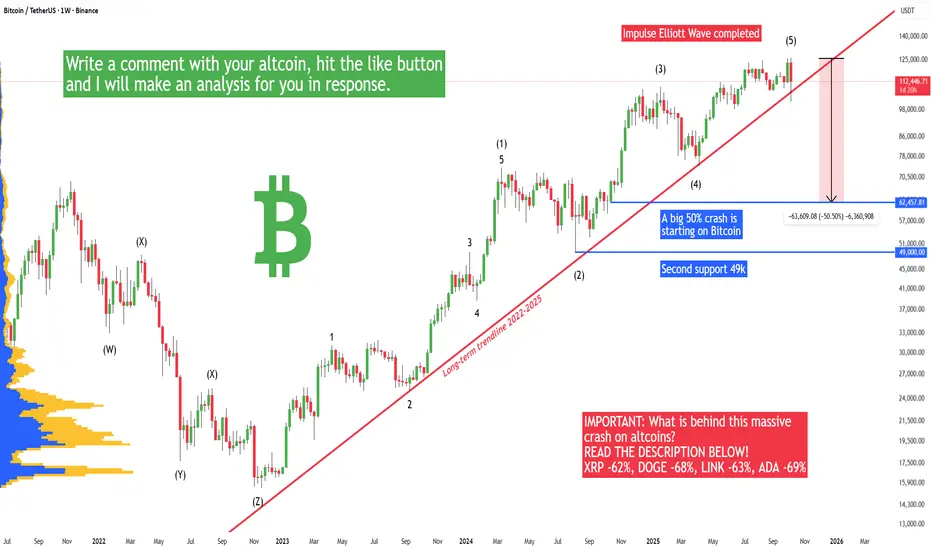
BITCOIN AND CRYPTO RUG PULL, HERE IS THE REAL REASON WHY!In the 1-hour time period, all altcoins and Bitcoin crashed on Friday afternoon/night! The real reason behind this crash is in this article. The vast majority of traders on the futures market got liquidated with a very low leverage of 2x or more.
If you still believe in Democrats and their controlled opposition Republicans, this article may open your eyes. So what happened? You probably already know that the crypto market is completely controlled and manipulated by whales (banks and huge institutions). Not only the price but also the development. If you still believe that Bitcoin is here to bring freedom or that Bitcoin is developed by some geeks and that the banks have no control over Bitcoin, please wake up! It's completely the opposite. Bitcoin is a bank's biggest love, and if you love Bitcoin, you also love the Fed and their money printer and inflation.
XRP -62%, DOGE -68%, LINK -63%, ADA -69%
Alien in disguise Elon Musk and his favorite DOGE coin dropped by 68% and almost hit a new long-term low since 2022. We have never seen such a crash in the history of this coin, and what is the reason behind this rug pull? Why are all Doge investors and traders disappointed by the performance of this coin? After almost 5 years, the coin was trading today at 0.08 USDT, which is minus 90% from the all-time high peak in 2021! Currently, this coin is trading 75% below the all-time high peak! So what is happening, and why did Elon Musk fail in the eyes of his fans? Pretty much everyone who watched the live rug pull was in disbelief, because their portfolio and all their money were pretty much wiped out. Elon Musk and his reptilian friend Donald Trump are not here to save you, nor to help you. The reason behind this crash is simple—to take away your money while you are cheering at what they do. Twitter used to be a good platform, but after Elon Musk's touch, it turned black, and X is not even a name; it's a letter.
What about ADA? Trump (Biden's good friend, btw) a few months ago made a post on the scam social network TruthSocial (btw, they only took the Twitter source code and renamed it to TruthSocial; that's why it's the same) about strategic crypto reserves, including the ADA coin. This is supposed to be bullish, but ADA today just almost hit a new all-time low and wiped all gains made in 2022, 2023, 2024, and 2025. Almost every ADA investor is deeply unsatisfied with the performance of this coin.
It's so obvious that the banks started selling and crashed the whole crypto market, forcing all futures traders to quit their long positions. The crypto market is a bank's paradise when it comes to making money; in other words, it's a casino and pump and dump scheme. There is no secret that 99% of crypto investors are at a loss or have experienced a huge loss already. This crypto technology was brought to planet Earth by reptilians and mantoids, so if you think that some human invented this technology, you have been scammed. And this technology is not here to bring freedom, actually it's the opposite. All transactions are monitored on the public blockchain. Every year you see more crypto restrictions; it basically turned into a total control money system, 100x worse than cash or fiat. And that's not all; soon everyone will mine Bitcoin with their physical body instead of computers (see patent WO2020060606A1 - Cryptocurrency system using body activity data). Your mind connected to the hive AI network will not be the best experience on this isolated planet Earth from the rest of the galaxy. It's good that we have democracy, and the most important thing about democracy is freedom of speech.
Many, many coins went to ZERO (0.00 USDT) on the spot market, such as IOTX. That's when there were absolutely no buyers (only sellers), and people that sold lost all their money. Please do not look at news or search for what happened to the crypto market. It's more than obvious that the banks wanted to liquidate as many people as possible. And they will do it again and again in the future, so be prepared if you want to stay in this crypto casino game.
Write a comment with your altcoin, hit the like button, and I will make an analysis for you in response.
USDCHF_1D_BuySwiss Franc Analysis Elliott Wave Analysis Style Daily Time Frame The market has completed the five-wave Elliott wave downtrend and can enter the corrective wave and rise due to the break of the trend line of the corner pattern in wave five Main number as support 0.79500 Targets are 0.86700 and 0.89000 respectively

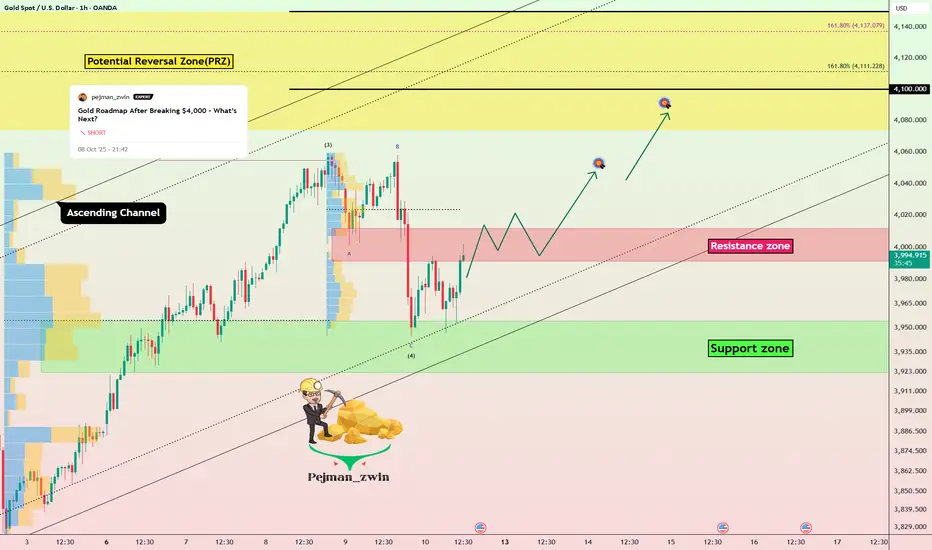
Gold Breakout Setup After Completing CorrectionGold ( OANDA:XAUUSD ) fell to $3,963 , as I expected in my previous idea .
Gold is currently moving near the lower line of the ascending and the Resistance zone($4,012 – $3,991) . If Gold touches $4,003 , we can expect a break of the Resistance zone($4,012 – $3,991) .
In terms of Elliott Wave theory , it seems that the Zigzag Correction(ABC/5-3-5) of Gold in the form of wave 4 has been completed, and we can expect a rise in Gold in the coming hours after the break of the Resistance zone($4,012 – $3,991) .
I expect Gold to break the Resistance zone($4,012 – $3,991) in the coming hours and rise to at least $4,047(First Target) .
Second Target: Potential Reversal Zone(PRZ)
Stop Loss(SL): $3,918(Worst)
Support zone: $3,954 – $3,923
-----------------------------
Today, we’ll be watching two reports :
Prelim UoM Consumer Sentiment and Prelim UoM Inflation Expectations.
If we see a significant deviation from expectations, it could trigger noticeable volatility in Gold .
-----------------------------
Please respect each other's ideas and express them politely if you agree or disagree.
Gold Analyze (XAUUSD), 1-hour time frame.
Be sure to follow the updated ideas.
Do not forget to put a Stop loss for your positions (For every position you want to open).
Please follow your strategy; this is just my idea, and I will gladly see your ideas in this post.
Please do not forget the ✅ ' like ' ✅ button 🙏😊 & Share it with your friends; thanks, and Trade safe.
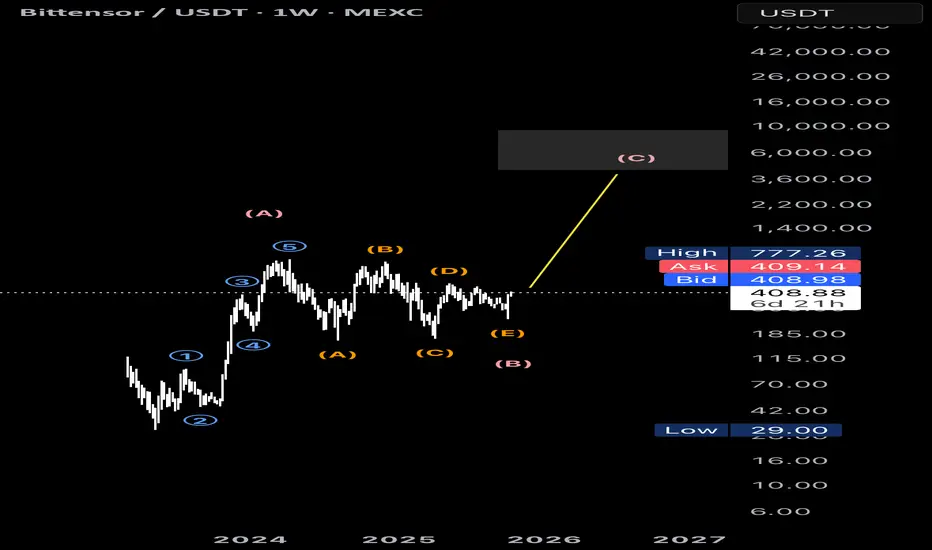
TAOUSDT | Wave (C) Impulse Targeting 4,346 After ABCDE CorrectioThe weekly chart suggests a complex ABCDE correction has completed after a five-wave impulse, increasing the probability of a new bullish Wave (C) toward the primary target at 4,346. The scenario remains valid as long as the E-wave low holds on a weekly closing basis; a weekly close below that low invalidates the setup and shifts bias back to an extended range.
Entry and Invalidation:
• Accumulation zone: 390–430, or a confirmed weekly breakout above 450 to add confirmation toward 4,346.
• Invalidation: Weekly close below the E-wave low cancels the Wave (C) path and calls for reassessment.
Targets and Risk Management:
• Interim target: Retest of the prior high near 777, then intermediate extensions around 1,100–1,700, with the main Wave (C) objective at 4,346.
• Risk management: Use a trailing stop beneath rising weekly swing lows; advance the stop after each broken resistance to preserve gains on the path toward 4,346.
Additional Notes:
• Preference for strong weekly closes with rising volume on breakouts; fading momentum around 700–780 could lead to consolidation or a re-accumulation phase.
• Alternate view: Failure to break out and sustained range behavior may extend the corrective structure in time, so plan with flexible position sizing and disciplined capital management.
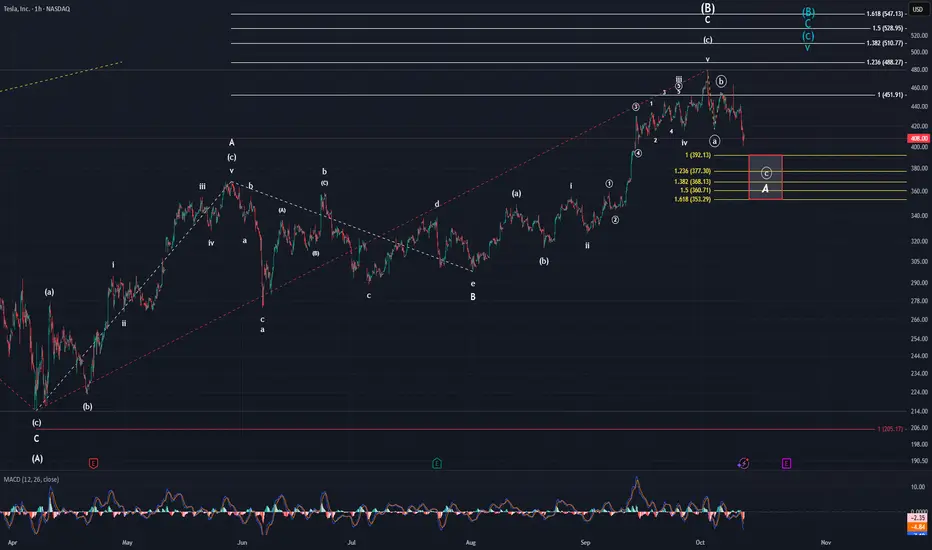
TeslaFriday was a rough day for anyone that was long...pretty much anything lol. There were a few tickers like MP that posted a green day, but they were far and few between. Tesla was no exception to this and closed down over $22. This should not have come as a surprise for anyone though. Maybe the magnitude in which the market turned downwards, but not that it did. I have been saying for 2-3 weeks that the top was near. that being said, although price tanked the way that it did, we technically do not have the confirmation needed for a top. Do I think it likely we have a top in place? Yes, I do. However, one cannot definitively say it is in for a fact. The absolute confirmation doesn't come until we can breach $368.33 unfortunately.
We will get clues and data pointing to a top on the way down though. The first thing I want to point out is that we have officially breached the last TWO wave 4's of a lesser degree. This in itself is a very good sign the top is in. Also, MACD made a new local low. When you look at the yellow fibs tracking the possible abc down, the 1.382 is just below that minor A wave top. This means over half of the standard target area for minute ((c)) of minor A is below the minor A high.
Another thing I want to point out is that in the overnights, Robinhood is showing Tesla trading @ $423 currently, and has raised as high as $425. This could be pointing to a couple things. The first is that the minute ((c)) wave is just subdividing into a smaller 3-wave pattern that will ultimately end within the target box to conclude minor A wave. The other is that Friday's low was the minute ((a)) wave low with ((b)) currently underway. Then lastly, it could be pointing to my ALT turquoise count that suggests another high to the low $500's is needed.
I do not like the turquoise count, but I cannot rule it out with 100% certainty yet, so it stays for now. The count that I favor is the white count, and ((c)) being carved out in three waves. Hopefully we get some clarifying data tomorrow, but if not, we should get some this week. For now, we continue observing. Should you not be able to help yourself and want to enter into a trade...use TIGHT stops. I am not a gambling man, so I will remain on the sidelines. Ultimately, I believe it is only a matter of time until we see price back into the $100's...
BNB ANALYSThe analysis is on daily time frame and will give you a long term view
If these analyses help you to make better profits then share this analysis with your friends
And post your questions below this analysis

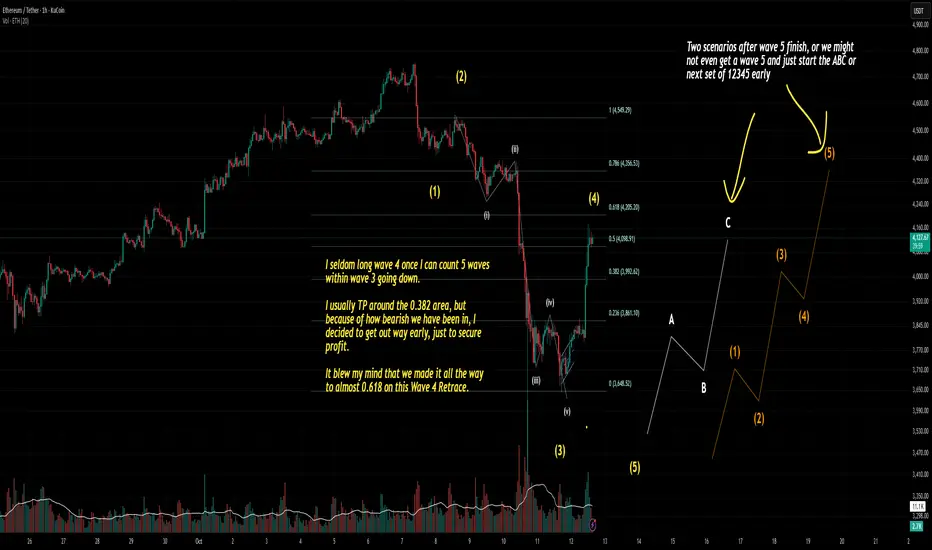
ETH (My thoughts after TP on my long position)I’m still an Elliott Wave noob, so the drawing on my chart is purely theoretical. It’s based on personal speculation — not financial advice.
Right now, I’m working under the assumption that we’re either in a corrective Wave A heading down, or in Wave 2 of a larger structure on a higher timeframe.
Last night, I counted five waves down within Wave 3 and started to notice signs of support. So instead of riding it out for a retrace back to the usual 0.382 Fib, I decided to long Wave 4 early and took profit once it hit an amount I was comfortable with.
Given how sharp the recent drop was, I was worried this might be one of those weak sub-Wave 4 retracements. I honestly doubted we’d even make it to 0.382, and even if we did, I expected it to take another 12–24 hours.
This morning, ETH shot up another $200 to $4000 right after I TP’d. I won’t lie — I definitely felt some ROMO (regret of missing out). An hour later, I checked again and saw it nearly tagged the 0.618 Fib. I was shocked at how fast it recovered.
But I reminded myself: don’t FOMO in and end up stuck in a long while Wave 5 is setting up to go down. I’ve learned that less profit is better than no profit. So I’m sticking to my plan and moving on.
My outlook from here:
I’m expecting Wave 5 to start between now and the London session open. Then, during the U.S. session, we might see another impulsive 1-2-3-4-5 leg up or begin corrective Wave B (if we really are in corrective Wave A down).
Good luck, everyone. Stay disciplined and trade your plan.