BTDR savage dump, renewed opportunity?NASDAQ:BTDR Locally, the price broke into an all-time high as expected, but the depth of the crash was unexpected, losing 70% of its value in a matter of days. My trading signal took partial profit for 3.57RR at the highs, and the rest of the position was knocked out at breakeven, leaving us with an overall win.
Bullish divergence on a higher low from oversold has emerged. This was also at the 78.6 Fibonacci, where we expected low-cap assets to retrace to- usually marking a bottom. Price behaviour is a series of ABCs changing the overall dynamics. Wave B appears to have ended with wave C minimum target being $38.22 based on 1:1 Fib extensions, also the R3 pivot.
📈 Daily RSI has printed a confirmed bullish divergence from oversold.
👉 Continued downside has a target of $5.59 High Volume Node
Safe trading
Elliott Wave

More upside for SPX500USDHi traders,
Last week SPX500USD went up again just as I've said in my previous outlook.
Next week we could see a correction down and more upside for this pair.
Let's see what the market does and react.
Trade idea: Wait for a correction down. After a change in orderflow to bullish you could trade longs.
This shared post is only my point of view on what could be the next move in this pair based on my technical analysis.
But I react and trade on what I see in the chart, not what I've predicted or expect.
Don't be emotional, just trade your plan!
Eduwave

More upside for EUHi traders,
Last week EU slowly went up as I've said in my previous outlook.
Next week we could see more (corrective or impulsive) upside for this pair.
Trade idea: Wait for a small correction down and look for a change in orderflow to bullish on a lower timeframe to trade longs.
This shared post is only my point of view on what could be the next move in this pair based on my technical analysis.
But I react and trade on what I see on the chart, not what I've predicted or expect.
Don't be emotional, just trade your plan!
Eduwave

$HIMS: Wave [II] Consolidation may be overNYSE:HIMS : I count its May 2022 low as starting a new 5-wave sequence at the Major degree. Wave has completed. Wave correction has been deep, slightly exceeding the 61.8% retracement, where it found support at the $25 break out level. It's been in a complex W-X-Y correction. For the Y leg, we have AB = CD target reached.
If indices rally from here, NYSE:HIMS 's Wave appears to have completed. I have a very small position with an average cost of around $37 after selling covered calls.

Bitcoin Short: Stop above $93,800This is a short bitcoin idea where the preferred counts are in green (long) and the alternate counts (long) is in red.
For preferred count, we are still in a downtrend and bitcoin will continue down in a 5th wave.
For the alternate count, the downtrend has ended as Cycle wave 2 of 5, and we will be going into a Cycle wave 3 of 5 up.

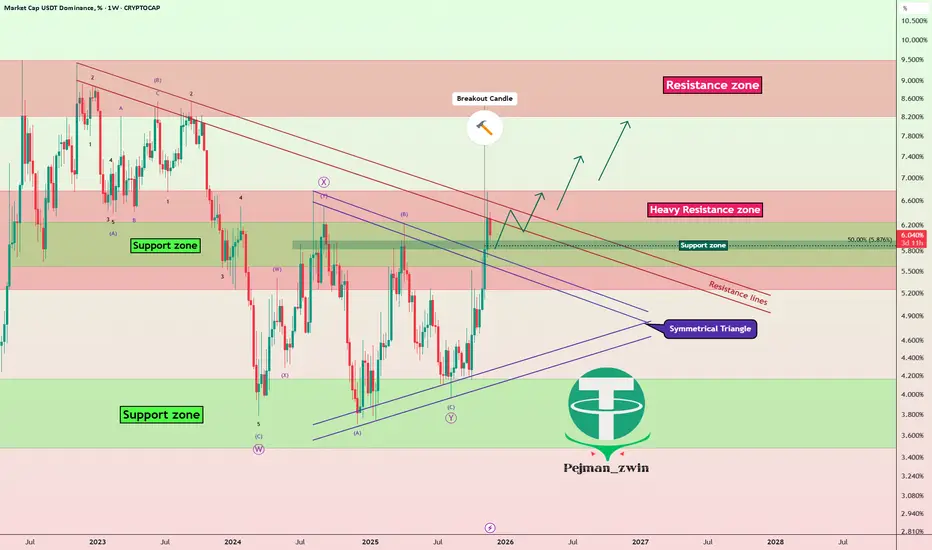
USDT Dominance% Breakout: Crypto Correction Not Over?Today, I’m going to analyze Market Cap USDT Dominance%( CRYPTOCAP:USDT.D ) on the weekly timeframe for you. The reason I want to analyze USDT.D% is that the crypto market conditions have become a bit complex lately, and many factors are influencing it. Therefore, it’s better to take a look at the weekly chart of USDT.D%.
Currently, it seems that USDT.D% is in the vicinity of a Heavy Resistance zone(6.78%-5.25%), but at the same time, there’s also a Support zone(6.24%-5.57%) that could potentially lead to an increase in USDT.D%.
From a classical technical analysis perspective, we can clearly see on the weekly chart that the upper lines of the symmetrical triangle have been broken, and it seems that USDT.D% is currently pulling back to those upper lines. As long as it doesn’t move below those lines again, we can still expect that the market correction is ongoing and hasn’t ended yet. This is a sign that helps us gauge whether the crypto market correction is complete or still ongoing.
From an Elliott Wave perspective, with the breakout of the symmetrical triangle, it seems that USDT.D% might be starting a new impulsive wave.
Since we’re not seeing Regular Divergence(RD-) at the highs, it indicates that the recent upward movement in the crypto market, especially Bitcoin’s( BINANCE:BTCUSDT ) recent gains, is still part of the correction phase.
In conclusion, based on the above analysis, I expect USDT.D% to rise again. If USDT.D% breaks through the resistance lines, we can hope that it will also break through the Heavy Resistance zone(6.78%-5.25%), and that would be a negative sign for the crypto market, potentially leading to deeper corrections in the coming weeks.
So, what do you think? Do you believe the crypto market correction is over, or do you think it will continue? That’s a nice question to leave our analysis with.
Stop Loss(SL): 5.49%
💡 Please respect each other's opinions and express agreement or disagreement politely.
📌Market Cap USDT Dominance% Analyze (USDT.D%), Weekly time frame.
🛑 Always set a Stop Loss(SL) for every position you open.
✅ This is just my idea; I’d love to see your thoughts too!
🔥 If you find it helpful, please BOOST this post and share it with your friends.
Gold’s Roadmap: TRZ + Resistance = High-Probability ReversalGold ( OANDA:XAUUSD ) rose to the Resistance zone($4,192 – $4,133) as I expected in the previous idea and reached its target.
Gold is currently moving near the Resistance zone($4,192 – $4,133) and in the Time Reversal Zone(TRZ).
In terms of Elliott Wave theory, it seems that Gold has managed to complete a Double Three Correction(WXY) in the ascending channel during the 7 trading days.
I expect Gold to start falling after the Resistance zone($4,192 – $4,133).
First Target: $4,077
Second Target: $4,037
Stop Loss(SL): $4,195(Worst)
Points may shift as the market evolves
---------------------------------------------------------------------------
In the upcoming hours, the U.S. will release a batch of key economic indicators: Core PPI, PPI, Core Retail Sales, and Retail Sales. These prints directly influence inflation expectations and the interest-rate outlook, which makes gold particularly sensitive today.
My personal outlook on Gold:
If the data comes in hotter than expected, Treasury yields may rise , and the dollar could strengthen, putting short-term downward pressure on gold.
If the data comes in softer than expected, markets may quickly price in lower inflation pressure and a more dovish Fed path. This scenario typically gives gold a strong short-term upside push, especially if PPI and Core PPI print below estimates.
Overall, with the current structure, the market reaction in the first 15–30 minutes after the release matters more than the numbers themselves. Monitoring volatility and price behavior right after the release will help determine the day’s dominant direction.
---------------------------------------------------------------------------
Ukraine appears to have agreed to the terms of the peace agreement.
Why does this kind of news usually push Gold lower?
Gold acts as a safe-haven during periods of war, geopolitical tension, and uncertainty.
When credible news of peace emerges, the demand for safe-haven assets declines → lowering gold demand.
Global risk sentiment improves, and capital flows toward risk-on assets such as equities, stronger currencies, and yield-bearing markets.
If a peace agreement reduces tensions around energy or oil markets, inflationary pressure eases → making gold less attractive.
---------------------------------------------------------------------------
💡 Please respect each other's opinions and express agreement or disagreement politely.
📌 Gold Analyze (XAUUSD), 1-hour time frame.
🛑 Always set a Stop Loss(SL) for every position you open.
✅ This is just my idea; I’d love to see your thoughts too!
🔥 If you find it helpful, please BOOST this post and share it with your friends.

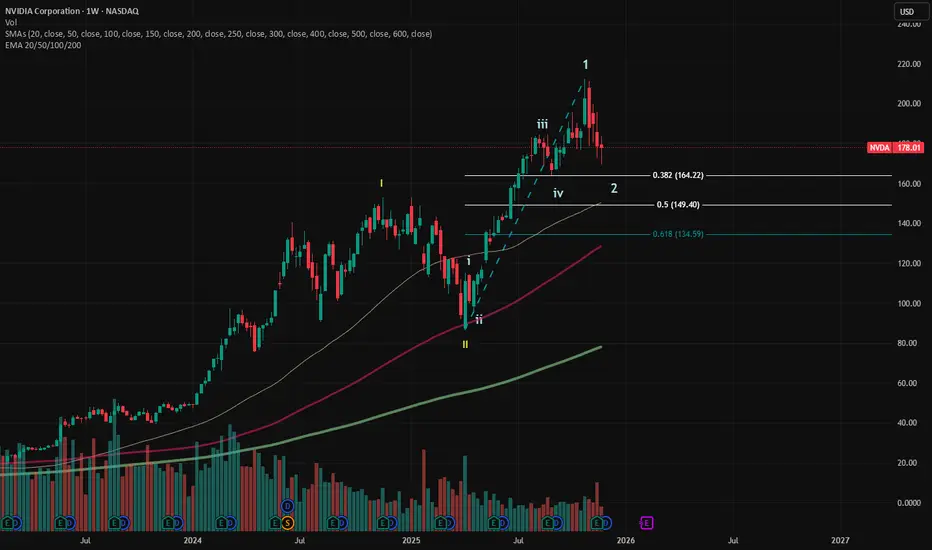
$NVDA: Wave 2 correction in placeNASDAQ:NVDA : I'm long term bullish on NVDA. I count the current weakness as a Wave 2 correction. Wave 2 can correct deeply. Presently, it has not corrected 38.2% yet.
I have a long term NVDA position that accounts for 2.7% of my portfolio. If it drops to 38.2% retracement area, I'll add. If not, I'm happy with holding my current position.
Currently, I'm 8% in cash.
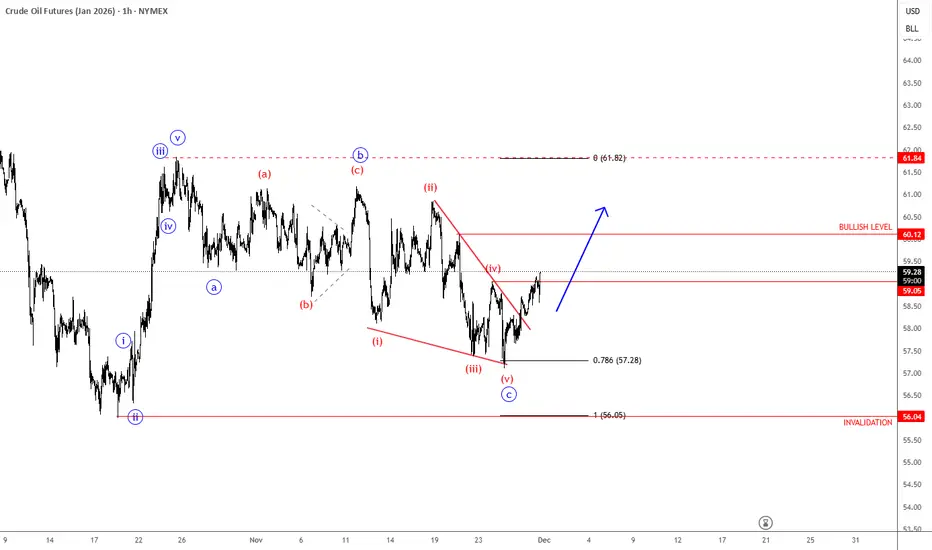
Crude Oil Has Finally Finished An Intraday Corrective SetbackCrude oil made a very strong rebound back in mid-October with an impulsive move of more than 11%, while the current retracement from 62 is very slow, which still suggests a counter-trend movement despite the weakness now retesting the 78.6% support levels. We can still see three waves down, and ideally subwave c is coming into a potential support zone, so a rebound can still happen while the market trades above 55.96 invalidation.
Looks like Crude oil is finally on the way back to October highs, as we see a sharp and impulsive rebound from the 78,6% Fibonacci retracement after a completed wedge pattern. So be aware of more intraday gians, especially if breaks back above 60 level, just watch out for pullbacks.
XAU — M30 (28/11/2025) | Short on StrengthBias: Bearish
• From the 4173.48 high, price retraced in a Contracting Triangle pattern, completing purple wave 4 at 4151.56.
• Price then pushed higher into purple wave 5, reaching a new high at 4193.15. The structure suggests that wave 5 may have already completed.
• The market is showing signs of weakening, favoring a continuation to the downside in the upcoming swings.
🎯 Primary Trading Scenario
🔹 Look for Short opportunities, especially upon rejection at resistance zones or clear reversal signals on LTF.
❌ Invalidation
Price breaking above 4193.15 → requires a wave recount.
🧠 Trade Tip
Enter only with confirmed price-action; keep stops tight and maintain strict risk management.
“Stay disciplined — wait patiently for your true edge to appear.”

Enter a short position on gold now
Enter a short position on gold now.
The first target is shown on the chart. CAPITALCOM:GOLD
I have multiple confirmations that the downward move is about to begin, and the probability of success for this trade is very high.
I will provide further updates on the trade later

A gold short trade nowGold Short Trade Executed Based on Current Market Structure; Exit Levels Will Be Determined and Communicated Later According to Price Action Development CAPITALCOM:GOLD

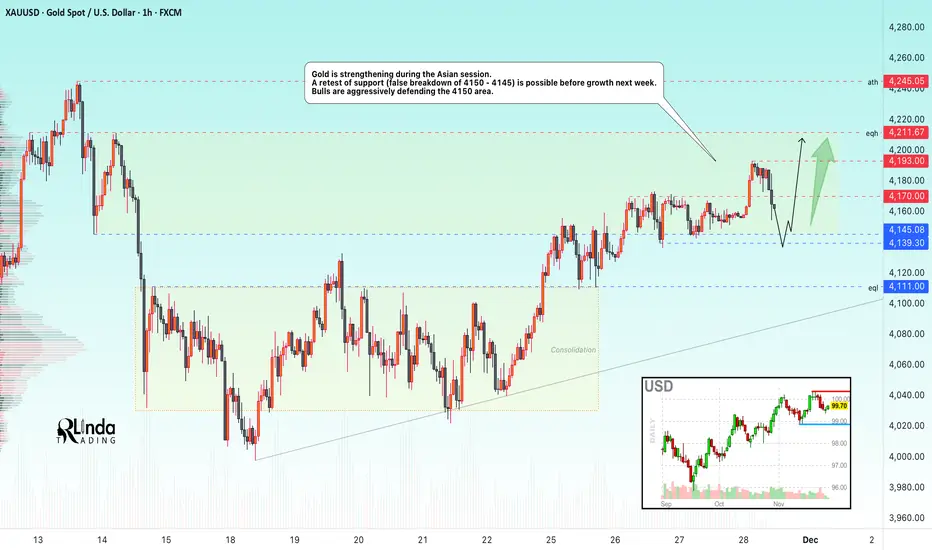
GOLD → Consolidation above 4150 amid a bullish market FX:XAUUSD breaks through 4170 and renews its high to 4193 during the Asian trading session. But further on, the market may consolidate before a possible continuation of growth...
The probability of a Fed rate cut in December remains at 82%. Geopolitical risks (Russia-Ukraine) continue to support demand for safe-haven assets. Weekly growth continues, but consolidation above $4170-4190 is required for the movement to continue.
However, low liquidity is expected on Thursday/Friday due to the holidays in the US. There may not be any strong movement, but volatility could be high during the European/American session...
Focus on the current trading range of 4150-4193...
Resistance levels: 4170, 4193, 4211
Support levels: 4150, 4145, 4139
The market is bullish both globally and locally. Accordingly, within the current trading range, gold may form a long squeeze relative to support and the liquidity zone at 4150. If the fundamental background does not change over the weekend, growth may continue next week...
Best regards, R. Linda!
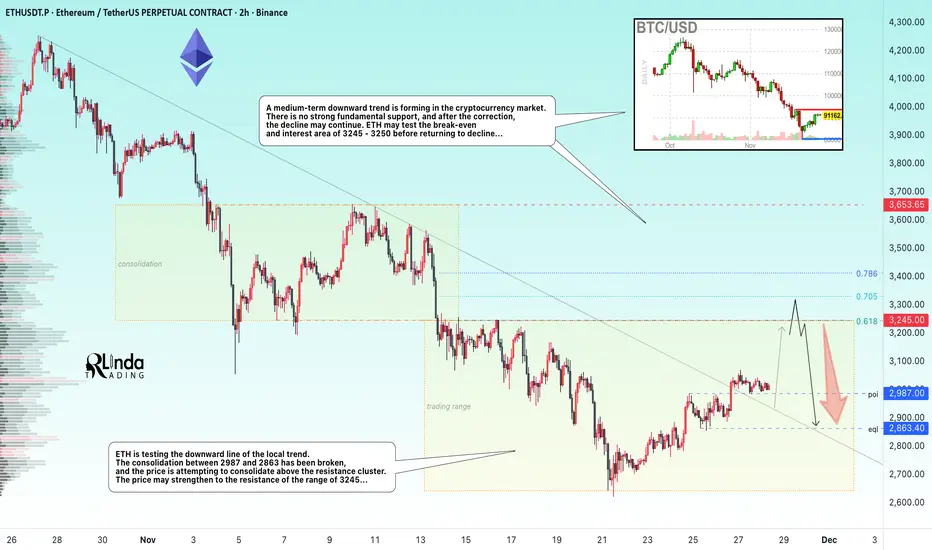
ETHEREUM → Countertrend correction. The hunt for liquidity BINANCE:ETHUSDT is testing the downward trend line and attempting to break through the resistance conglomerate. Overall, against the backdrop of low liquidity, the market has the opportunity to test 3245...
Against the backdrop of low liquidity and without the presence of the American side in trading, ETH is testing the downward line of the local trend. A medium-term downtrend is forming in the cryptocurrency market. There is no strong fundamental support, and after the correction, the decline may continue. Any attempts at growth at this point can be seen as an opportunity to sell profitably...
A breakout is forming and an attempt is being made to keep the price in the long zone. If the bulls keep the price above 2897 after retesting support, the price is likely to strengthen to the resistance range of 3245... However, a false breakout (liquidity capture) of key resistance may remind the market of the relevance of the downward trend...
Resistance levels: 3000, 3245
Support levels: 2987, 2863
I expect two movements. If the price stays above 2987 (after retesting), then Ethereum will be able to retest the resistance of the range. A false breakout of the resistance range could trigger a price decline within the global downtrend that has been developing for 3 months...
Best regards, R. Linda!
GOLD → Consolidation above the support level of the new rangeFX:XAUUSD is consolidating above 4150 but within the distribution phase after breaking through consolidation. The upward price movement is supported by the weakening of the dollar...
The metal remains on track for a fourth month of growth thanks to expectations of further Fed rate cuts and geopolitical tensions.
Despite strong US data, markets are still pricing in a 76-85% probability of a rate cut in December. The dollar is weakening, although yields are rising slightly.
Against the backdrop of the holiday week in the US, volatility may decrease and gold may consolidate. Talks about a possible peace between Russia and Ukraine could reduce demand for safe-haven assets, but the overall backdrop remains favorable for XAU/USD growth.
Resistance levels: 4170, 4211
Support levels: 4146, 4139
Gold is consolidating above the key support zone of 4140-4146. A long squeeze could trigger a shift in market imbalance in favor of buyers. If the bulls keep the price above 4150, this could trigger further growth, a breakout of 4170, and a retest of 4211.
Best regards, R. Linda!

EURUSD → Formation of an intermediate bottom...FX:EURUSD is forming a consolidation, which hints at a halt in the downward correction. The market is waiting for news that could trigger strong movements...
The dollar is pausing and moving into consolidation. If the index enters a correction phase, the euro will go up. A breakout of 1.155 could confirm a change in the local trend and trigger a rally.
The price is trading within a downward price channel; locally, the market is not ready to update the low and is consolidating above 1.150 and 0.7f. Accordingly, the focus is on the current consolidation: 1.150 - 1.155
Resistance levels: 1.155, 1.1606
Support levels: 1.1524, 1.1502, 1.1473
The price is currently consolidating, which means that the market is preparing for possible movements. A breakout of one or another boundary could trigger a rally. A breakout of resistance will confirm a change in the local trend. However, a breakout of support could trigger a continued decline to 1.1473.
Best regards, R. Linda!

#Banknifty directions and levels for Nov 27th:Current view:
If the market shows a gradual pullback and faces rejection near the resistance zone, we can expect at least a 23% to 38% retracement of the recent minor swing. This view also applies if the market starts the day with a decline.
Alternate view:
If the market opens with a strong bullish candle and breaks the immediate resistance, we can expect the rally to extend further. The same logic applies if the market first consolidates near the resistance zone and then breaks above it after that consolidation; in that case, a further strong rally is also likely

#Nifty directions and levels for Nov 27th:Good morning, friends! 🌞
Here are the market directions and levels for Nov 27th:
The global market (based on the Dow Jones) has shown a moderately bullish sentiment,
while the local market is also displaying a moderately bullish tone. Yesterday, the Dow Jones continued its pullback.
However, GIFT Nifty indicates a neutral to slightly positive opening.
What can we expect today?
The structure suggests a continuation of the rally.
So, if the market starts with a strong bullish candle structure, we can expect a further long rally.
On the other hand, if it starts with gradual movement and faces rejection near the immediate resistance,
we can expect a 23% to 38% correction in the minor swing.
Let’s look at the chart:
Current view:
If the market shows a gradual pullback and faces rejection near the resistance zone, we can expect at least a 23% to 38% retracement of the recent minor swing. This view also applies if the market starts the day with a decline.
Alternate view:
If the market opens with a strong bullish candle and breaks the immediate resistance, we can expect the rally to extend further. The same logic applies if the market first consolidates near the resistance zone and then breaks above it after that consolidation; in that case, a further strong rally is also likely.

CVNA - Obvious but not so obvious because it's very obvious Every trader knows CVNA is Sh#t Co but not much success shorting it for many of us.
Probably this may work now if broader market corrects here.
Short Entry anywhere between 380-350
Target 1 - 280
Target 2 - 250
Stop loss - 385
Prefer to options spreads or credit spreads rather than puts.
Confluences -
-Below anchored VWAP
-Below 50 EMA
-Volume gap below 320 upto 250
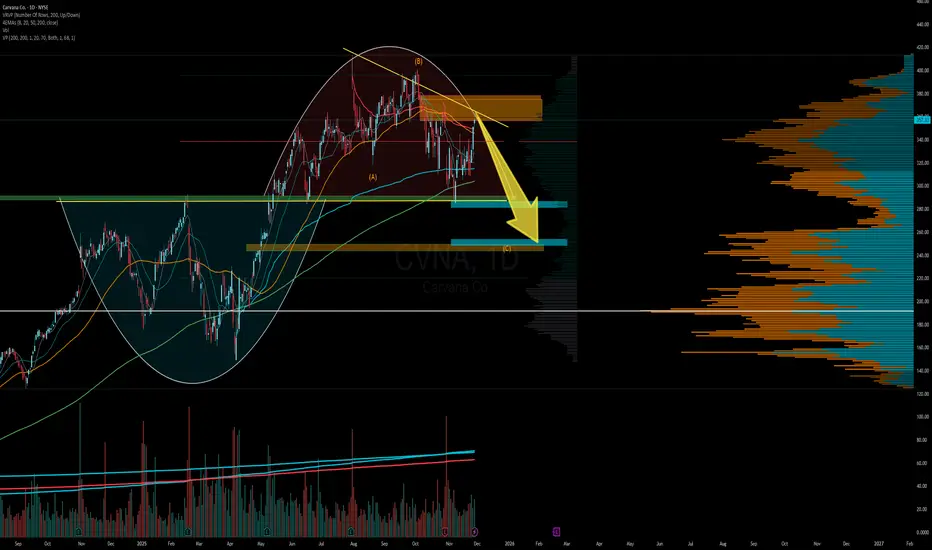
You don't see that everyday 3 triangles -beautiful to watch. I think this is a continuation of the main trend up ,it's latter stages of the rally so very short term indeed.

XTZ: Historical Support#XTZ has been a leading old coin few years ago. After a long decline from its late 2021 top, it continues to hold above a key historical support level.
As long as it stays above the $0.317 stop-loss, a strong bullish comeback remains possible.
#Tezos

BOBA: New ATL, New Opportunity#BOBA has been in a bearish trend for four years, now sitting at new ATL levels. As a mid-low market cap token, investing at this stage carries high risk. A confirmed reversal pattern is needed before a confident buy opportunity emerges.
However, with a historical zigzag pattern potentially completed, the future could still be bright for #Boba.
#BobaNetwork

BTCUSD - Wave 5 Decline Still Likely AheadPrevious Analysis:
BTC is approaching a critical reaction zone where the current rise looks more like a corrective push than the start of a new trend. Price is moving toward the highlighted supply region, which aligns with a potential wave 4 completion inside the descending channel. The structure from the recent low shows an internal a–b–c formation, suggesting this bounce could run into exhaustion as it enters the red zone. Unless BTC breaks out of the channel with conviction, the broader momentum still leans bearish. A rejection from this region would likely trigger the final wave 5 leg, driving price toward deeper Fibonacci levels and completing the corrective cycle before any meaningful recovery attempt can begin.
Stay Tuned!
@Money_Dictators
