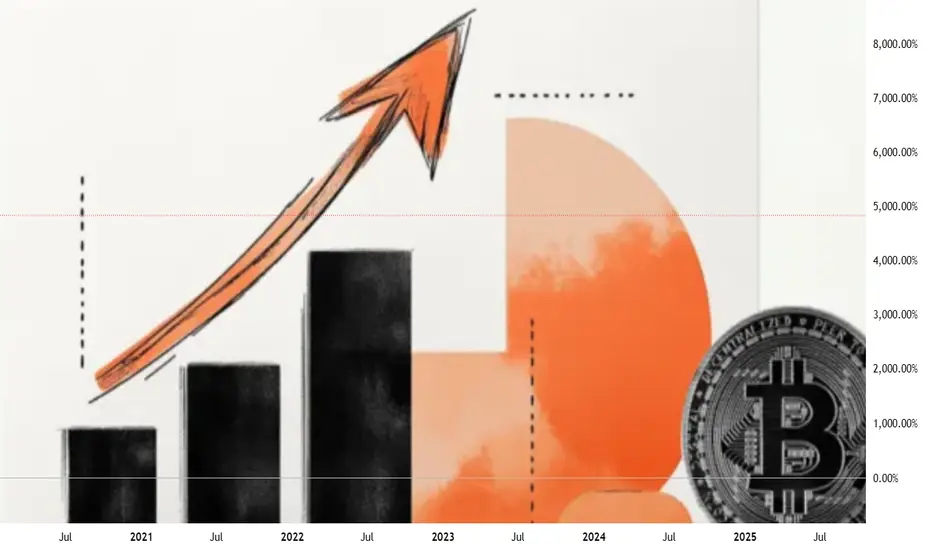
Will EU go up this time?Hi traders,
Last week EU started with a gap down and dropped to take the lower liquidity.
Next week we could see price come into the lower Daily FVG and reverse from there. It still looks like that the downmove is corrective and this pair goes up one more time to finish a big ending diagonal into the Weekly FVG.
Let's see what the market does and react.
Trade idea: Wait for price come into the Daily FVG and reverse. After an impulse wave up and a correction down, look for a change in orderflow to bullish on a lower time frame to trade longs.
If you want to learn more about trading with FVG's, liquidity sweeps and Elliott wavecount and patterns, then make sure to follow me.
This shared post is only my point of view on what could be the next move in this pair based on my technical analysis.
Don't be emotional, just trade your plan!
Eduwave
Elliott Wave

A map of PepeusdtA right and left shoulder is made + head + Elyot waves analysis. This is a corrective rise and not a motive .. The movement
It is expected to land on the area specified below in the coming weeks
*In principle, I am not a supporter of any direction, but I am only giving my point of view, which may be right or wrong. If the analysis helps you, then this is for you. If you do not like this analysis, there is no problem. Just ignore it. My goal is to spread the benefit. I am not one of the founders of the currency.

HBAR Reversal time?My long-term golden pocket target has finally been reached leaving a long lower wick behind as demand soaked up the drop. Price is likely to retrace into the middle of the wick and find its final support if the move was truly the wave 2 bottom!
If we go lower the ‘alt-coin golden pocket’, 0.786, sits at the major High Volume Node support and would be a great buy as well as a good spot to look out for longs.
Weekly RSI has room to fall but bullish divergence is forming!
Wave 3 has a minimum expected target of $0.65 aligning with targets from the standard deviation bands above. Wave 5 has a minimum target of $0.75
Safe trading

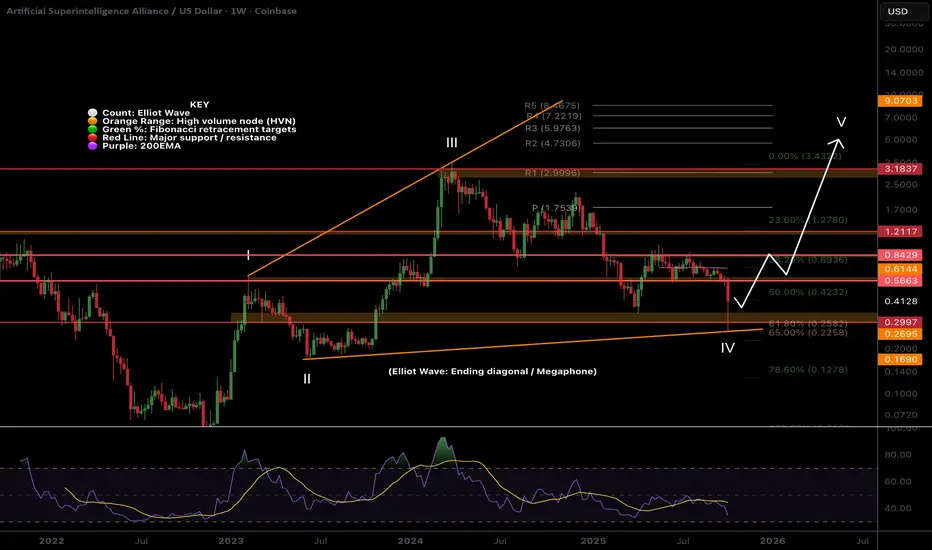
FET extreme opportunity zone!NYSE:FET wave IV megaphone pattern is still in play despite the lower low and is invalidated only if we get blow wave II at $0.1685. This is a complex Elliot wave structure where investors and traders get trapped easily!
Weekly RSI now has bullish divergence forming but is not yet confirmed. Price found support at the major High Volume Node and Fibonacci Golden Pocket, a high probability reversal area!
Wave V has an expected target of the R2 weekly pivot at $4.73 but can over-extend in an exuberant market conditions.
Fetch had one of the largest runs last year offering a 56x from a swing below the SD-3 green opportunity band zone. When an asset moves with such momentum to the SD+3 threshold (where it is expected to spend <1% of the time) momentum is found in the opposite direction and gives way to extreme undervaluation! This is were we strike!
Price has now reached the opportunity green band zone once more quickly catching a bid of 20% as of writing. Price is expected to spend <5% of the time in this zone offering investors a short window of opportunity. It can go lower of course but there is a good chance a bottom is formed in this area! I intend to buy here and I am looking out for longs which give me larger position size than buy and hold due to the nature of the risk management.
Price targets for fair value, where we expect price to return to at least, is currently at $0.60. Another irrational alt-season with backed momentum could see a new all time high towards the $5 range and I will take profits at each band threshold along the way!
DKNG Update | Crash AheadOne of the best fractal overlays I've seen with some Elliott Waves to go with it.
Price is still in a uptrend but with growing sellers It'll come to an end similar to the last fractal.
During the 3rd wave in the last pattern price experienced its first pullback at (B), and its second at correction wave 4 and the third after the last wave before we witnessed the last push in buyers.
This current cycle price is in a similar stage with a swing low at (b) meaning that we could see another run-up towards major resistance ($63).
This would be the final blow-off-top in general markets. TVC:RUT is already showing signs of weakness which works well with this TA example.
When the time is right I'll do another TA for the downfall. For now I'm bullish but for the horizon I'm very bearish.

Relief Rally or Further Drop? Key Levels to Watch on ARBUSDTARBUSDT continues its descent after invalidating the macro rising wedge, with price action firmly suppressed below key supply zones. Current wave structure hints at a potential relief rally toward 0.3886 before resuming the broader bearish trajectory toward the projected drop target at 0.1718. Until the macro descending trendline at 0.6259 is decisively broken, bearish sentiment remains dominant.

Silver Bullet/Rocket Schedule. 11/Oct/25XAGUSD rocket launching might failed again on 3rd attempt at 56 +/- latitude on early 2026..before successfully shooting to outer space

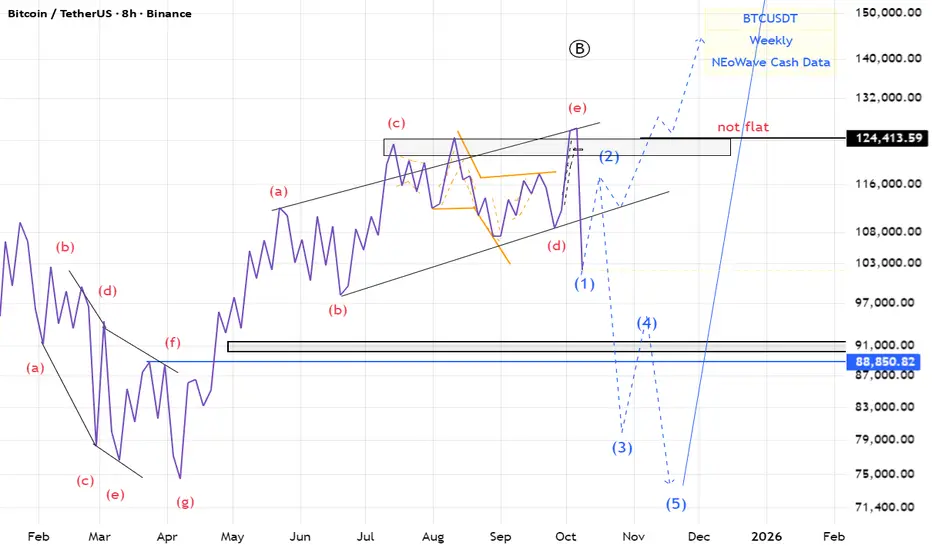
BTC(based on NEo wave)there is a good possibility for the irregular flat.
I think 2-3 month we will see the red market
Primary targetsAVAX has a perfect book structure. Tonight, wave 2 reached its bottom, perfectly in line with the norms. According to mathematical statistics, wave 3 could reach ~2400 in January 2027. Wave 5 may end near 6800.
What is the most difficult thing about investing?
- Doing nothing.
:) Have a fat profits!

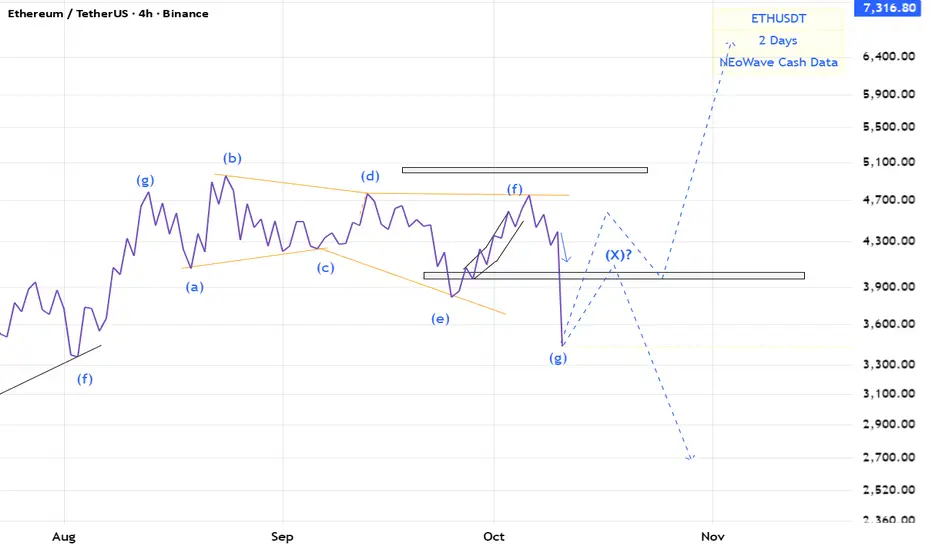
ETH(based on NEo wave)stop loss touched and now there are 2 ways for eth.
we need a post pattern confirmation for bullish wave.
or there is an x wave an correction stills go on.
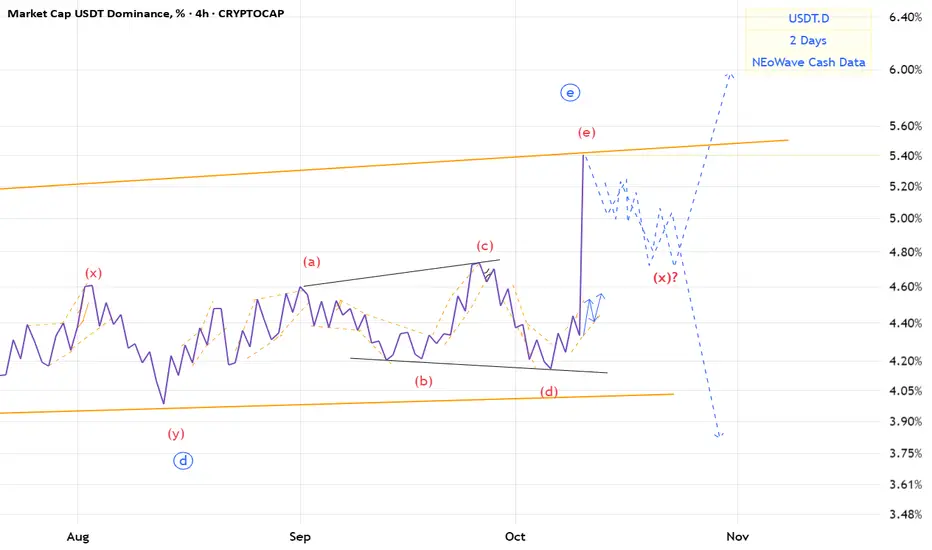
USDT.D(based on NEo wave)The e wave that I wanted made a descending triangle.
we should wait for it becouse it may make an x wave or a post pattern.
BITCOIN'S FALL HAS BEGUN ! DON'T GET CAUGHT UP IN THE BLOODBATH JPowel's rate cut hints that something bad is about to happen. All Fed Rate cuts have been marked by devastating market crash and this time will be no different. Don't lose your hard-earned money to the upcoming carsh !! You have been warned.
Disclaimer: Not financial advice.

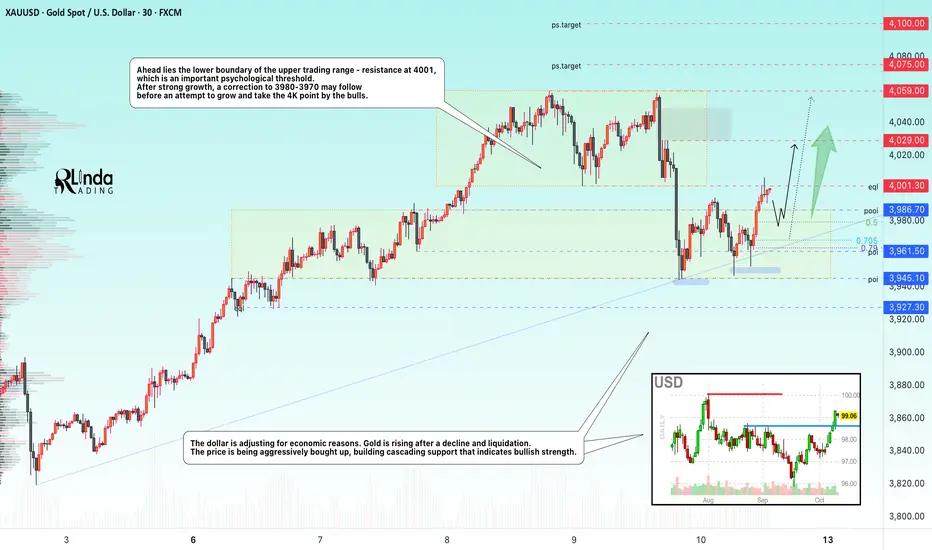
GOLD → Retest 4000. Pullback before a breakout and rise to 4100?FX:XAUUSD , after a sharp sell-off and testing of the 3950 support zone, is aiming to return to the $4000 level on Friday, preparing for its eighth consecutive week in positive territory.
The Senate adjourned for the weekend until Tuesday, postponing a decision on the shutdown. John Williams supported further rate cuts, Mary Daly confirmed her readiness for cuts, despite the fact that Powell did not say anything particularly interesting about policy on Thursday.
The upward trend in gold remains unchanged. The potential for growth to new highs remains, provided the shutdown continues and the Fed maintains its soft policy. The $4000 level remains a key psychological support.
Resistance levels: 4000, 4059, 4075
Support levels: 3986, 3980, 3968
The 4000 zone may prove to be strong resistance, so expect a battle (consolidation or trading range in this zone), during which the price may form a pullback to 3980-3970 before returning to 4K for a breakout attempt.
Best regards, R. Linda!
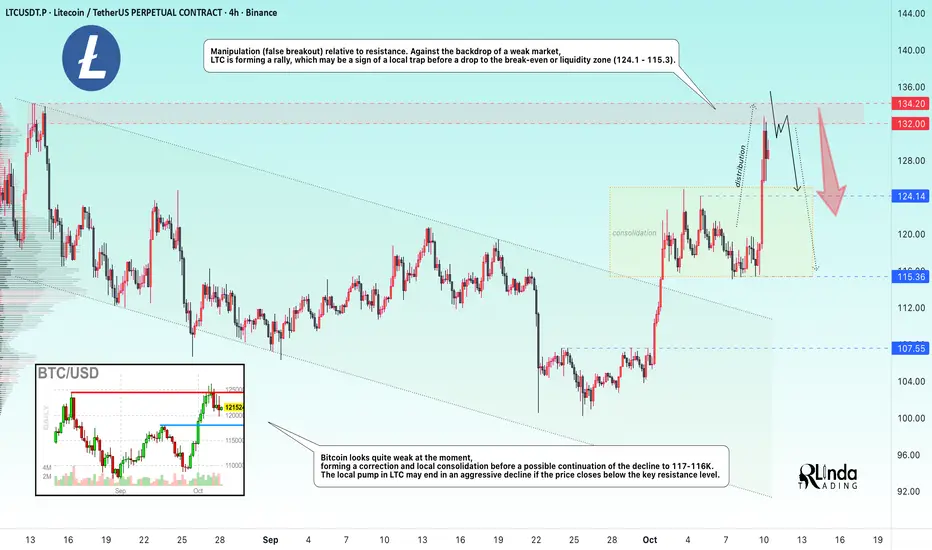
LTCUSDT → False breakout of resistance...BINANCE:LTCUSDT is forming a distribution pattern after local consolidation. The price is testing the resistance zone and forming a false breakout, but there is a but. The cryptocurrency market is in correction...
Bitcoin looks quite weak at the moment, forming a correction and local consolidation before a possible continuation of the decline to 117-116K. The local pump in LTC may end in an aggressive decline if the price closes below the key resistance level.
Manipulation (false breakout) relative to resistance. Against the backdrop of a weak market, LTC is forming a rally, which may be a sign of a local trap before a drop to the break-even or liquidity zone (124.1 - 115.3).
Resistance levels: 132.0, 134.2
Support levels: 124.14, 115.36
A false breakout of resistance, while the entire altcoin market is declining, looks like a hunt for liquidity before catching up with the main market. Accordingly, confirmation of a false breakout of the resistance zone could trigger a drop in LTC.
Sincerely, R. Linda!
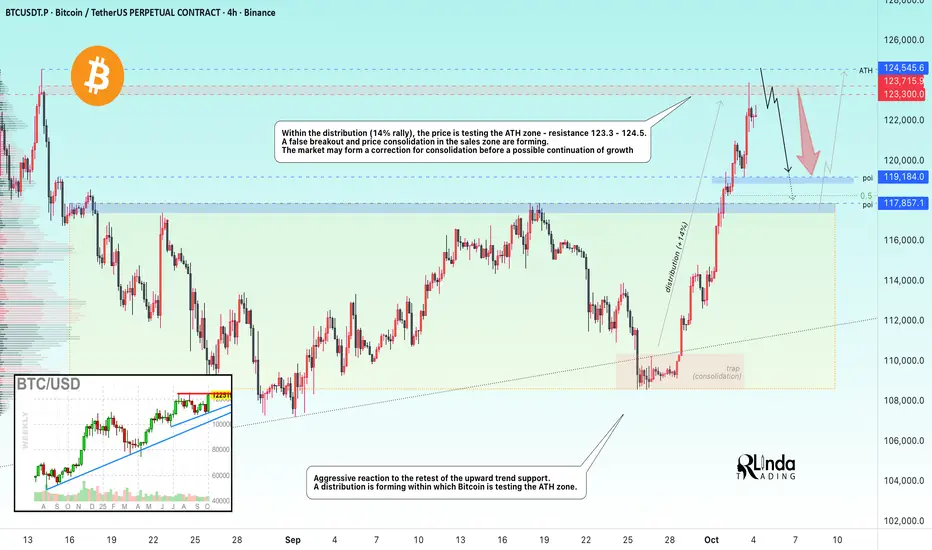
BITCOIN → False breakout of the all-time high zoneBINANCE:BTCUSDT is rising amid the US government shutdown and testing the all-time high zone and resistance at 123.3K - 123.7K. A false breakout has formed and the market is moving into local consolidation.
The price is reacting aggressively to the retest of the uptrend support. A rally is forming, and Bitcoin is testing the ATH zone. As part of the distribution (14% rally), the price reaches an important resistance zone, behind which lies a liquidity pool - 123.3K - 124.5K. However, the growth ends with a false breakout and subsequent price consolidation in the sales zone. To break through such a strong zone, the market needs significant consolidation, which is currently lacking, and the news that caused the price to grow so strongly has already partially exhausted its potential. Thus, the market may move into consolidation, correction to accumulate potential, or wait for the next bullish driver.
Resistance levels: 123.3K, 123.7K, 124.5K
Support levels: 119.2K, 117.8K
I do not rule out the possibility of a retest of 123.7 - 124.5, but technically, on Friday, the market began a sell-off (profit-taking), forming a sufficiently long shadow on the daily candlestick. In the medium term, I expect a correction to the local break-even and imbalance zone of 119K - 117K before another attempt at growth is made
Best regards, R. Linda!
BTCUSD still looking higherLooks like we are in the ending part of wave 5 in a larger ending contracting diagonal pattern. I'd like to see $128,556 hit to complete the 5th wave ( wave 1 largest, wave 3 smaller and wave 5 still smaller). Then a sharp turn down to the 1.618 of the shown fib at $85K approaching 1st quarter next year and a corrective pattern afterwards bouncing $85K to $128K

ETHUSD: Reversal Expected Near 4100The bullish outlook remains unchanged. We are expecting the price to reverse near 4100 . The sharp move on wave a, a small correction for wave b, indicates a sharp decline and rapid rise in the upcoming days.
Previous research:
Stay Tuned!
@money_dictators
Thanks :)

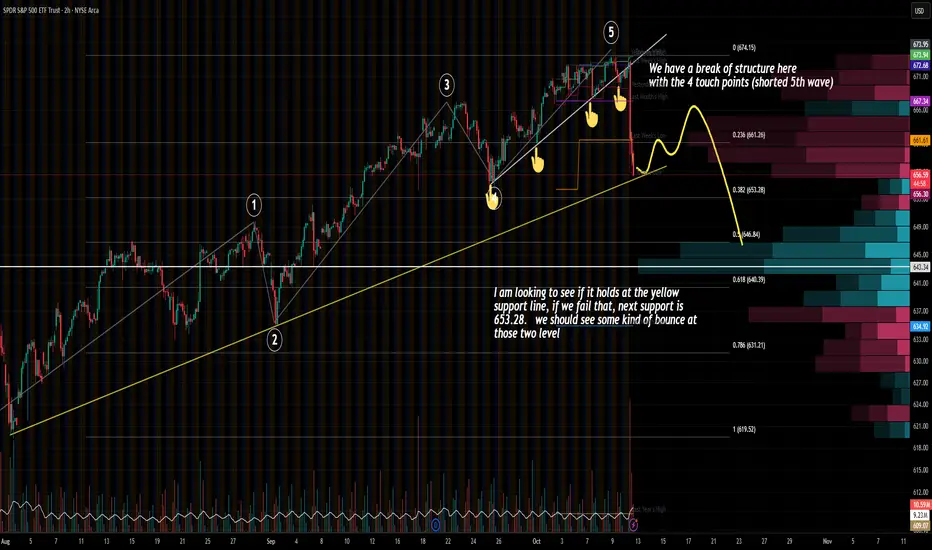
SPY potential bounce target (Fib / Trend Line)What a morning we had, I wish I would have caught the entire wave down, I did not expect a drop like this to happen, I was only able to capture maybe 20% of the drop in my short. Overall not a bad day. Usually after a drop we look to re-enter for a long. In order to avoid catching a falling knife, we are looking to break down out entry for long into 2.
1st Entry, right at the yellow support line, around 655.xx to 656
We would like to see a bounce then retest the yellow line and entry on the 2nd bounce.
2nd Entry would be at the Fib Level 0.382
I use E-wave pattern as a reference + fib retrace/ext to gauge most of my entry.
My biggest fear with this trade is that the pattern that I am expecting to happen end up finishing in ES before the market open on Monday.
So instead of buying 2 weeks out contract, I am going to buy calls closer to 4 weeks expiration in case I am wrong or ES movement on Sunday and I ended up missed out the entire structure.
TL:DR
Enter 1st long at $655.xx
If we dropped below $655
2nd Long is at 0382 FIB / $683.22
I will probably stop out if it dip below 0.5 FIB
I am not ruling out the possibility that we will go down further than 683.22 and head to 0.5 Fib or even 0.618 Fib.
As always trade with caution, always have a stop loss to prevent blowing up account.
Cryptoc Price Prediction: BTC, ADA & Crypto – European WrapIn the European trading session, the cryptocurrency market displays mixed dynamics, with Bitcoin (BTC) stabilizing near $124,000 after a recent all-time high of $126,199. Cardano (ADA) trades around $0.81, approaching $0.90 amid bullish on-chain activity, while broader crypto trends show cautious optimism. This wrap analyzes price action, key drivers, and short-term predictions for BTC and ADA, alongside European market influences like MiCA regulations. Position for potential rebounds with data-driven insights.
Bitcoin (BTC) Price Prediction: Holding $124,000, Eyeing $130,000
Bitcoin trades at $124,000, up 0.8% from the session open, recovering from a 2% mid-week dip. Strong US ETF inflows of $757 million—the highest in recent months—absorb selling pressure, with BlackRock’s IBIT leading at $366 million daily. On-chain data shows whale accumulation up 15%, with net realized profit/loss (NRPL) at 3.48 million ADA equivalent, indicating reduced profit-taking.
RSI at 57 signals neutral-bullish momentum, with a bullish MACD crossover (+0.15) targeting $130,000 (5% upside). Fibonacci support at $120,000, resistance at $127,000. MiCA’s stablecoin rules boost BTC on-ramps, correlating 0.8 with Nasdaq. Prediction: $123,500–$128,500 today, average $126,000. Bull case: $150,000 by year-end on ETF growth; bear case: $115,000 on FOMC surprises.
Cardano (ADA) Price Prediction: $0.81 Support, Targeting $0.90
Cardano (ADA) at $0.81 is down 1% daily but up 7% weekly, reclaiming $0.80 after a 3.26% pullback. On-chain NRPL dropped to 3.48 million ADA from 13.98 million, signaling declining profit-taking and rising retail demand. Derivatives show a 1.15 long-to-short ratio, with whales extending buys.
RSI at 58 (bullish) and MACD (+0.12) target $0.90 (11% upside). Fibonacci support at $0.72, resistance at $0.85. MiCA compliance enhances ADA’s cross-border appeal, with 20M active wallets. Prediction: $0.79–$0.85 today, average $0.82. Outlook: $1.00 soon on network upgrades; risks: 5–7% dip on altcoin fatigue.
Broader Crypto European Wrap: Altcoin Rotation and MiCA Impact
The European session saw altcoin rotation, with Ethereum (ETH) up 3.5% to $4,613 on $1.3B ETF inflows, and Solana (SOL) at $181.76 (+3.6% weekly) amid TPS upgrades. MiCA’s stablecoin licensing stabilizes USDT/EUR pairs, correlating 0.7 with Nasdaq. Sentiment is 71% bullish, with $10B monthly crypto betting volume. Risks: U.S. shutdown delays 90 ETF approvals, freezing $10B inflows, potentially causing 2–3% dips. On-chain: whale activity +15%, volume +20%.
Trading Signals: RSI and MACD
Based on recent trends:
BTC ($124,000): RSI at 57. Bullish MACD (+0.15)—target $130,000 (5%). Support $120,000, resistance $127,000.
ADA ($0.81): RSI at 58. Bullish MACD (+0.12)—target $0.90 (11%). Support $0.72, resistance $0.85.
Overall: RSI 57–58 signals buys on dips for 5–11% gains. Risks: ETF delays (2–3% dip); hedge with USDC.
Conclusion: Seize European Crypto Opportunities
BTC at $126,000 average and ADA at $0.82 signal strength, with MiCA driving altcoin rotation. RSI 57–58 and bullish MACD suggest 5–11% upside—buy dips for breakout gains.
What’s your crypto pick? Comment below!
#BitcoinPrice #CardanoPrice #CryptoPrediction #EuropeanWrap #TradingSignals
Bitcoin BTC Bullish Setup📈 CRYPTO:BTCUSD reached the equal legs area $118588 - $117260 and it's expected to rally from there looking for new highs next week or bounce in 3 waves at least.
#Elliottwave #Trading

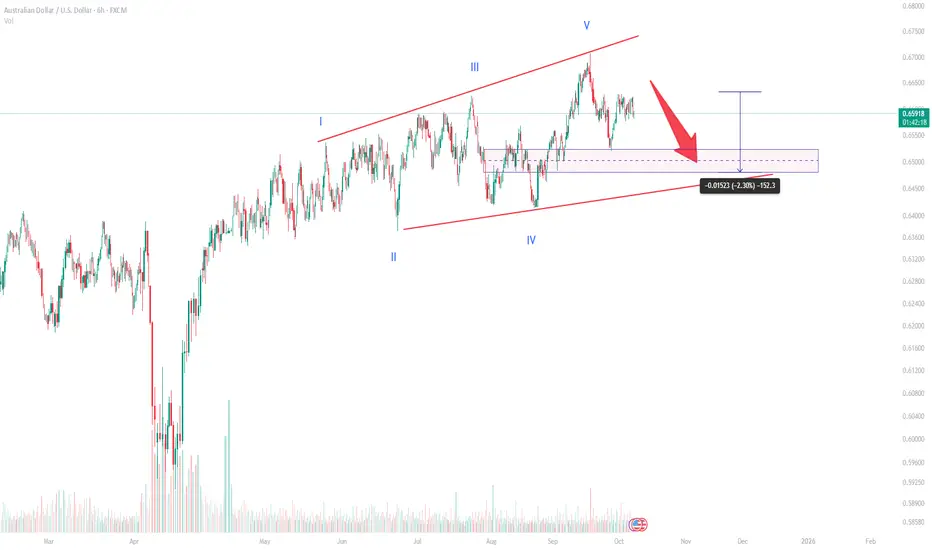
Rising Diagonal Pattern Near CompletionAUD/USD Elliott Wave Analysis – Rising Diagonal Pattern Near Completion
Overview
The AUD/USD pair has formed a clear ending diagonal pattern, signaling potential exhaustion of the current bullish trend. This structure, often seen at the final stage of an impulse wave, suggests that a corrective phase may soon follow. The diagonal appears complete with all five internal waves labeled (I-V), indicating that the market might be preparing for a deeper pullback.
Technical Analysis
According to the Elliott Wave structure visible on the 6-hour chart, AUD/USD completed its fifth and final wave near the 0.67 region. The wedge pattern is now narrowing, with bearish divergence hinting at weakening bullish momentum.
Wave Structure:
Wave I started the diagonal formation, initiating the rising trend.
Waves II and IV acted as corrections, forming higher lows.
Wave V extended slightly but failed to make a strong breakout, suggesting exhaustion.
The price currently trades near 0.6560, with a potential retracement zone between 0.6450 and 0.6500. This range coincides with a strong demand zone and the lower boundary of the diagonal pattern. A pullback into this area could complete the corrective (A)-(B)-(C) structure before the next major directional move.
Key Levels
Support Zone: 0.6450 – 0.6500
Immediate Resistance: 0.6650 – 0.6680
Breakout Confirmation: A sustained break below 0.6450 could confirm the end of the diagonal and open the door toward 0.63 in the medium term.
Invalidation: A breakout above 0.67 would invalidate the bearish correction scenario.
Market Outlook
The diagonal’s completion suggests that the pair may enter a short-term correction phase. However, traders should monitor price action near the support area before confirming the next trend direction. If buyers defend the 0.6450 zone, a rebound toward 0.6650 is likely. Conversely, a clear break below the wedge would strengthen bearish momentum.
Given the overall wave count, the market is likely in transition between an impulsive and a corrective phase. Patience is crucial at this stage, as the next few sessions will determine whether the larger uptrend resumes or a deeper retracement unfolds.
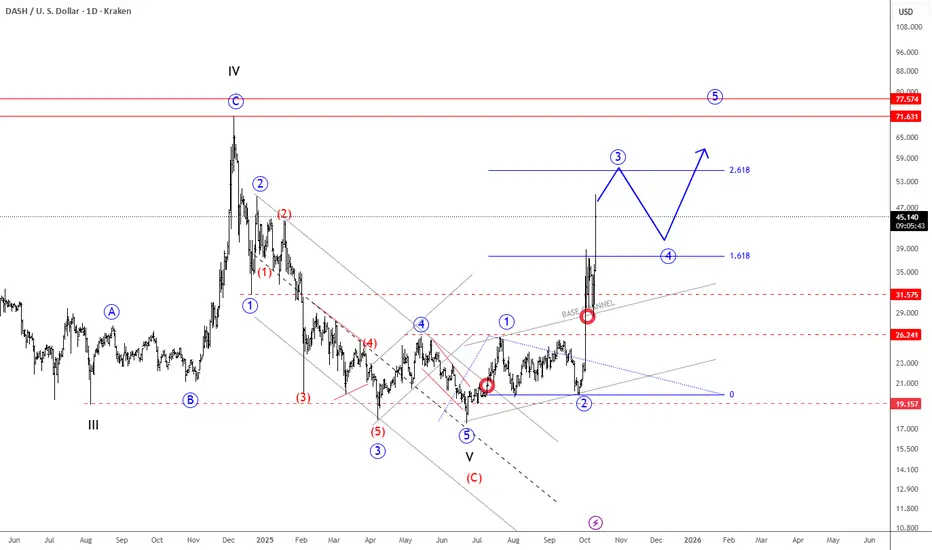
Dash Is Waking Up Strongly As AnticipatedWe talked about the bottom formation on Dash back on August 11, where we mentioned and highlighted that it's recovering from June lows out of the downtrend channel, which suggested that the impulsive decline from the 2024 highs has ended.
Dash is now in a massive rally, waking up strongly, so it's most likely in wave 3 of a five-wave bullish impulse that can extend the price even up to 70 area, we will just have to be aware of wave 4 pullback around 50-55 area. ALTseason can be here. Can other ALTcoins follow soon?
Dash is a cryptocurrency launched in 2014 that focuses on fast, low-cost payments and privacy. It uses a two-tier network with miners and “masternodes” to enable features like InstantSend (near-instant transactions) and PrivateSend (optional privacy). It started as a fork of Bitcoin.
BTC/USD ANALYSISBitcoin is currently sitting in a strong demand zone, a beautiful area that could trigger a new ATH (All-Time High).
According to my analysis, we’re now in the final wave of wave 5 in the Elliott Wave structure.
This phase could mark the end of the bullish cycle, with one last strong push to a new high before a major correction takes place.
🎯 Likely scenario:
Short to mid-term bullish continuation
New ATH possible from this zone
Then a significant drop once wave 5 completes
🕰️ Patience and risk management — the last wave often traps the market.
