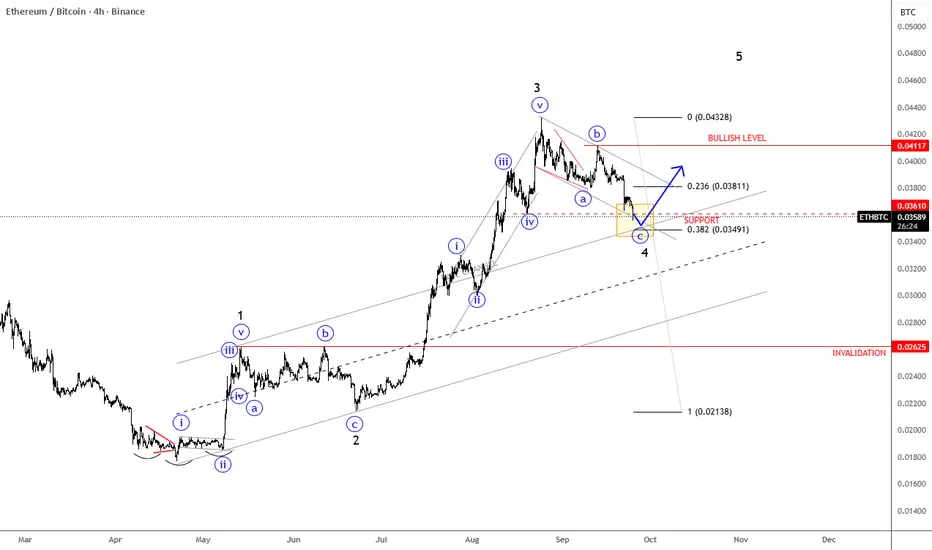
ETHBTC Has A TextBook Bullish PatternETHBTC Has A TextBook Bullish Pattern, as we see an ongoing five-wave bullish impulse by Elliott Wave model
ETHBTC pair is slowed down after a massive extension higher into wave 3, and it's right now testing important 0.035 - 0.034 support zone within an abc correction for wave 4. It's also trading at an important 38,2% Fibonacci retracement and base channel upper line, which can act as a strong support. So soon watch out for a bullish continuation within wave 5, especially if we see a rebound and recovery back above channel resistance line near 0.038 level. Bullish confirmation is above 0.041 level, while the invalidation level is at 0.026.
Elliott Wave
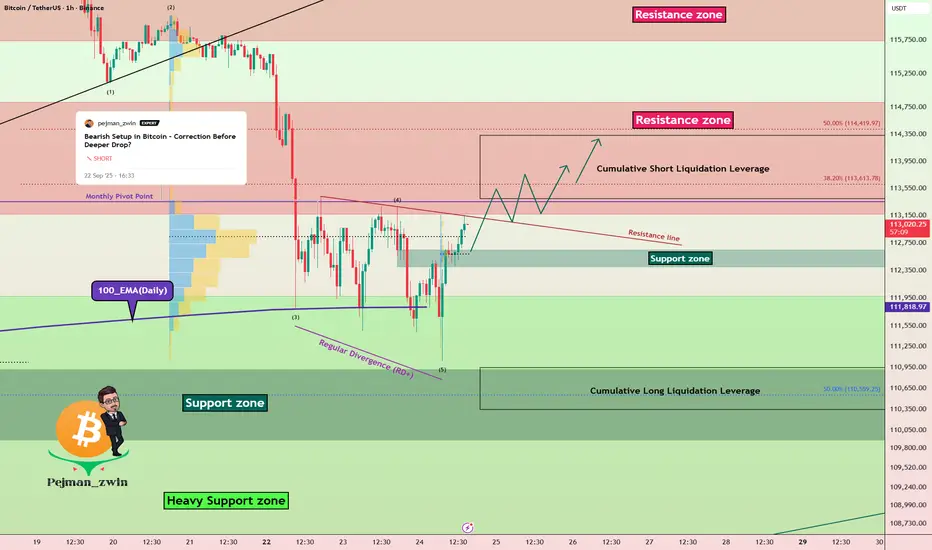
Bitcoin Outlook: From Support Bounce to Short Liquidation TargetBitcoin ( BINANCE:BTCUSDT ) moved as I expected in my previous idea ( Long and Short positions hit their targets ).
Bitcoin is currently moving near the Resistance zone($114,820-$113,170) , Resistance line, and the Monthly Pivot Point , and seems to have failed to break 100_EMA(Daily) .
In terms of Elliott Wave theory , Bitcoin completed wave 5 as I expected by attacking 100_EMA(Daily) and Heavy Support zone($112,000-$105,800) , and we can expect more bullish waves .
I expect Bitcoin to break the Resistance line in the coming hours and attack the Resistance zone ($114,820-$113,170) and the Cumulative Short Liquidation Leverage ($114,334-$113,400) .
Cumulative Long Liquidation Leverage: $110,950-$110,350
Note: If Bitcoin goes above $115,000, we should expect Bitcoin to rise again.
Please respect each other's ideas and express them politely if you agree or disagree.
Bitcoin Analysis (BTCUSDT), 1-hour time frame.
Be sure to follow the updated ideas.
Do not forget to put a Stop loss for your positions (For every position you want to open).
Please follow your strategy and updates; this is just my Idea, and I will gladly see your ideas in this post.
Please do not forget the ✅' like '✅ button 🙏😊 & Share it with your friends; thanks, and Trade safe.
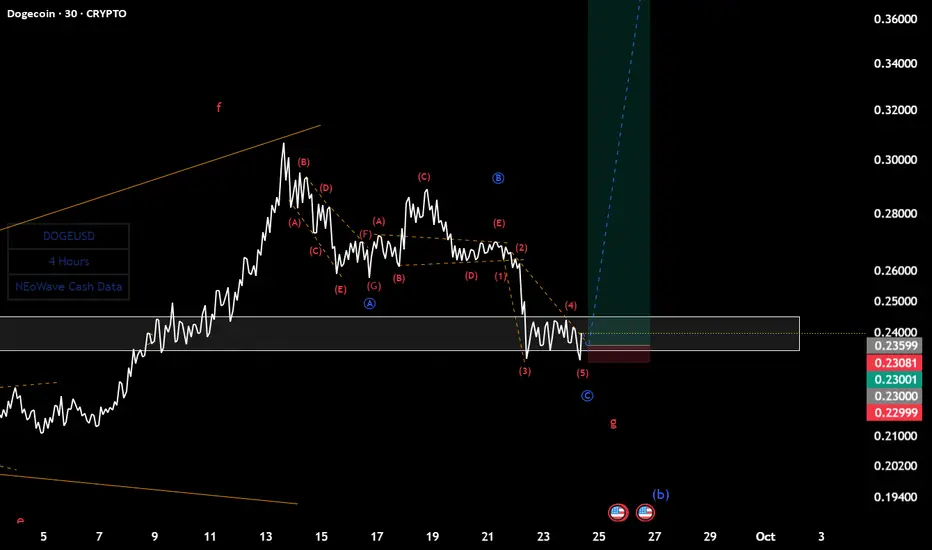
Doge(based on NEo wave)according to last counting of doge, under 0.23$ it means its a bow-tie diametric and it takes about 1 more week for correction.

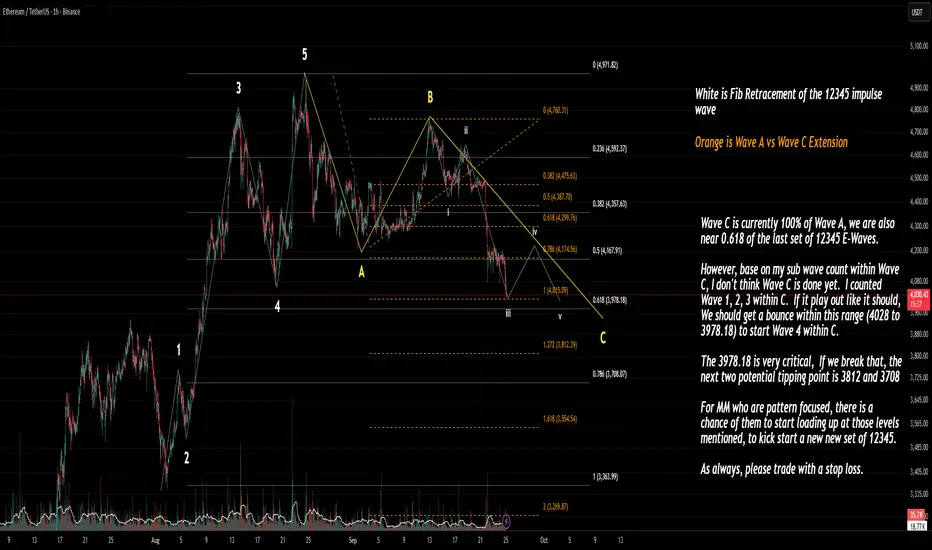
Elliott Wave Ethereum / Fibonacci LevelWave C Progress:
Wave C has already reached 100% of Wave A.
Price is sitting near the 0.618 retracement of the previous 12345 impulse wave.
Subwave Count Inside Wave C:
I have counted Waves 1, 2, 3 inside C.
If this sub-count is correct, a Wave 4 bounce is expected soon in the 4028 – 3978 zone.
Critical Levels
4028 – 3978.18: Expected bounce range (Wave 4 inside C).
3978.18: Key level — breaking it opens the door to deeper downside.
If broken, the next supports are:
3812 (1.272 extension)
3708 (0.786 retracement of entire impulse)
Implications
If 3978 holds, ETH may stage a corrective bounce (Wave 4) before a possible Wave 5 inside C.
If 3978 fails, 3812 and 3708 are the next tipping points where market makers/pattern traders might start accumulating for a new 12345 impulse set.
Watch for a bounce between 4028–3978.
Lose 3978, and 3812/3708 become the big decision zones for the next move.
USDT Dominance Hits Channel Top – Correction Ahead?USDT dominance has reached the top of its channel, completing a potential 5-wave Elliott structure. This suggests that a corrective ABC pattern may follow.
• 🟢 Key Resistance: 4.60% – 4.65%
• 🔻 Expected Correction: toward 4.20% – 4.30%
• 📈 Market Impact: A decline in USDT dominance often means capital flowing back into crypto & altcoins.
If this scenario plays out, we could see altcoins breathing again in the short term.

Gold Possible Scenario - Not Financial AdviseGold is in it's distribution Channel and good enough volatility is expected. Look at the marked lines for possible return and retest.
Please comment ideas and for more accurate chart analysis and trader characteristics development write me back.
Please note this is not financial advise - just educational content.
Thanks

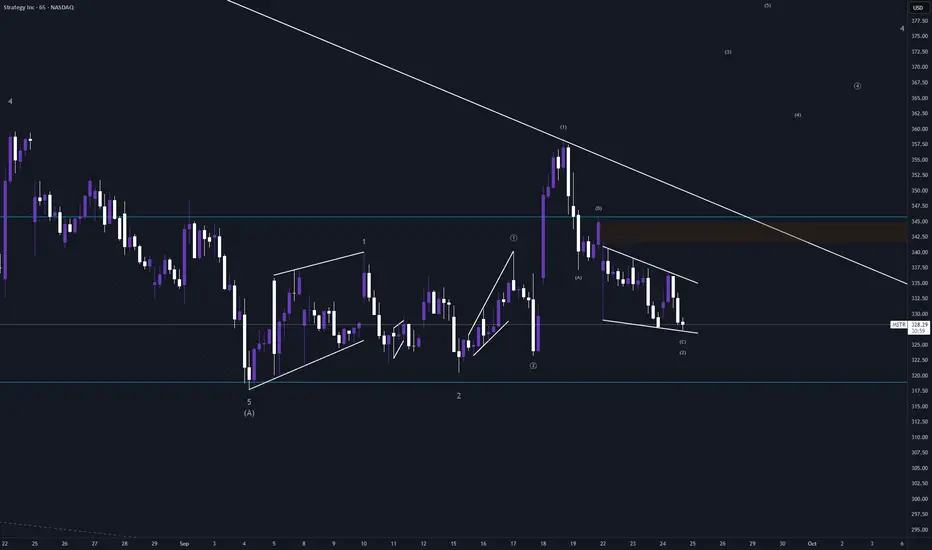
MSTR further winding up with a 1-2 1-2 1-2? Looks like MSTR might have just finished and ending diagonal for another wave c of 2. This could also just be a 1-2 1-2 still but so far counting it as a 1-2 1-2 1-2.
Either way, it looks like it is ready to rip to 380. Will see in the next couple of sessions how this plays out.
BTC Correction targeting 100k?> Bitcoin is showing bearish RSI divergence on the August high, while the recent low shows no divergence, signaling potential weakness in momentum.
> I´m interpreting the current structure as an ABC correction, which may still be unfolding.
> The 100% Fibonacci extension aligns with the key psychological support at $100k, making it a high-probability target if the correction continues.
> The $115k level could act as resistance, setting the stage for further downward legs.

Can Pi Network(PI) Bounce +15% From PRZ?In recent days, Pi Network ( OKX:PIUSDT ) has dropped more than -40% , raising the big question: Is Pi still a project we can rely on, or is momentum fading away?
Main Reasons Behind the Drop:
1-Mass token unlocks in September → Huge increase in supply created heavy selling pressure.
2-Rising exchange reserves → More than 420M now sitting on CEX wallets, a sign of potential sell waves.
3-Fast-track KYC & protocol upgrades → Gave many users access to their tokens, fueling more selling activity.
4-Low liquidity + whale sell-offs → A few large orders accelerated the decline.
The Pi community remains strong, but current supply shocks are outweighing demand. Until the project reaches full exchange listings and sustainable utility, traders should stay cautious and manage risk carefully.
---------------------------------------------------------------
Now let’s take a look at the PI Token chart on the 15-minute time frame .
The PI Token has formed a descending channel over the past day.
From the perspective of Elliott Wave theory , it looks like PI Token is completing a Double Three Correction(WXY) in the descending channel .
I expect PI Token to start rising as it enters or touches the Potential Reversal Zone(PRZ) again and rise to $0.289(+15%) . In general, a break of the upper line of the descending channel is a good sign for the PI token to rise .
Please respect each other's ideas and express them politely if you agree or disagree.
Pi Network Analysis (PIUSDT), 15-minute time frame.
Be sure to follow the updated ideas.
Do not forget to put a Stop loss for your positions (For every position you want to open).
Please follow your strategy and updates; this is just my Idea, and I will gladly see your ideas in this post.
Please do not forget the ✅' like '✅ button 🙏😊 & Share it with your friends; thanks, and Trade safe.

NZDUSD Has Room To Correct LowerNZDUSD is coming lower, dropping quite aggressively from the 0.60 psychological level over the last few days. The weakness started after last week, the Fed decided to cut rates by 25 basis points, but Powell also sounded concerned about inflation and the economy, which triggered some reversal on teh dollar, and alos in stocks yesterday, and slowed risk-on sentiment. As a result, Kiwi could stay under pressure. Looking at the wave structure, it seems price is heading into wave C of a three-wave decline from the July highs, meaning this correction is still unfinished and has room to extend even toward the 0.5700 area, where wave C would equal wave A. Until that support zone is reached, Kiwi is most likely in an unfinished corrective downside cycle.

#GOLD NewforcastOANDA:XAUUSD continues to climb upward channel.
If price holds above 3747, the breakout projection targets the zone above 3800 resistance.
risks:3747 - 3700
3800 My trigger profit - taking and short -term pullbacks.

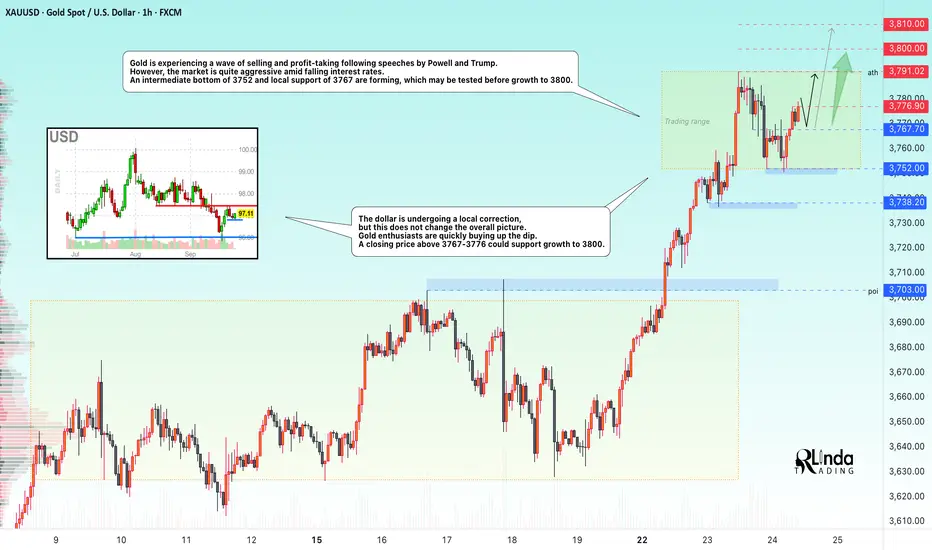
GOLD → Intermediate bottom. Consolidation before growth FX:XAUUSD is being sold off and declining amid profit-taking following speeches by Powell and Trump. However, the market is quite aggressive amid falling interest rates. After forming an interim bottom, the market quickly bought back the decline.
Gold is correcting after record growth, awaiting new signals from Fed representatives and PCE inflation data on Friday. The price remains close to historic highs, but the upward momentum has temporarily slowed, with consolidation forming at 3752-3791.
Key factors : Powell gave no clear hints about future rate cuts, noting the risks of rising inflation and a weakening labor market. The probability of a rate cut in October has risen to 92%, but the Fed's sentiment index is fluctuating somewhat...
The risk of a US government shutdown on October 1 and mixed PMI data are holding back the USD's strengthening.
Technically, gold remains in a bullish trend, but consolidation is possible in the short term. PCE data will be the deciding factor — weak figures will support the metal, while strong figures will trigger a correction.
Resistance levels: 3776.9, 3791, 3800
Support levels: 3767, 3752, 3738
The price is consolidating. Before reaching 3791-3800, there may be a retest of local support. Similarly, a retest of the ATH may also trigger a small pullback of 1/2 of the impulse before a breakout and growth to the specified targets.
Best regards, R. Linda!
Doge(based on NEowave)wave g of diametric shown as a flat and wave 5 of c is finishing the downtrend.
soon we should see a heavy bullish wave.
I think 0.23 is good for stop loss.
DXY ANALYSIS 1H , Trade Idea (For Study Purposes Only)
Sell Zone: 97.45 – 97.60
Target: 97.05 – 97.00
Stop Loss: Above 97.65
RR: ~1:2
---

Bearish Setup in Bitcoin – Correction Before Deeper Drop?Bitcoin ( BINANCE:BTCUSDT ) started to decline and broke the ascending channel and Support zone($114,820-$113,170) with the help of the Bearish Flag Pattern , as I expected in the previous idea update .
Do you think Bitcoin can go below $105,000 !?
Bitcoin is once again approaching 100_EMA(Daily) and the Heavy Support zone($112,000-$105,800) .
From the perspective of Elliott Wave theory , Bitcoin appears to have completed the Zigzag Correction(ABC/5-3-5) in the ascending channel, and now it seems that we should expect bearish waves .
I expect Bitcoin to FAIL to break the 100_EMA(Daily) with one attack and have an upward correction to Fibonacci levels and Cumulative Short Liquidation Leverage($114,098-$113,229) , and then re-attack the Heavy Support zone($112,000-$105,800) and 100_EMA(Daily) .
Cumulative Long Liquidation Leverage: $111,850-$110,421
Note: If Bitcoin goes above $115,000, we should expect Bitcoin to rise again.
Note: There is also a possibility that the SPX500 index( SP:SPX ) will also correct and, given Bitcoin's correlation with this index, cause Bitcoin to correct further.
Please respect each other's ideas and express them politely if you agree or disagree.
Bitcoin Analysis (BTCUSDT), 4-hour time frame.
Be sure to follow the updated ideas.
Do not forget to put a Stop loss for your positions (For every position you want to open).
Please follow your strategy and updates; this is just my Idea, and I will gladly see your ideas in this post.
Please do not forget the ✅' like '✅ button 🙏😊 & Share it with your friends; thanks, and Trade safe.

Gold - Volaatlity phase before Next Drop Down phaseThis is just Educational Chart and Not Signal or Financial Advisory- keep Watchin how the trade is going to play!
Expectation for Asia Market for me is below the PSY Level.

Fly ETH!Wether the correction over or not, ETH is going to ATH. WXY is currently completed, and from this point ETH can go higher and higher. If the market decides it's not over yet it can dive one more level down to 3960 and transwork WXY to ABC.
Be cautios though, don't enter the market w/o stop loss. Bulls let's get control back!!! Fly ETH!!!

MARA Wave III Underway!Local Analysis / Targets / Elliot Wave
MARA appears to have begun wave III with a rally out of the range and above the daily 200EMA. Wave III has a price target of the High Volume Node resistance at $31 but with the current tailwindsI I expect to overextend.
RSI is overbought and there is looming resistance from the wave 1 high just ahead. Traders should be cautious of this resistance and expect a range below for a while.
Standard Deviation Band Analysis
Standard deviation bands shows price coming into the fair value regression line as resistance. A breakout above this will bring up the SD+2 threshold target of $55. Bands offered a great buy opportunity when price dipped into the green opportunity zone at $3.
Safe trading

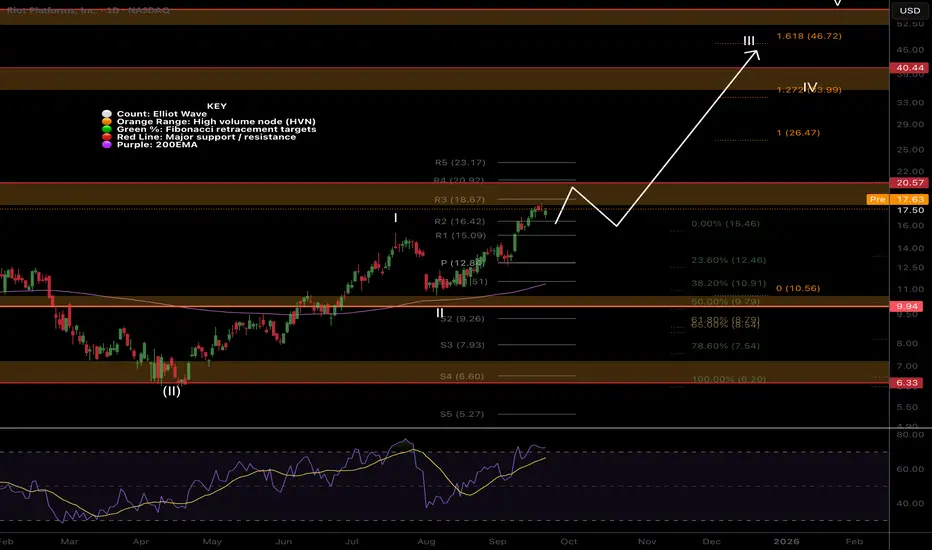
RIOT At First Target!Local Analysis / Targets / Elliot Wave
There was a lot of doubt on TradingView for this breakout but here we are! Price has now come into the High Volume Node resistance after nearly doubling. Wave III appears to be underway with a minimum expected target of $46 per Fibonacci extension tool. Breaking out of the resistance is key for now but once it happens price should move fast.
Standard Deviation Band Analysis
Standard deviation bands show price is only just overcoming its fair value so has plenty of momentum left in it. The SD+2 threshold is the next target at $30.
Safe trading
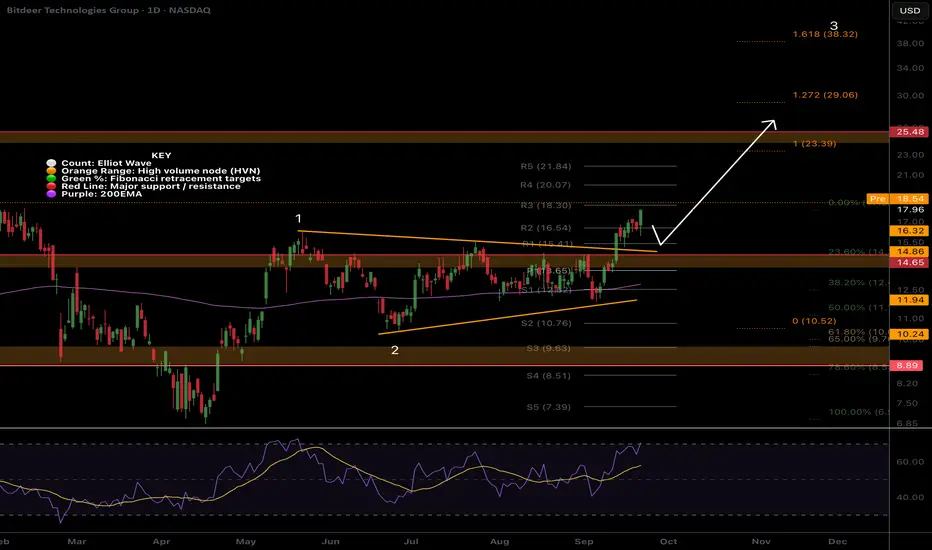
Bitdeer We got the Breakout! BTDRLocal Analysis / Targets / Elliot Wave
NASDAQ:BTDR Price is breaking out aggressively as predicted in previous analysis. We got the push above the descending resistance line. The next target is the $24 all time High Volume Node resistance but wave 3 minimum target is above $30 per the Fibonacci extension tool.
RSI is overbought but with no divergences yet and can remain this way for weeks.
Standard Deviation Band Analysis
Standard deviation bands fair value line was tested as support and price is about to breakout above the SD+3 threshold starting a new trend into price discovery with a $50 target. Traders should still be cautious of a rejection in this area.
Safe trading
CLSK Moving Fast!Local Analysis / Targets / Elliot Wave
CLSK sentiment was awful as I explained a few weeks ago, it appeared to be in a macro triangle similar to XRP before the x10 breakout. That breakout is now underway with a huge move last week characteristic of wave 3 and reinforcing my analysis. Minimum wave 3 targets are well above $20 and price should move quickly once it over comes the triangle resistance it is now approaching at $15.
Price was front run above High Volume Node support and the golden pocket leaving limit orders behind forcing them to buy higher if they want to participate pushing the price up further.
Daily RSI is overbought but so was NASDAQ:IREN and that continued upwards for weeks, as has $WULF.
Standard Deviation Band Analysis
Standard deviation bands remain negatively sloped but I am expecting that to change and price continues upwards. That said, investors should be weary of a reversal in this area where price spends <5% of the time. Bulls are looking for a sustained move into the zone and a breakout above the SD+3 threshold offering a target of $50.
Safe trading

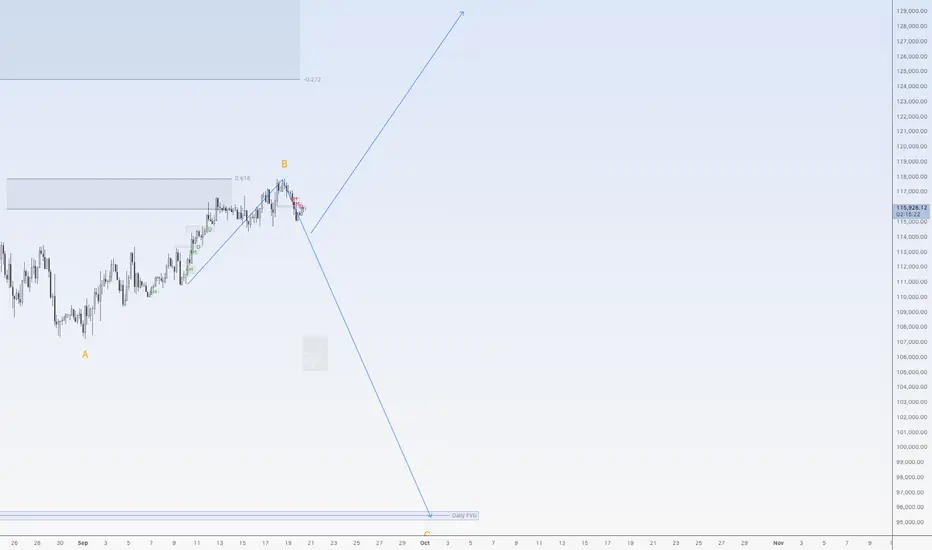
Decision time for BitcoinHi traders,
I show you week after week what price will do.
Last week Bitcoin continued the corrective upmove to the orange B area exactly as I've said in my previous outlook.
Now we could see this pair go down again.
Let's see what the market does and react.
Trade idea: Wait for the small (corrective) upmove to trade shorts. If the upmove is impulsive we could see more upside.
If you want to learn more about trading FVG's with wave analysis, please make sure to follow me.
This shared post is only my point of view on what could be the next move in this pair based on my analysis.
Don't be emotional, just trade your plan!
Eduwave
SUILocal Analysis / Targets / Elliot Wave
Sui attempted to breakout into all time high and was rejected as expected for a wave (1). Wave (2) is underway with an expected first target of the High Volume Node and S1 daily pivot at $2.9, also the 0.382 Fibonacci retracement. Price must get through the daily 200EMA first. Secondary targets is the golden pocket and High Volume Node support at $2.3.
RSI is just below the EQ and crossed bearishly.
Standard Deviation Band Analysis
Price is below the fair value regression line and another thrust lower will see it reach the green opportunity buy zone where it has tested the threshold twice a support. Price was rejected twice when also attempting to breakout above fair value showing supply ready to drop.
Safe trading
