PENGU Upside Targets🎯As long as September low is holding the Pudgy Penguins COINBASE:PENGUUSD is expected to resume the rally higher toward $0.051 - $0.058.
Elliott Wave

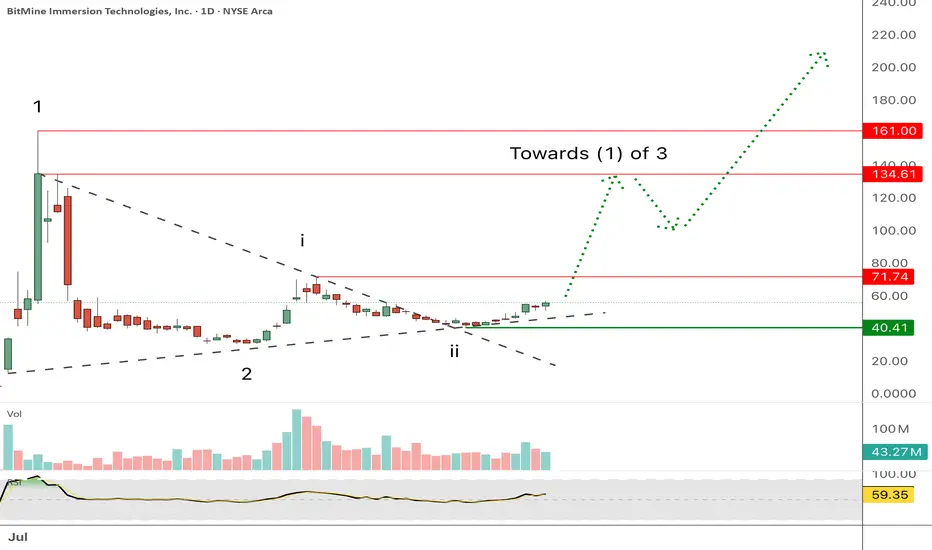
BitMine Immersion Technology looking higherAMEX:BMNR seems ready to resume its uptrend.
This Ethereum holding company lead by Tom Lee and backed by Peter Thiel is betting that Ethereum will be the backbone of the tokenization of the economy in the upcoming AI world.
A break above $71 would open the $134 area as long as support in the $40 region is holding.
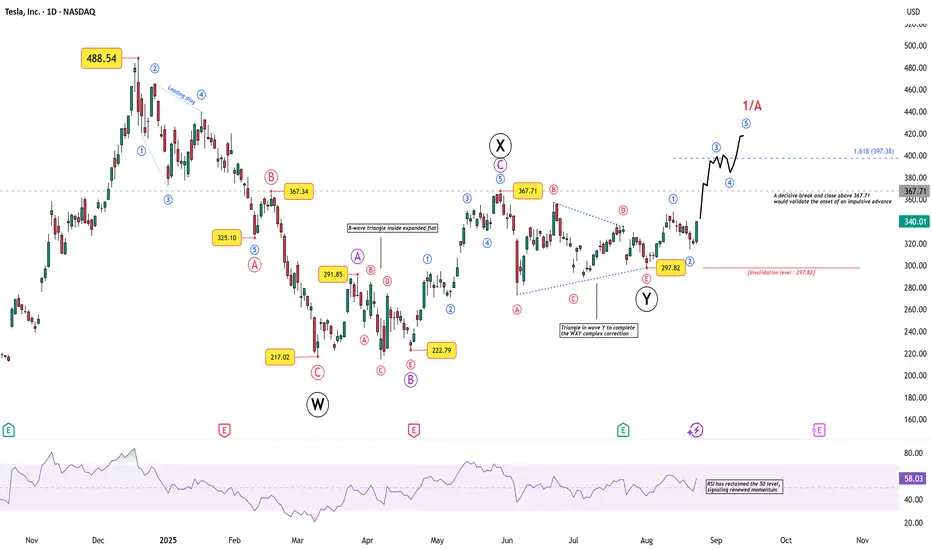
Tesla’s Breakout Test: Impulse or Fakeout?Tesla’s recent price action is stirring interest again, not just for retail traders but also for chart technicians who track Elliott Wave structures across global equities.
After a deep corrective phase that carried price down from 488.54 to 217.02 , Tesla has been carving out a multi-layered corrective structure. Here’s the breakdown:
Wave W completed into 217.02 , marking a sharp low.
This was followed by a complex X wave , which included an expanded flat where the B-wave unfolded as a triangle — a rare but valid corrective formation.
Wave Y then ended with a contracting triangle, neatly completing the W–X–Y correction near 297.82 .
From that point, Tesla appears to have begun an impulsive sequence:
Wave 1 and 2 are already visible, with the 297.82 low as the key invalidation level.
A decisive break and close above 367.71 would confirm the onset of Wave 3, targeting 397.38 (1.618× Wave 1).
Momentum is supporting the structure: RSI has reclaimed the 50 level, hinting at renewed strength.
What Next?
If the count holds, Tesla could be in the early stages of a larger impulsive rally, with Wave 1/A projecting toward the 400–420 zone . However, traders should remember that breaking below 297.82 invalidates the impulsive outlook and revives the broader corrective scenario.
Disclaimer: This analysis is for educational purposes only and does not constitute investment advice. Please do your own research (DYOR) before making any trading decisions.
ELLIOTT WAVE EURUSD Daily update
EW Trade Set Up daily
minute ((i)) seems finished
H4 scenario 210725:
the price upward movement from 1.1557 area on 17/07/25 has broken decisively 1.1684-1.1705 area but it had not the
strenght to go further so that the lagging span (green line) could break upward the leading span B (red line).
A decrescent high has been registered at 1.1800 area on 24/07/25.
In this new scenario it looks like that the impulsive movement that started from 1.0180 on 13/01/25
finisced at 1.1834 on 010725 in the minute wave (i). (EWO divergence, break down of the upward (ii)/(iv) channel).
So i have to register that a correction to minute wave ((ii) has started
key levels VP area
1.1800
1.1370 POC
1.0850
note :
monitor the price reaction at any supports level: VP area and LVN

Nifty Medium term trend - BearishFrom Elliott Wave Perspective Nifty 50 is Identified as FLAT or Complex WXY Pattern is in progress
in either patterns next wave could be towards down side price move,
price could retrace to price target of 21365 in a time period of one to three months

AUDUSD Gains Momentum Ahead of Fed DecisionDollar has been weakening, in particular since August 22nd when Powell spoke at Jackson Hole, acknowledged rising inflation risks, and more importantly, weakening labor data. Back then he signaled that the Fed could adjust rates with a 25 or possibly even a 50 basis point cut this Wednesday.
Looking at FX pairs, what stands out to me is that we are clearly in risk-on mode, with commodity currencies doing very well since late August. Aussie is up almost 4% from the August 22nd lows, while other majors are lagging behind that performance. So it may not be a bad idea to focus on Aussie for potential longs versus the US dollar, especially considering inflation in Australia increased on a yearly basis from 1.9% in June to 2.8% in July, as reported on August 27th. This shows inflation is still a problem in Australia, so the RBA may not be looking to cut rates, which makes AUDUSD attractive on the upside.
From an Elliott Wave perspective, I also like the impulsive characteristics on Aussie from the August 22nd close. In my view, we are still in an incomplete five-wave cycle, with the recent push beyond the July highs being wave three. After the next pullback in wave four, there could be a strong rebound, with the 0.6625 level standing out as attractive support on dips. I’ll certainly keep a close eye on this zone if a retracement occurs.
It’s also worth noting that Aussie is now trying to break the trendline from the 2021 highs, which could be an interesting breakout point and support the recovery, at least until the five-wave cycle completes on the 8-hour chart.
Grega

GOLD (XAUUSD) Wave analysis Update 16/9/2025 (Scenario 2) H4GOLD (XAUUSD) Wave analysis Update 16/9/2025 (Scenario 2) H4
AS SHOWN

GOLD (XAUUSD) Wave analysis Update 16/9/2025 (Scenario 1) H4GOLD (XAUUSD) Wave analysis Update 16/9/2025 (Scenario 1) H4
AS SHOWN

VNINDEX – Ready for C Phase ? (Elliot - Expanded Flat)(This content is analytical in nature and not financial advice)
Based on the long-term chart observation, the market is currently in a corrective phase following the Expanded Flat pattern, consisting of three waves: A-B-C.
- Wave A has completed with a 3-wave structure, representing the first decline after the long-term peak.
- Wave B has now exceeded the peak of wave A – a typical characteristic of the Expanded Flat pattern, where wave B usually retraces between 105% to over 120% of wave A's length.
- Wave C is projected to form next, likely as a strong 5-wave impulsive decline, which may extend over the medium term, potentially driving prices down to deeper support zones (700 – 600 – or lower)

GOLD → Testing 3700. What to expect from the price going forwardFX:XAUUSD continues to rally. Ahead lies the psychological barrier of 3700, where the market may form profit-taking ahead of Tuesday and Wednesday's news...
Gold is testing 3700. The bullish trend remains unshakable thanks to a combination of macroeconomic and geopolitical factors.
Expectations of Fed policy easing: There is a high probability of a 25 bps rate cut (possibly even 50 bps) as early as this week. Trump's pressure on Powell reinforces these expectations.
Stagflation risks: Slowing growth amid steady inflation increases the appeal of gold as a hedge.
Risks: Profit-taking: After a sharp rise, a short-term correction is possible in the psychological target zone of 3700. Retail sales data (today): Weak data will support gold, while strong data may temporarily strengthen the dollar. Fed decision (tomorrow): Even if the rate is lowered, a “sell on the fact” reaction is possible.
Resistance levels: 3700, 3710
Support levels: 3685, 3675, 3657
Technically, since the opening of the session, gold has lost part of its daily ATR, and the upward movement may be zigzag-shaped, especially ahead of the news. I expect a correction from the market to 3685-3675 with the aim of rebounding upwards...
Best regards, R. Linda!

Ripple Finished A Correction Within Bullish TrendRipple Finished A Correction Within Bullish Trend, as we see it recovering in an impulsive fashion, which can extend the rally from technical perspective and by Elliott wave model.
Ripple with ticker XRPUSD is waking up from projected support after an ABC correction in wave IV, so bulls could be back, as we see it breaking above channel resistance line and important 3.08 level. So after current short-term pullback, we may see more gains and another push toward all-time highs for wave V, possibly to the 4-5 area.

GBPJPY → Ascending triangle on an upward trend...FX:GBPJPY is attempting to break through the resistance of the ascending triangle consolidation pattern amid the strengthening of the pound sterling, driven by expectations of interest rate cuts...
The currency pair is breaking through consolidation resistance amid the growth of the pound sterling. The driver is the expectation of positive news...
An attempt to break through resistance is forming, with bulls forming a cascade of support and a local uptrend. If the price closes above 200.27, it will be able to move into a distribution phase.
Resistance levels: 200.27, 200.75
Support levels: 200.06, 199.65
Technically, the chart looks quite strong and aimed at continuing the uptrend. If the bulls can consolidate above the specified level of 200.0 - 200.27, then overall we will see a growth phase. Above the current levels, there is a free zone, and up to 208.0, there are practically no obstacles except for local levels that are not capable of reversing the trend...
Best regards, R. Linda!


GOLD → A s.triangle against the backdrop of a bullish trend... FX:XAUUSD is consolidating in anticipation of positive news from the Fed, namely a cut in interest rates. Against this backdrop, the dollar is falling, which only supports the price of gold...
Gold is trading in a sideways range around $3650 at the start of a week packed with central bank events. Despite the lack of a clear direction, the metal is finding support thanks to several factors.
Key drivers: Weak economic data from China, anticipation of the Fed's decision: On Wednesday, the Fed will almost certainly cut rates by 25 basis points, but there is a chance of 50 basis points. This supports gold.
The tone of Powell's comments will determine expectations for further cuts.
Technically, gold remains stable ahead of key events. China's weak economy and the Fed's dovish policy limit the potential for decline. A break above $3650 is possible with dovish signals from the Fed or an escalation of trade risks.
Resistance levels: 3646, 3657, 3675
Support levels: 3630, 3620, 3600
As part of the formation of a “symmetrical triangle” consolidation, I will consider a retest of the consolidation support with the possibility of further growth (distribution).
Sincerely, R. Linda!

BITCOIN → Consolidation in anticipation of a bullish driver...BINANCE:BTCUSDT is testing the 117K area as part of an upward movement triggered by the end of the bearish correction. The price is moving into consolidation. Focus on the range boundaries...
The market is awaiting the Fed's interest rate meeting. A rate cut could support the growth of the flagship, but before that, the market may form a manipulation in the form of a long squeeze.
The market is forming consolidation after breaking the local correction against the backdrop of a global bullish trend. Focus on the boundaries of the range.
Technically, I would highlight the support of local consolidation and the previously broken trend boundary as two key details that can be used in further trading: 114600, 113300. Behind this zone lies a pool of liquidity, and before a possible rise, the price may try to absorb it... Technically, we are seeing confirmation of a bullish market structure; all that remains is to wait for the appearance of a bullish driver and the market's readiness for growth.
Support levels: 114600, 113300, 110700
Resistance levels: 11700, 117860
A false breakdown of support followed by a close above one of the specified zones could attract buyer interest, which in turn could trigger a price increase within the global bullish trend.
Best regards, R. Linda!

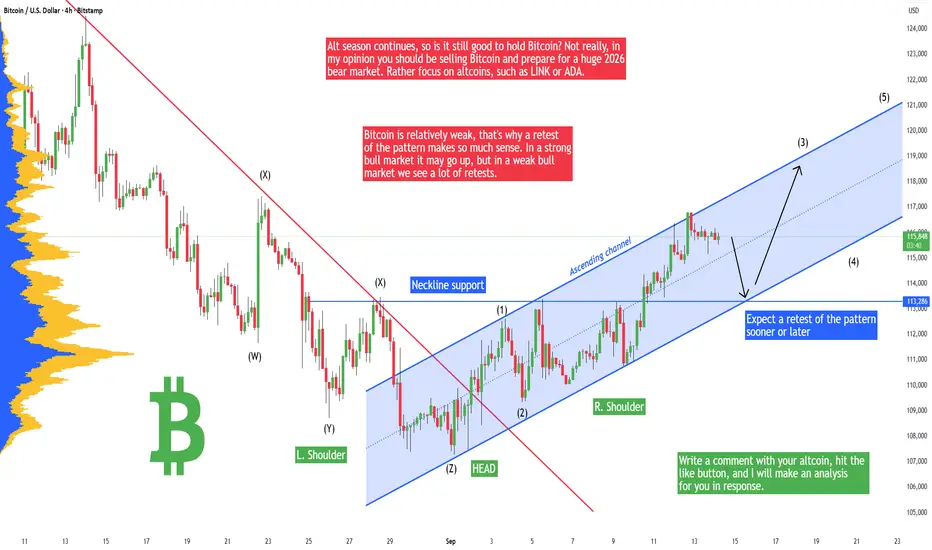
Bitcoin - Must go down to retest this pattern + new ATH soon!Bitcoin recently broke out of the head and shoulders pattern and made a pretty strong uptrend. That's a sign of strength that Bitcoin will be ready to continue in the uptrend and go to a new all time high, but not yet! I still think that Bitcoin should retest the previous Head and Shoulders pattern at around 113,300 USD. It's because this is an important liquidity level and there are a lot of orders from traders, in other words - it's a strong point of interest.
Alt season continues, so is it still good to hold Bitcoin? Not really, in my opinion you should be selling Bitcoin and prepare for a huge 2026 bear market. I expect Bitcoin to go down to 60k - 70k, but this is for another analysis. I really do not recommend buying Bitcoin, rather focus on altcoins, such as LINK or ADA. There is a potential of 50% to 200% profit in the next weeks, this is not possible on Bitcoin!
Bitcoin is relatively weak, that's why a retest of the pattern makes so much sense. In a strong bull market it may go up, but in a weak bull market we see a lot of retests. It's even possible that Bitcoin will go a little bit below the head and shoulders neckline to test the 112k level or so. So be prepared for it!
Write a comment with your altcoin + hit the like button, and I will make an analysis for you in response. Trading is not hard if you have a good coach! This is not a trade setup, as there is no stop-loss or profit target. I share my trades privately. Thank you, and I wish you successful trades!
EURUSD – Wave Analysis OutlookEURUSD is trading near 1.1765, showing a layered corrective structure. Key points and trade implications are summarized below.
Structure – Primary Read (Blue W–X–Y)
Off the lows, price is in a multi-leg corrective advance, forming a blue W–X–Y sequence. The current push higher is likely the X wave completing before a larger decline.
Key Fibonacci levels for the X top: –0.236 = 1.1808, 1.000 = 1.1915, –0.618 = 1.1936.
Momentum: RSI 4H ≈ 69–70, signaling short-term overbought conditions.
Alternate X-wave Detail – Flat vs Running Flat
Depending on the Fed rate: X could be a regular flat or a running flat.
Strong Fed reaction may extend X slightly above the Fibonacci cluster before reversal; muted/dovish reaction likely caps near the cluster.
Price Path
Primary path: rally into 1.1808–1.1936, exhaustion/rejection, then drop into the Y leg.
X-wave can show choppy swings (triangle/flat alternation) before the final top.
Invalidation: sustained break above ~1.1936 shifts outlook to bullish.
Trade Triggers
Bearish triggers: rejection at 1.1808–1.1936, bearish engulfing candle, failure to hold –0.236 (1.1808), or 4H RSI divergence.
Secondary confirmation: break of short-term rising support trendline.
Catalyst: Fed decision. Trade only after technical confirmation, not headline.
Targets
After confirmed rejection, expect multi-leg downside to 1.14–1.13.
Interim supports: 1.165–1.155 for partial reactions.
Invalidation & Bullish Scenario
Invalidation: 4H/daily close above ~1.195 negates the bearish count → reassess for higher targets or extended X-wave.
Risk & Execution Notes
Wait for technical confirmation before shorting.
Place stops above 1.195 cluster if shorting.
Watch for RSI and price divergences for early top clues.
👉 Plan (Bias) : Short-bias: look for rejection from 1.1808–1.1936 or break of short-term support.
Primary downside target: 1.14–1.13.
Invalidation: sustained break above ~1.195.
⚠️ Disclaimer: This outlook is my personal wave analysis and shared for educational purposes only. It is not financial advice. Trading involves risk — always do your own research and manage risk carefully.

GBPAUD – Wave Analysis OutlookGBPAUD has been sliding lower after completing a broad corrective structure from its recent highs. The decline has already pushed into the –0.236 Fibonacci extension (2.0211), which often signals the potential for continuation if momentum holds.
At this stage, I’ll be watching how price behaves around the current consolidation. If price stalls and confirms rejection here, I’ll be looking for short setups, targeting the 1.98 zone as the next major objective.
The larger wave count suggests room for further downside toward deeper Fibonacci projections (1.9567 / 1.9124 levels) if bearish pressure continues. However, a corrective bounce can’t be ruled out before continuation.
👉 Plan: If consolidation holds, I’ll be positioning for shorts into 1.98.
❌ Invalidation: A sustained break back above 2.05 would weaken the bearish case and open the door for a bullish correction higher.
⚠️ Disclaimer: This outlook reflects my personal wave analysis and is for educational purposes only, not financial advice.

Bullish Goldafter breaking 3.668 resistant area with huge candlestick at 1H time frame it means golds continue in long position until 3.738 with Elliot wave pattern shows us step (4) until (5)
.... and what is your ideas? tell us in comments

BTC Elliott wave analysis 9/16 /2025Is Bitcoin’s Cycle Ending, or Just Another Correction?
BTC made a new all-time high last month, followed by significant selling pressure. This raises the question: Has the BTC cycle ended, or is this just another corrective wave before another push higher?
In my view, BTC has already completed its cycle since the bear market ended in November 2022, based on the following factors:
1. Wave Structure Suggests Completion of Wave 5
From my primary scenario, the 5-wave cycle beginning after the November 2022 bear market is as follows:
Cycle Wave I: Nov 21, 2022 – Apr 14, 2023
Cycle Wave II: Apr 14, 2023 – Sep 11, 2023
Cycle Wave III: Sep 11, 2023 – Jan 20, 2025
Cycle Wave IV: Jan 20, 2025 – Apr 9, 2025
Cycle Wave V: Apr 9, 2025 – Aug 14, 2025
Within Cycle Wave V, we can clearly see wave 1 and wave 3 of the initial impulse, followed by a correction (wave 4), and then a final 5-wave sequence. This last push shows signs of exhaustion: although wave ④ (part of wave 5) lasted nearly a month, the market struggled to achieve new highs. This behavior suggests that buying pressure is exhausted and Cycle Wave V may have ended.
2. Post-High Wave Structure
The decline after BTC’s all-time high could be interpreted as the start of a new impulse down, or as part of a complex corrective structure such as WXY or WXYXZ.
We need further confirmation, but one thing is clear: after the upward correction completes, another downward wave should follow, either to complete the correction or as wave 3 of a larger bearish impulse.
Micro Analysis
Based on my Elliott Wave count, it seems BTC has completed wave II or wave b.
This is confirmed not only by Gann fan resistance, but also by the divergence on the abrupt wave 5 in the 4-hour chart, which was followed by a strong downward move. This implies BTC has already entered wave III, or has at least completed its correction.
If this current impulse is indeed wave 3 of a larger downtrend, the target for wave V would be around $81,000, supported by a Crab harmonic pattern projection.

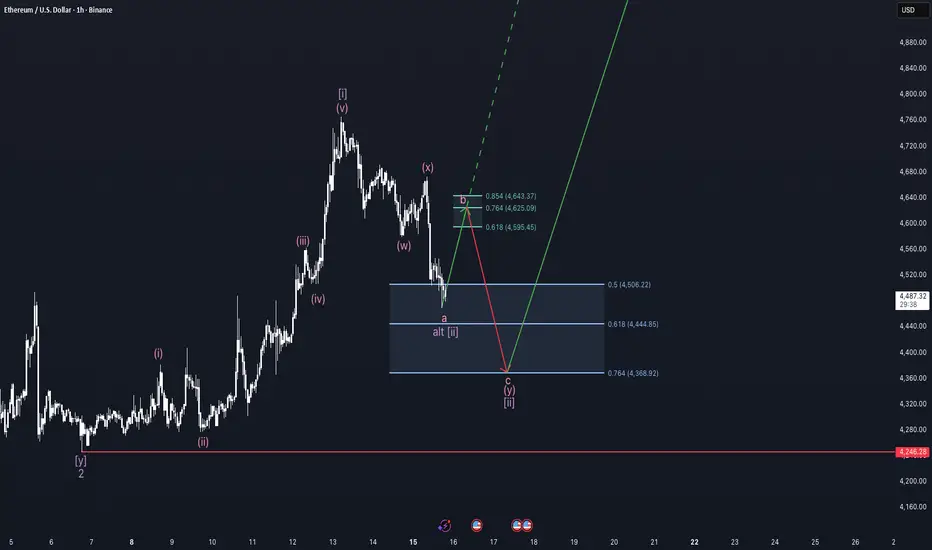
The first step towards 5k - ETH weekly update Sep 15 - 21thDear investors and traders,
Ethereum is currently in the second wave of the minute cycle within the larger third wave unfolding in the minor cycle.Zooming into the fractal structure of the mentioned second wave, we can easily recognize the double three pattern as shown on the chart. My primary expactation therefore is a combination of a flat structure as a minuette wave w and a following zig zag a minuette wave y. I have chosen this scenario, because it's typical for altcoins to retrace their wave two a bit deeper then assets do normally. Also, the flat structure hasn't corrected this second wave too far, making a larger pullback likely. The zig zag probably made his subminuette wave a and should retrace now to levels of around 4.6k. The alternative scenario would be, that this second wave is already completed and with that we would be looking forward to 5k. For the alternative scenario to be completed, we need ETH to climb higher than the previous high of the minuette wave x.
Moving on to the liquidity analysis, we can see why this is my primary scenario: A massive amount of liquidity sitting just above the with the red line shown low of the minor wave two. I think we are going to drop again in the direction of this liquidity, but I hope it is going to melt down as people fear to get liquidated. The drawn in price target surely isn't where the liquidity sits, but it's where most fibonacci levels come together. The Orderbook is relatively empty in nearer space, but there is a large amount of short orders sitting at 5k.
Derivative data shows us turbulent funding rates because of people trying to catch this drop with large leverage market orders and getting liquidated, making the funding rate apparently to come back, maybe because they fear to loose more money now. Open interest stagnates, which is on the one hand positive because there are no more short positions adding up but this also means on the other hand that there are no long positions coming in. One thing I also noted in relation to people trying to catch the drop and burning themselves is that the liquidations are declining, which is indicating the leverage is decreasing.
Coming to exchange flows, the exchanges currently record an inflow of ethereum meaning that people are probably moving their coins from wallets to the exchange to sell them, which is a bearish signal. Also notable is that the exchange reserve is increasing, also indicating that people sell their ethereum.
The seasonality of ethereum shows us that the current Q3 was doing exceptionally well for ethereum and looking forward Q4 is also going to be green with a probability of 60%. September in the past was rather bearish then bullish, flipping the probabilities to a 40% probability to get a positive result. Nonetheless, the average return of September is 7%, which sparks hope.
Looking to Blackrock and other whales and entities, we can clearly see that Blackrock sold a part of it's ethereum (10k ETH) just slightly before the top and not buying again till now indicating the bottom is not in yet. The ETFs is still getting inflows, showing institutions accumulating ethereum.
All in all I am long and I think that the anticipated lows are optimal prices to establish swing long positions. Crucial for a impulsive move and the transition from a minute wave two to a minute wave 3 is the decline of liquidity at the low of the minor wave two.
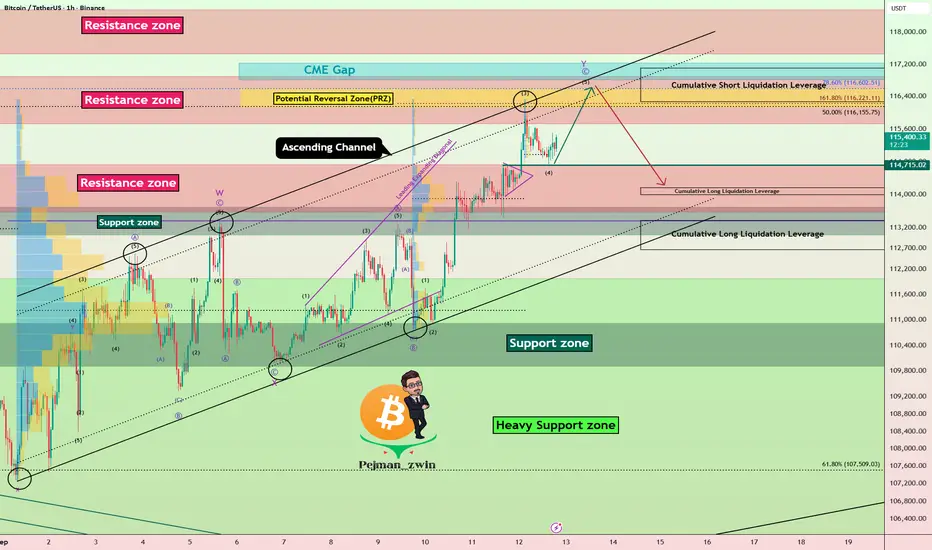
Bitcoin Roadmap | Short termBitcoin ( BINANCE:BTCUSDT ) has been experiencing a lot of volatility over the past 10 days, and the reasons for these movements could be the announcement of US indices + geopolitical issues Those who were in favor of Bitcoin caused Bitcoin to pump .
Bitcoin's movements over the past 10 days have managed to form an Ascending Channel .
In terms of Elliott Wave theory , Bitcoin appears to be completing microwave 5 of microwave C of the main wave Y .
I expect Bitcoin to try to complete main wave Y , and if we find signs of a reversal in the Resistance zone($116,900-$115,730) and Potential Reversal Zone(PRZ) , we can expect a further decline . Also, it is expected that the CME Gap($117,235-$116,820) will eventually be completed in the main wave Y .
Cumulative Long Liquidation Leverage: $114,165-$113,989
Cumulative Long Liquidation Leverage: $113,370-$112,664
Cumulative Short Liquidation Leverage: $117,102-$116,266
Please respect each other's ideas and express them politely if you agree or disagree.
Bitcoin Analysis (BTCUSDT), 1-hour time frame.
Be sure to follow the updated ideas.
Do not forget to put a Stop loss for your positions (For every position you want to open).
Please follow your strategy and updates; this is just my Idea, and I will gladly see your ideas in this post.
Please do not forget the ✅' like '✅ button 🙏😊 & Share it with your friends; thanks, and Trade safe.
Gold Correction After ATH – Bearish Waves Ahead?Gold( OANDA:XAUUSD ) has been in a correction mode for the past four days after creating a new All-Time High (ATH) . The question is whether the correction will continue or not.
Over the past 4 days, US indices were released, but Gold was not greatly affected by these indices, although the manner in which the US indices were announced was in favor of Gold ( Maybe gold is saturated with buying. ).
Gold is currently trading in the Support zone($3,644-$3,636) and near the Support line.
In terms of Elliott Wave theory , it seems that Gold has completed the Double Three Correction structure(WXY), and we can expect bearish waves .
I expect Gold to break the Support zone($3,644-$3,636) AFTER breaking the Support line and fall to at least $3,624(First Target) .
Second Target: Support lines
Stop Loss (SL) = $3,662
Please respect each other's ideas and express them politely if you agree or disagree.
Gold Analyze (XAUUSD), 15-minute time frame.
Be sure to follow the updated ideas.
Do not forget to put a Stop loss for your positions (For every position you want to open).
Please follow your strategy; this is just my idea, and I will gladly see your ideas in this post.
Please do not forget the ✅ ' like ' ✅ button 🙏😊 & Share it with your friends; thanks, and Trade safe.
