ETHUSDT → Breakdown of the global trend. Distribution to 3360BINANCE:ETHUSDT is entering a distribution phase after breakdown of a consolidation formed against the backdrop of a bearish trend (correction). Sentiment, like the fundamental background, is changing...
Bitcoin is falling, which is putting pressure on the market. The reasons are weak fundamentals, index correction, and the rise of the dollar (outflow of funds from the market). On the daily ETH timeframe, we see a break in the uptrend. Monday's candle closed below the trend line, and since the opening of the session, the price has rallied (panic???)
Ethereum is coming out of consolidation (breakthrough of 3671). A distribution phase is forming, directed towards 3366 (liquidity pool). Technically, a false breakdown of support could trigger a pullback to 3600 (retest of the previously broken upward support line).
Support levels: 3366, 3150, 3000
Resistance levels: 3600, 3670, 3916
Despite the breakdown of the trend structure, we have strong support ahead. If the bulls hold 3366, the market may form a wider trading range. But if the overall background does not change, the decline may continue after the correction...
Best regards, R. Linda!
Elliott Wave

Nifty Analysis for Nov 06, 2025Wrap-up:
Nifty has completed its wave b of internal wave 4 @25578.
Note:- Internal wave 3 is not extended. Therefore, internal wave 5 becomes extended wave.
What I’m Watching for Nov 06, 2025 🔍
I’ll be watching for the market to retrace upto 25694-25722 for completion of internal wave 4 of major wave 3. Thereafter, Nifty will head towards its target for internal wave 5 for a target of 25415-25242 with a SL of 25803 (SL on 15 min. candle close).
Disclaimer: Sharing my personal market view — only for educational purpose not financial advice.

EUR/USD - Bearish Correction 🧠 Bias: Bearish continuation after correction
After a strong impulsive drop, EUR/USD is now pausing to retrace and correct before the next leg lower. Price is showing all the classic correction signs — structure shift, smaller candles, reduced volume, and internal pullbacks.
📉 Dai ly Breakdown
The pair completed a 5-wave bearish impulse (ending around 1.1500).
Current movement is wave (iv) correction — a retracement leg after that drop.
We’re reacting to a minor 4H demand zone, but overall, structure remains bearish under the descending trendline.
There’s a liquidity void just above (orange zone), which price might fill before continuing downward.
The next major buy zone sits around 1.1350–1.1400, aligning with daily + weekly demand and 200 EMA confluence.
⏱ Weekly Context
Weekly chart shows a clean rejection from 1.1800 weekly supply (BSL sweep → BOS down).
As long as we trade below that 1.1600–1.1650 weekly zone, bias remains bearish.
The long-term target aligns with 1.0700, the next untouched weekly demand area.
🎯 Expectations
Short-term:
Correction toward 1.1600 – 1.1650 possible (liquidity fill + premium zone).
Medium-term:
From that area, expect a continuation leg down toward 1.1350 (daily demand) or even 1.0700 (weekly demand).
⚙️ Risk Management
Avoid early longs — the correction could still push lower to retest previous lows.
Look for a premium retracement entry (71% fib + OB confluence) for the next swing short.
Stops above 1.1700, targeting 1.1350 then 1.0700.
🧩 Summary
EUR/USD is cooling off after a solid bearish wave — a textbook correctional stage before the next impulse down. Expect a slow climb into premium pricing before the bears reload for another leg south.

Monero (XMR) Elliot Wave WAVE 3Monero is currently in subwave 3 of wave 3. After completing the first wave and its correction, we had a perfect 1-2 setup, which was fully fulfilled. Now we are in wave 3. For some, it might appear as if wave 3 is failing or rejecting at the 0.618 level for a longer correction—but it’s not. Keep your eyes open.
This is a typical 3-4-3-4-3-4 setup, which is common for an extended and long wave 3. We can expect some significant moves in the coming days. Monero is also still a privacy coin, which generally doesn’t get pumped. Monero is what many call the “real Bitcoin.”

Gold. 1 more leg down. 6/Nov/25Xauusd 1 more leg down before surging..What "trigger" the surge? coming NFP?

PLTR: Potential for Further Upside in H2 2025Price is showing a constructive, low-volume pullback into rising EMAs - a healthy sign within an ongoing uptrend as long as price is holding above 118-110 support zone.
Daily trend structure:
Macro trend structure (Weekly):
Thank you for your attention and I wish you successful trading decisions!

Educational BTC Analysis: Decoding BTC's Wave (C) DownHello Friends, Welcome to RK_Chaarts.
Today we are going to understand Elliott Wave Teaching Points from the BTCUSD Daily Chart,
This chart sequence perfectly illustrates the difference between motive (impulse) and corrective waves, as well as the important structures and rules of a larger correction.
1. The Structure of a Corrective Pattern (A-B-C)The Big Picture: The overall movement, labeled Intermediate Wave (A), (B), and (C) (Blue), is a three-wave corrective pattern. This type of pattern moves against the trend of one larger degree (which have been an uptrend). The three-wave (A-B-C) structure is the classic way markets move in a counter-trend. Wave (A): The initial counter-trend move.Wave (B): A bounce or retracement that moves back in the direction of the previous trend, but fails to reach the start of Wave (A).Wave (C): The final, and often most powerful, leg of the correction, which is designed to complete the retracement. This wave is always structured as a five-wave impulse.
2. The Rule of Subdivisions: Corrective Waves are Internally Motive, Wave (C) is an Impulse: The report states that Intermediate Wave (C) is expected to unfold as a five-wave impulse sequence of a Minor Degree (Red) (Minor Wave 1, 2, 3, 4, 5).
Learning Point: This highlights a fundamental Elliott Wave rule: the C-wave of an A-B-C correction is a motive wave (it has a five-wave internal structure) because its purpose is to create strong directional progress and complete the larger correction. This is commonly known as a Zigzag correction (which has a 5-3-5 internal count for A-B-C).
3. Identifying the Strongest Move (Wave 3)
The Current Phase: The market is currently in Minor Wave 3 (Red) downwards.
Learning Point: In Elliott Wave theory, Wave 3 is typically the longest and never the shortest of the three motive waves (Waves 1, 3, and 5). This means the analysis anticipates the current move to be the most directional, high-momentum, and volatile part of the entire Intermediate Wave (C) correction. This is the "sweet spot" for trend traders.
4. The Principle of Alternation (Predicting Wave 4)
Upcoming Wave: The analysis projects a shallow Minor Wave 4 (Red) rebound.
Learning Point: While the chart doesn't show Wave 4 yet, this prediction is often guided by the Principle of Alternation. If the preceding corrective wave (Minor Wave 2) was a sharp, deep correction, the next corrective wave of the same degree (Minor Wave 4) is expected to be a sideways, shallow, or complex correction (like a flat or triangle). The prediction of a "shallow" wave 4 suggests Minor Wave 2 was likely a deeper, sharper retracement.
5. The Critical Invalidation Rule
The Invalidation Level: The report sets the critical invalidation price at 74,223, which represents the low or starting point of wave ((1)).
Learning Point: Wave ((2)) can never retrace more than 100% of Wave ((1)). By identifying a specific price level, we can assume that our study says price should not broke below that particular level, it provides traders with clear risk management parameters.
I. Current Wave Count Status
The analysis indicates that the previous upward corrective structure, designated as Intermediate Degree Wave (A) and Wave (B) (Blue), is complete. The market is now engaged in a significant downward movement within the larger Intermediate Degree Wave (C) (Blue).
This Intermediate Wave (C) is expected to unfold as a five-wave impulse sequence of a Minor Degree (Red) to the downside, fulfilling the final leg of the overall corrective cycle.
II. Detailed Downward Projection
The Minor Degree five-wave structure within Intermediate Wave (C) is currently positioned as follows:
Minor Wave 1 and Minor Wave 2 (Red): These waves are identified as complete.
Current Phase: The market is now unfolding Minor Wave 3 (Red) downwards, indicating the strongest portion of the bearish move is in progress.
Anticipated Completion: Following the completion of Minor Wave 3, the analysis projects a shallow Minor Wave 4 (Red) rebound, followed by the final impulse move, Minor Wave 5 (Red), to complete the entire Intermediate Wave (C) correction.
The ultimate completion of Intermediate Wave (C) will signal the end of the larger-degree correction (labeled as a corrective wave (2)).
III. Critical Invalidation Level
The integrity of this bearish wave count is contingent upon the price action respecting a critical support level.
Invalidation Price: 74,223
Significance: This price point represents the extreme low or starting point of wave ((1)), so Wave ((2)) correction Should not breach this level as per wave principles, if it makes lower low below 74,223 on the lower side, the current Elliott Wave analysis would be invalidated, requiring a revision of the entire wave structure and market outlook.
I am not Sebi registered analyst.
My studies are for educational purpose only.
Please Consult your financial advisor before trading or investing.
I am not responsible for any kinds of your profits and your losses.
Most investors treat trading as a hobby because they have a full-time job doing something else.
However, If you treat trading like a business, it will pay you like a business.
If you treat like a hobby, hobbies don't pay, they cost you...!
Hope this post is helpful to community
Thanks
RK💕
Disclaimer and Risk Warning.
The analysis and discussion provided on in.tradingview.com is intended for educational purposes only and should not be relied upon for trading decisions. RK_Chaarts is not an investment adviser and the information provided here should not be taken as professional investment advice. Before buying or selling any investments, securities, or precious metals, it is recommended that you conduct your own due diligence. RK_Chaarts does not share in your profits and will not take responsibility for any losses you may incur. So Please Consult your financial advisor before trading or investing.

EURGBP: Cycle And Elliott Wave Makes Analysis Better Cycle analysis works well, especially on cross pairs like EURGBP, EURAUD, GBPNZD, and similar, where central banks often play a strong role and coordinate policy — sometimes even intervening when one currency moves too far.
In my view, cyclical analysis is most effective when it aligns with the Elliott Wave Principle, as both can highlight major turning points at key levels when sentiment reaches extremes.
Today we’re focusing on EURGBP, which has mostly traded sideways since 2016. We’ve been pointing out a potential cycle bottom toward the end of 2024, suggesting an important reversal point supported by a strong technical level at 0.8282. This support area also aligns with the lower side of wave B within a complex correction. Since the decline from the 2016 highs wasn’t impulsive, that added confidence — from both a cycle and Elliott Wave perspective — that a recovery was due.
So far, we’ve seen a solid reversal, with the pair already up more than 7%. The question now is how much further it can go. From both Elliott Wave and cycle standpoints, EURGBP appears to be entering the later stages of its bullish cycle, though some limited upside remains possible toward 0.9056.
That area could mark the upper boundary of an unfinished A-B-C-D-E triangle. If correct, the price is now in wave D, approaching key reversal zone.

EURUSD(LONG)
Price on major support to Push for retracement before the continuation.
We in Bullish momentum start for EURUSD
Ellitots Wave

DXY(DOLLAR INDEX) SHORT
Correction moved expected now after agrressive bullish momentum
12345 elliots move completed

POTENTIAL BULLISH SHARK HARMONIC ON BTC/USDThere appears to be a potential bullish harmonic pattern forming on Bitcoin. The structure has all the components that could signal a possible market bottom before a blow-off top phase. Sentiment and confluences — including the 0.618 retracement level, suggesting a potential completion of Elliott Wave 2 — are aligning.
I’ve outlined my entry levels, stop losses, and take-profit targets for transparency. Wishing everyone good luck with their trades.

BTC — Is This the End of Bitcoin’s Bull Market?First of all, I’ve been quite busy the past few weeks working on some exciting projects and developing new indicators that’s why I haven’t posted much here lately. But now I’m back with a fresh Bitcoin analysis, and there’s a lot to unpack.
Macro Context
BTC’s recent structure has played out exactly like a classic Wyckoff Distribution schematic.
Back in mid-July (14th July 2025), we printed a Buying Climax (BC), followed by an Upthrust (UT) → SFP / liquidity grab. Later, price formed a UTAD (Upthrust After Distribution) → the final failed breakout, confirming buyer exhaustion and triggering the sharp sell-off event that followed.
After that sell-off, BTC retested the monthly resistance level at $115,764 twice:
The first attempt resulted in a clean rejection.
The second led to SFP of the high, confirming a bull trap and setting the tone for further downside.
The monthly resistance turned out to be the most ideal short entry, offering a near-perfect risk-to-reward setup after the clear rejection. The charts really tell the whole story, BTC has followed the technical structure perfectly.
Current Structure & Key Levels
Today, we tapped the $100K psychological level, aligning with the $2 trillion market cap, that produced an initial bounce.
The question now: is this the start of a meaningful bounce, or just a relief rally before further downside?
Looking at the wave structure, we are most likely in a Wave 3 (iii) → meaning more downside pressure remains probable.
BTCUSD (INDEX):
Key Low: $98,200 — Sell-Side Liquidity
0.618 Fib retracement: ~$94,254 — ideal long entry zone
Trend-based Fib Extension (1.0): ~$93,728
Yearly Open: $93,576
The Volume Profile shows a high-volume node between $98K–$94K, with the POC at $96.4K, perfectly aligning with the support trendline and key low.
This gives us a high-probability long zone between $98.2K and $93.5K, an area where multiple technical factors align:
Key low liquidity
Fib confluence (0.618 FR & 1.0 TBFE)
Yearly open
Volume cluster (POC)
Rising trendline support
Pattern Confluence
After the rejection at the monthly resistance ($115,764), a clear Head & Shoulders pattern also formed → another strong bearish confluence.
The neckline was broken cleanly, confirming the expectation for further downside, which is now playing out.
Psychological & Technical Zones
At the moment, $100K remains a psychological key support and the market is reacting accordingly.
Now it’s time to pay close attention as we approach critical levels, especially the long opportunity zone (98.2K–93.5K).
🟢 Ideal trade plan:
Long Entry Zone: $98.2K → $93.5K
Take Profit 1: $100K
Take Profit 2: $104K
Stop Loss: below the Yearly Open ($93.5K)
Summary
Structure: Wyckoff Distribution → Markdown Phase
Pattern: Head & Shoulders confirmed
Bias: Bearish, but approaching high-value long zone
Watch for: SFP of $98.2K → potential reversal trigger
Main invalidation: Below Yearly Open ($93.5K)
BTC continues to respect the technicals beautifully.
Stay patient! The next high-probability long setup is forming right in front of us.
🔍 Indicators used
DriftLine — Pivot Open Zones → For identifying key yearly/monthly/weekly/daily opens that act as major S/R reference points
LuxAlgo — Liquidity Sentiment Profile (Auto-Anchored)
➡️ Available for free. You can find it on my profile under “Scripts” and apply it directly to your charts for extra confluence when planning your trades.
_________________________________
💬 If you found this helpful, drop a like and comment!

Siemens (SIE) Rally in Full Swing | Supercycle Target Above 700+⚡️ Siemens – Supercycle Wave 3 Heating Up! 🌊
Siemens (SIE) is mid-flight in Wave (3) of the Supercycle Wave 5 — the most explosive leg of the macro move.
Momentum still looks 🔥 with upside potential toward the 3.618 Fib extension around 330 , where Wave 3 could complete before a healthy Wave 4 dip.
Smart money’s been quietly reloading through each consolidation 🧠 — structure stays bullish, trend intact, and sentiment still building.
Wave 4 = opportunity. Wave 5 = potential breakout zone 🚀
Is smart money really in? Drop your analysis below!
#Siemens #SIE #ElliottWave #SmartMoneyConcepts #FibonacciTrading #PriceAction #TechnicalAnalysis #WaveTheory #Investing #TradingView #BullMarket #GermanStocks #MarketCycle #TrendTrading

BTCUSD 1D - Pause Before the Next Leg Down?On the 4H chart, Bitcoin is retesting a critical resistance area - the 111K–113K sell zone, where a descending trendline, prior support-turned-resistance, and local volume cluster converge. This confluence makes the current level a potential short-entry area.
After failing to sustain above 115K, BTC entered a corrective phase. The recent bounce looks like a retest of the broken structure, and unless bulls reclaim 113K+, the bias remains bearish with a target near 100K–101K, a key liquidity zone.
Technically, momentum is fading:
– Bearish RSI divergence at recent highs;
– Volume contraction on rallies, expansion on drops;
– Price structure forming a likely ABC correction, with wave C projection toward 100K.
Fundamentally , near-term pressure persists as traders take profits and global risk sentiment cools ahead of potential Fed guidance. However, the macro bull case remains intact - hashrate at all-time highs, growing institutional adoption, and supply tightening continue to underpin long-term support.
Tactical plan: short entries near 111K–113K, targets 100K–101K. Invalidation above 113.5K.
Even in a bull market, gravity never takes a holiday.

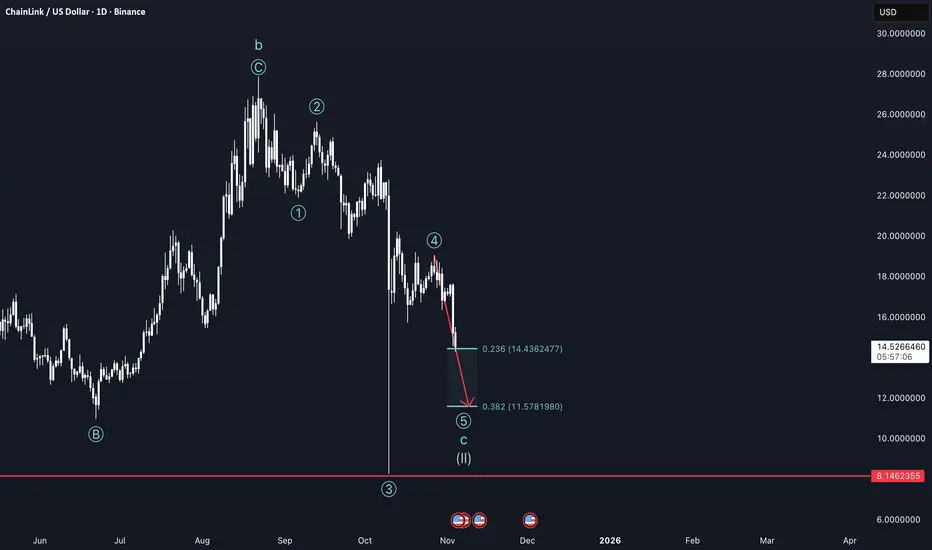
Chasing Lows - LINK weekly update Nov 04 - 10thAfter an astronomical gym session, I am now happy to review Chainlink to you!
Due to a negative macro outlook short-term, Altcoins and Bitcoin dropped in the beginning of the week and will be dropping further throughout the week.
Looking at the structure I am considering the current movement to be part of a larger correction of the supercycle wave 2, were we are internally at the wave c on the cycle and in the fifth wave in the primary cycle. For now we technically reached the first price target for short fifth waves, but since I expect Ethereum to also go down I believe we are gonna drop to the 0.382 extension level of the fifth wave, at $11.57.
On the way there we are going to fill a lot of orders as the orderbook shows a lot of them, also at the price target. As we go down I do not recommend opening short positions because a lot of people will call Altcoins and the Alt-Season dead, leading to a lot of shorts and a gradually increasing chance of short-squeezes. The bottom could be in if funding rates on the daily turn negative, and RSI enters oversold areas on the 2 week chart.
This thesis also gets supported by the VIX, which is rising and therefore indicates a risk off sentiment and the USDT dominance chart as it rises also and gets near the top.
I urgently need to point out that at this point an ending of the downtrend gets more possible the lower we fall. Buying here is a great opportunity and the lower we get the more the effect of dollar cost averaging comes into play.
looking for short BTC 114300We notice on the 4-hour frame that we have completed 5 waves. We need a flat ABC correction for the shorts on the hour frame

BITCOIN analysis 4 Nov 2025Considering the rhythm of movements and wave lengths and the use of Fibonacci tools, as well as comparison with historical price movements in the past, we can expect Bitcoin's current downward movement to continue to the range of $80,000 to $74,000. In the meantime, we will probably see a pause and a break in the price in the ranges of $98,000 to $102,000 and $88,000 to $92,000.

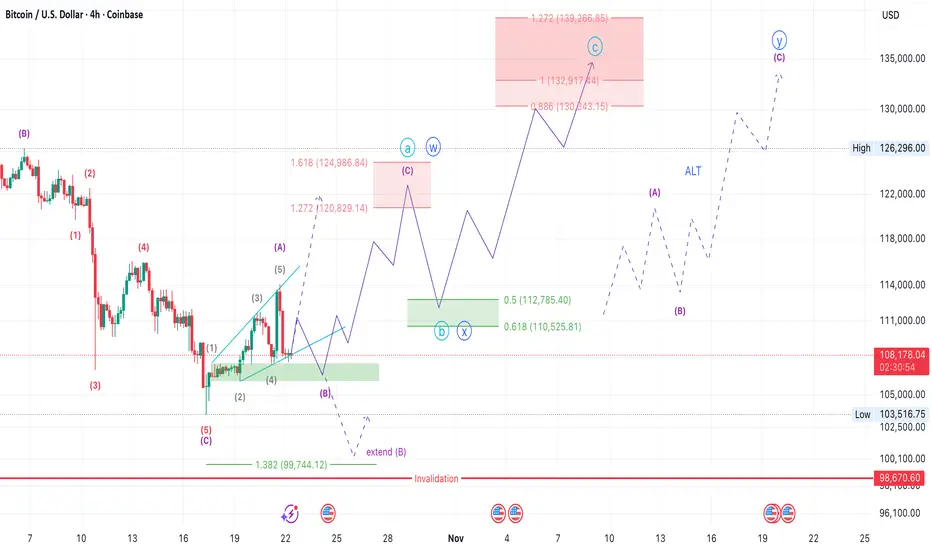
BTCUSD – Completing the Final Leg of the Ending DiagonalTechnical Overview
Bitcoin appears to be developing the final micro-structure inside Wave 5 of a larger ending diagonal pattern, which aligns with the broader weekly count.
After the recent low near $103500, price began forming a corrective rise that may represent wave ABC OR WXY of the final push to complete the terminal pattern.
The current 4H projection suggests that BTC will building subwave (C) within a potential W–X–Y structure. The next impulsive move could lift prices toward $130K–$139K, completing the upper boundary of the diagonal before a major reversal begins.
Key Levels:
Support / Buy Zone: 106 – 107k
First Target: 120 - 124k
Main Target Zone: 130 – 139k
Invalidation: Below 99,744 (1.382 Fib level) which will invalidate the idea of extended wave B
Summary:
BTC is in the final phase of an extended ending diagonal, likely completing wave (5) of (V).
The short-term setup remains bullish toward 130–139K, but traders should prepare for a major macro reversal once that zone is reached.
Momentum divergences and weakening volume will be key confirmation signals for the top.
Nifty Analysis for Nov 03, 2025Wrap-up:
Nifty has completed its internal wave 2 of major wave 3 and heading towards internal wave 3 of major wave 3. Minimum projection of wave 3 i.e. 100% has been achieved @25711.
What I’m Watching for Nov 03, 2025 🔍
I’ll be watching for the market to continue head towards its second target i.e. 161.80%, 25545-25473 with a SL of 25835 (SL on 15 min. candle close).
Disclaimer: Sharing my personal market view — only for educational purpose not financial advice.

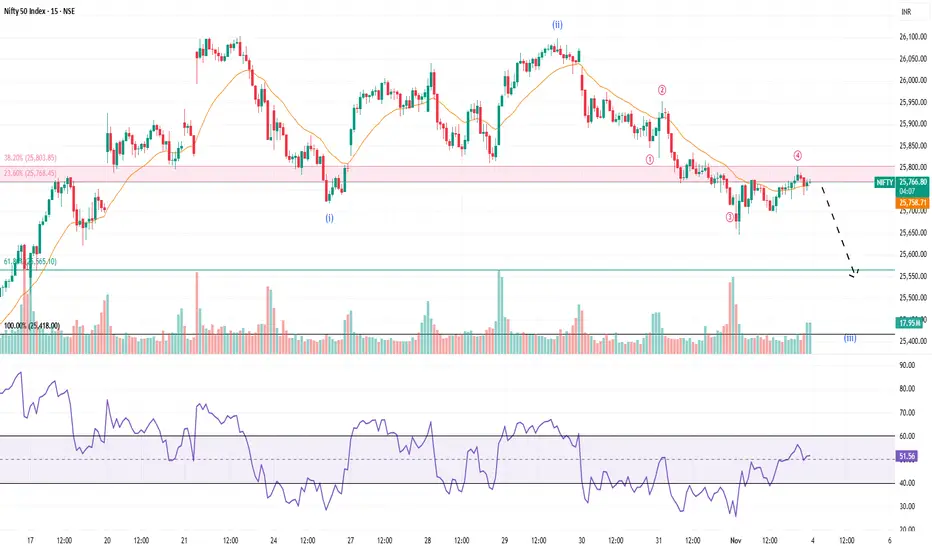
Nifty Analysis for Nov 04, 2025Wrap-up:
Nifty has completed its internal wave 4 of major wave 3 @25803 and heading towards internal wave 5 of major wave 3.
What I’m Watching for Nov 04, 2025 🔍
I’ll be watching for the market to sustain below 25768 atleast 15 min. for a target of 25565-25418 with a SL of 25835 (SL on 15 min. candle close).
Disclaimer: Sharing my personal market view — only for educational purpose not financial advice.
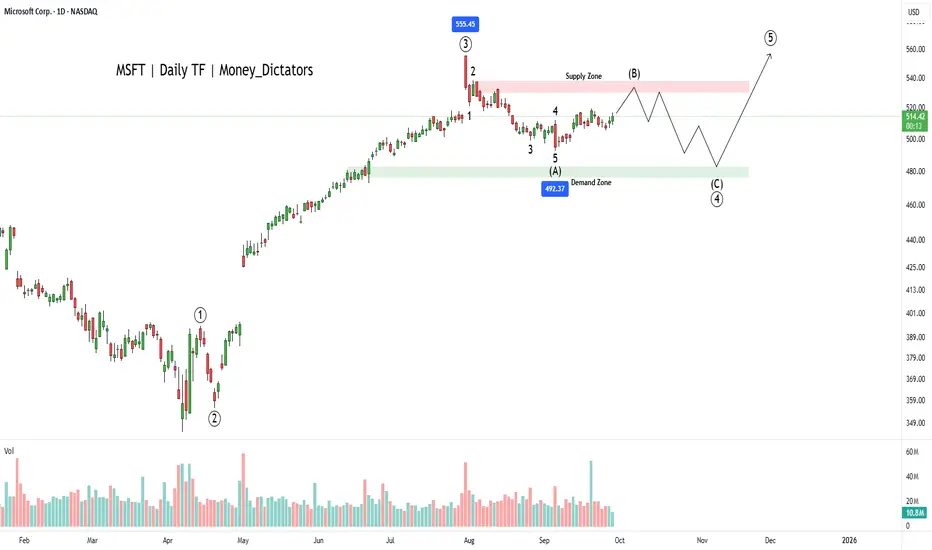
Why MSFT Could Be a Smart Pick in 2025?MSFT has bullish signals from the multiple moving averages, RSI and volume analysis. However, wave principle asks evidence from the buyers. The wave count suggests that the corrective wave (B) is ongoing, and bears will control the final wave of the primary wave 3.
Wave C will start falling nearby the supply zone and high of the 2nd wave of wave intermediate wave A. Wave C can fall up to 476 which will be the strength for wave primary wave 5. As per the chart, breakout above 540 will be a good signal for bulls to take charge back.
Zones:
Supply zone: 538 - 528
Demand zone: 482 - 476
I will update the chart and details shortly.
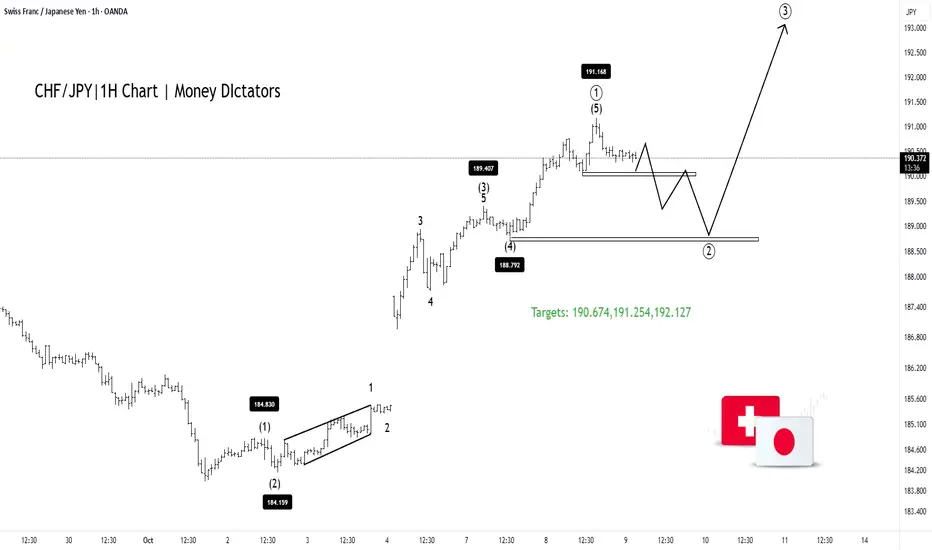
CHF/JPY Builds Momentum for Next Wave HigherThe CHF/JPY 1-hour chart shows a completed wave (1) near the 191.17 level, confirming a strong bullish impulse after a previous decline. The pair is now entering a wave (2) corrective phase, which is likely to retrace toward the 188.7–189.0 support zone before resuming the next upward move. This pullback appears to be a healthy correction within the broader uptrend. Once the correction is complete, wave (3) is expected to begin, targeting levels above 193.0 . The overall market structure remains bullish, suggesting that any short-term dips could offer potential buying opportunities for traders waiting for the next impulsive rally
Stay tuned
@Money_Dictators
Thank you.
GOLD: If Fed On Pause Then Gold Is On Pause TooAs you may have noticed, gold has seen a sharp reversal in recent weeks, and many traders and investors are now wondering whether this correction will be quick and shallow or last longer.
From an Elliott Wave perspective gold seems like it may try to complete an extended wave three, and put wave four pause in play. But what can trigger a retracement?
Well we need to consider US monetary policy. Powell didn’t convince markets last week about further cuts in December, so if rates stay on hold for the next few months or even longer, gold may continue to pause. The metal usually rallies more easily when expectations for rate cuts rise, not fall. So, both from a macro and wave perspective, this likely fits as a higher-degree fourth-wave correction. Overall, this correction could last longer, and once deeper prices flush out late buyers and weaker positions — possibly in the coming months — that’s when we’ll likely be more confident calling for the next major leg higher, ideally early in 2026.
So looking to buy? Patience!
Grega
