WE ARE BACK - ADA weekly update Aug 27 - 02thGiven the current structure, Cardano is most likely completing a 1–2 sequence at the Minor degree within the early stages of Primary Wave 3. This would imply that we are entering one of the most dynamic waves in the Elliott framework. Alternatively, this structure could still be part of a corrective phase, forming a Wave C that drives price to a new local low. However, considering broader correlations across the crypto market, I favor the bullish count.
The order book reveals significant buy-side interest around the $1.00 level, which further supports the bullish case. The liquidation heatmap shows no major liquidity clusters, only smaller pockets around the high of Minor Wave 1.
Derivative data adds weight to this scenario, with funding rates turning back from negative levels and open interest stabilizing following the Sunday pump.
Overall, the broader setup presents a favorable environment for upside continuation. At current levels, the chart offers an excellent opportunity for swing positions, as it is unlikely that price will revisit this area in the medium term. Personally, I intend to position accordingly.
Do your own research. Not financial advice.
Elliott Wave

Gold Long: Wave 3 of 3 of 3 of 5 UpIn this long video, I updated the wave counts for Gold and explained the rationale for putting the stop loss (above support instead of below) and raised concerns about volatility due to Nvidia earnings release.

USDJPY Short Update 2: Double combinationI have actually recorded a video for this but then I accidentally cancelled it. The summary is as below:
1. this is still a short idea.
2. Previous analysis yesterday on USDJPY short assumed wrongly that it is a single 3-wave correction. Turns out that it is a double combination.
3. The stop loss is above the Y wave (above 148.185).
4. The take profit, or price to review again this idea, is at the trendline labelled "First Target".
Good luck!

Bitcoin - Drop to 93k, then pump to 132k (Best plan for 2025!)No one is expecting this scenario on BTC! Bitcoin has been going down in past days; that was predicted very well in past ideas, but I think we will see more downside in the coming weeks. I have the best technical analysis on the internet, so I will tell you why Bitcoin is going to significantly drop!
First of all, let's look at all the bearish signs we have on this chart. The first major sign of weakness is this red rising wedge pattern that is currently breaking down. Yes, the trendline of the wedge is breaking down, and we already had a retest, so there is nothing that can stop the price from falling pretty much. From the Elliott Wave perspective, an impulse wave 12345 that is also inside the wedge has been completed, and we are looking for an ABC corrective pattern.
The next very bearish sign is this rectangular red range that is very close to a breakdown. But I am giving you this analysis before it happens, so you can react accordingly. That's another big sign of weakness. The next problem is seasonality. As you may know, September is statistically the worst-performing month for Bitcoin—usually Bitcoin falls in this period, so I don't know what you, but I don't want to be long on Bitcoin in this time period.
Where to buy Bitcoin again? To answer this question, we need to take the Fibonacci retracement tool and look for the 0.618 FIB, 0.382 FIB, or 0.5 FIB - always use only these 3 levels. I think we may see a deeper 0.618 FIB retracement here because we have a nice blue trendline near this level, so it would be nice to see this confluence.
Write a comment with your altcoin + hit the like button, and I will make an analysis for you in response. Trading is not hard if you have a good coach! This is not a trade setup, as there is no stop-loss or profit target. I share my trades privately. Thank you, and I wish you successful trades!

XAUUSDXAUUSD might be reaching the end of the correction with what appears to be a combination of a zig-zag and triangle. Long term bullish probabilities are increasing.

Bitcoin – Wedge at Wave 5, Exhaustion Signals RisingBitcoin’s multi-year rally from the 2022 lows has unfolded in a clean Elliott Wave impulse. The structure now appears to be entering its terminal phase, with wedge-like price action and weakening momentum suggesting exhaustion.
Wave Structure:
Wave 1 rose from the November 2022 bottom at 15,479 to 31,035.
Wave 2 corrected to 24,920.
Wave 3 extended sharply to 73,794.
Wave 4 pulled back to 49,577.
Wave 5 has pushed into new highs, reaching 124,517 so far.
Although 124,517 is a candidate top, the internal structure still leaves room for one final minor push higher before Wave 5 is truly complete.
Wedge Formation & Exhaustion:
The advance in Wave 5 is taking the form of a wedge-like structure with higher highs , a setup often associated with ending diagonals. Such patterns are typically found in the 5th of 5th wave position, signalling the final stretch of a trend.
At the same time, the RSI is diverging — price is making new highs while momentum prints lower highs. This bearish divergence reinforces the case that the rally is losing strength, even as it grinds upward.
Correction Outlook:
When the Wave 5 top is confirmed , correction targets can be mapped using Fibonacci retracements and prior support zones. Until that point, exact downside levels remain open. What matters is the process: once the rally exhausts, retracements are expected to be swift, and the initial reaction will help define the corrective path.
Risk Management:
The bearish view applies only after Wave 5 is complete. A sustained break and continuation above 124,517 would suggest Wave 5 is extending further before exhaustion sets in. Traders should respect the possibility of one more thrust higher before the corrective phase begins.
Summary:
Bitcoin’s 5th wave is nearing completion, likely in the form of an ending diagonal. Price has made higher highs, but RSI divergence points to fading momentum. Once the Wave 5 top is confirmed, correction levels can be projected using Fibonacci tools and prior support zones. Until then, the market remains in its final push, with exhaustion signals growing louder.
Disclaimer: This analysis is for educational purposes only and does not constitute investment advice. Please do your own research (DYOR) before making any trading decisions.

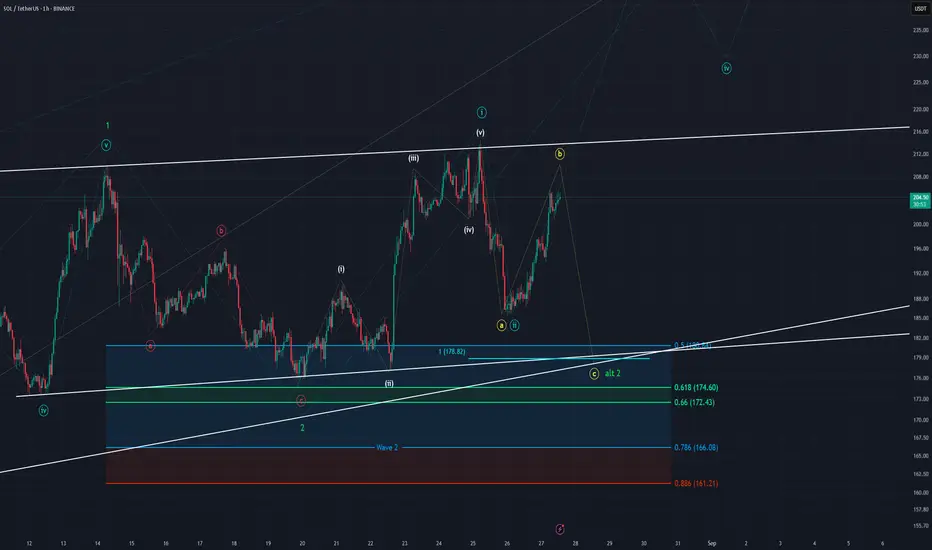
SOL - 1H Elliott Wave Analysis - 27.08.25Greetings :)
Today we got two scenarios ready for you!
Scenario 1:
The low of the 20th August is the finished green Wave 2 and the bounce we saw from the support area can be counted as the white 5 wave move up which finished the blue Wave 1. It do be not the pretties 5 wave move up. The sharp drop after the high of the 25th August can be seen as blue Wave 2 and we started the 3rd Wave up.
Scenario 2:
The low of the 20th August was only the A Wave of a bigger correction and the bounce we saw was an overshooting B Wave which topped on the 25th of August and currently we are working on Wave C down which would then finished the green Wave 2. The next target for the C would be the 1 to 1 FIB at 178.82 USD which is in confluence with the two lower white trendlines we put on the chart.
The green Wave 2 support are lies between the 0.5 FIB at 180.84 USD and the 0.786 FIB at 166.08 USD. In either Scenario as long as we hold support we are looking for a aggressive Wave 3 to the upside which should take us to 300 USD+ respectively to a new ATH.
We think both scenarios are likely but we lean slightly to Scenario 1.
Thanks for reading.
NO FINANCIAL ADVICE.

GOLD(XAU/USD): 27 AUG, 2025 Conclusion: Medium term, gold may be moving higher.
Key Points: Gold is set to move much higher, after completing the Triangle pattern.
On the other hand, the other wave count scenario for wave 4)) has ended, and we are moving higher.
No difference, just whether the uptrend is permanent or needs a little more time.
A move above 3,409.040 will trigger wave count #2, and eliminate wave count #1. While price must remain above 3,312.195 to keep both views valid.

GBPAUD → The correction is nearing completion...FX:GBPAUD is set to end the correction formed within the global bullish trend. A false breakdown of the liquidity zone is forming...
GBPAUD on D1 is testing a strong support zone, which gives traders hope for a possible recovery. Locally, the chart shows signs of the correction ending...
After correcting to 1/2 of the range, GBPAUD is forming a false breakdown of the order block and breaking the bearish structure, confirming the end of the correction. Consolidation above 2.076 could trigger a recovery within the bullish trend.
Resistance levels: 2.086, 2.0978
Support levels: 2.076, 2.0715
Despite breaking through the resistance of the local correction, the market must confirm the bullish sentiment. Consolidation of the price above 2.076 will confirm this nuance, and consolidation above the key support may influence further growth.
Best regards, R. Linda!

BITCOIN(BTCUSDT): 27 AUG, 2025 - BEARISH MARKETConclusion: Bitcoin continues to move lower.
Key Points: Wave 2-red is likely to move lower, targeting levels around 102,387.15 or lower.
There is also another wave count scenario that suggests BTC is bearish in the medium term, however, regardless, the outlook is bearish, no clear bullish market signs are seen at this point.
Invalidation Point: 117,429.

EURCAD Divergence + Wave 5 Complete → Correction Ahead?EURCAD ( OANDA:EURCAD ) started to fall after entering the Potential Reversal Zone(PRZ) and hitting the Resistance line .
The question is whether EURCAD will continue to fall in the coming hours or not!!
EURCAD has already managed to break the Support lines and is moving close to the Support zone(1.612 CAD-1.600 CAD) .
Also, we can see the Regular Divergence(RD-) between Consecutive Peaks.
In terms of Elliott Wave theory , it seems that EURCAD has managed to complete the main wave 5 , and we should wait for corrective waves .
I expect EURCAD to drop to at least 1.601 CAD AFTER breaking the Support zone(1.612 CAD-1.600 CAD) .
Second target: 1.597 CAD
Third target: Support line
Stop Loss(SL): 1.626 CAD
Please respect each other's ideas and express them politely if you agree or disagree.
Euro/Canadian Dollar Analyze (EURCAD), 4-hour time frame.
Be sure to follow the updated ideas.
Do not forget to put a Stop loss for your positions (For every position you want to open).
Please follow your strategy and updates; this is just my Idea, and I will gladly see your ideas in this post.
Please do not forget the ✅' like '✅ button 🙏😊 & Share it with your friends; thanks, and Trade safe.

Nvida Earnings Next, Can Cryptos Stabilize? Cryptocurrencies stabilized a bit in the last 24 hours while stocks also rebounded yesterday during the US session, but the dollar is still moving sideways. Maybe there will be a bit of slow day ahead, till NVIDA earnings are released. Data will be announced today, after the US close, when we’ll get Nvidia earnings, which should also be important for the crypto space. And if results beat expectations—or in other words if the market moves higher after hours—then cryptos could also do well. Looking at Nvidia’s wave count, price could be eyeing new highs after a bounce from 170 support, so maybe a minor fourth wave has finished and we could even see a gap higher after earnings, with potential resistance around the 200 round figure.
If earnings disappoint and price gaps lower, I would still see this as a higher-degree corrective wave four retracement, and maybe some opportunities later on to fill the gap. Key support to watch is around 150, the previous high. So even if there’s some downside, as long as any drop it’s not too deep, I still view this stock as bullish within an unfinished impulse, and whenever Nvidia is ready to print new highs, that’s when cryptos could also stabilize.
Grega

ASX STOCKS SCAN: PLS - 27 AUG, 2025 - BULLISH POTENTIALConclusion: Wave v))green may be moving higher.
Key Points: Wave v))green is extended and subdivides into waves i,ii,iii)purple. Wave iii)purple may now be moving higher, targeting the nearest target at the high of 3.12. While price must remain above 2.07 to maintain this view.
Invalidation Point: 2.07

ASX STOCKS SCAN: S32 - 27 AUG, 2025 - BULLISH POTENTIALConclusion: Wave 3-red may be moving higher.
Key Points: Wave 2-red may have ended as a complex corrective wave, and since 2.84 wave 3-red may be unfolding to move higher. Target a high of 3.59 or higher. While price should remain above 2.84 to keep the weight and confidence for the bullish market view.
Invalidation Point: 2.47

ASX STOCKS SCAN: MIN - 27 AUG, 2025 - BULLISH POTENTIALConclusion: Wave 5-red may be moving higher.
Key Points: Wave 5-red may be extending and subdividing into waves i,ii,iii))green. And its wave iii))green may be moving higher, targeting 48.60 or higher. While price should remain above 34.81 to maintain confidence, the weight of this bullish view.
Invalidation Point: 27.45.

XAUUSD Trade Idea – Wave 3 Building Up?📌 Analysis (H4 / H1)
-Market completed Wave 2 correction at LZB 3297–3310.
-Now building Wave 3 impulse, currently in subwave (ii) retracement.
-Next target is Wave (iii) projection towards 3420–3446 zone (LRS / LZS).
-Structure remains valid as long as price holds above 3351 key support.
Trading Plan
Entry: Around 3360–3370 (MDS / MDB zone) if rejection confirmed.

Gold Watching 3,360 Support as Powell Dovish Tone Weighs on USDHey Traders, in tomorrow's trading session we are monitoring Gold for a buying opportunity around 3,360 zone, Gold (XAUUSD) recently broke above the 3,360 resistance, turning it into an important support level to watch on any pullback. A retracement into this zone could help determine whether the breakout has strength to extend toward higher levels.
On the fundamental side, Fed Chair Powell struck a dovish tone, signaling support for a potential September rate cut, citing lower inflation pressures and risks in the labor market. This backdrop keeps USD under pressure and maintains a bullish bias for Gold in the near term.
Monitoring price action around 3,360 to assess whether buyers defend this level or if deeper consolidation unfolds.
Trade safe, Joe.

New Highs Ahead ? - BTCUSD Elliott Wave AnalysisHello Friends, Welcome to RK_Chaarts,
Today we are having Elliott wave theory counts on BTCUSD Bitcoin Chart Analysis
The weekly timeframe of the BTCUSD bitcoin chart reveals that we are unfolding Super Cycle Degree Wave (III) in Blue. This wave's sub-divisions, which should total five for a Cycle Degree, are visible. We've completed Waves I & II and begun unfolding Wave III in red.
Within Wave III, we are unfolding the 1st wave ((1)) of one lower degree as Primary (Black). This wave will unfold in five sub-divisions of one more lower degree as Intermediate degree in (Blue).
Daily Outlook:
On the daily outlook, we are currently unfolding wave (4) of Intermediate degree (Blue), a subdivision of wave ((1)) of Primary degree (Black). As wave (4) nears completion, a reversal is expected soon, driving prices toward new highs to complete wave (5) of ((1)).
Additional Support Confirmation:
Further reinforcing the analysis, the Anchored VWAP's Average is also showing support near 104,000. This confluence of support levels increases the likelihood of a reversal, making it an important level to watch for traders.
Key Takeaways:
- We're unfolding Cycle Degree Wave III on the weekly timeframe.
- Wave (4) of Intermediate degree is nearing completion on the daily outlook.
- A reversal is expected soon, driving prices toward new highs.
- Anchored VWAP also showing Support nearby current price.
Important Wave Theory Considerations:
As per wave theory, wave (4) shouldn't overlap wave (1), except in the case of diagonals and triangles. In this scenario, we are unfolding a diagonal, allowing wave (4) to enter into wave (1). However, it's crucial to note that wave (4) should not go beyond the low of wave (2) under any circumstances. If it does, our wave counts would be invalidated.
A Word of Caution:
Elliott Wave Theory and possible wave counts suggest that the price will make new highs on the chart soon. However, the market is inherently unpredictable and always ready to surprise. Therefore, it's essential to consider "what-if" scenarios in your trading journey.
Are we ready for new highs ?
As we navigate the complexities of the market, it's vital to remain adaptable and prepared for any eventuality. By acknowledging the potential for surprises and maintaining a flexible mindset, traders can better navigate the markets and make informed decisions.
Conclusion:
The BTCUSD bitcoin chart is poised for a reversal, driven by the completion of wave (4) and the subsequent unfolding of wave (5). While the analysis suggests new highs are on the horizon, it's essential to remain cautious and consider the unpredictability of the market. Are you prepared for the possibilities that lie ahead ?
I am not Sebi registered analyst.
My studies are for educational purpose only.
Please Consult your financial advisor before trading or investing.
I am not responsible for any kinds of your profits and your losses.
Most investors treat trading as a hobby because they have a full-time job doing something else.
However, If you treat trading like a business, it will pay you like a business.
If you treat like a hobby, hobbies don't pay, they cost you...!
Hope this post is helpful to community
Thanks
RK💕
Disclaimer and Risk Warning.
The analysis and discussion provided on in.tradingview.com is intended for educational purposes only and should not be relied upon for trading decisions. RK_Chaarts is not an investment adviser and the information provided here should not be taken as professional investment advice. Before buying or selling any investments, securities, or precious metals, it is recommended that you conduct your own due diligence. RK_Chaarts does not share in your profits and will not take responsibility for any losses you may incur. So Please Consult your financial advisor before trading or investing.

LQDA - Favors rally in impulse sequence for one more pushLQDA is showing impulse rally from July-2025 low and expect one more push higher targeting above 28.99 or higher levels to finish (1). The level is equal leg area of impulse sequence I from August-2021 that ended at May-2025 high. After that it started new impulse sequence as the part of III. The next pullback in (2) in simple, double or triple correction can be a buying opportunity.

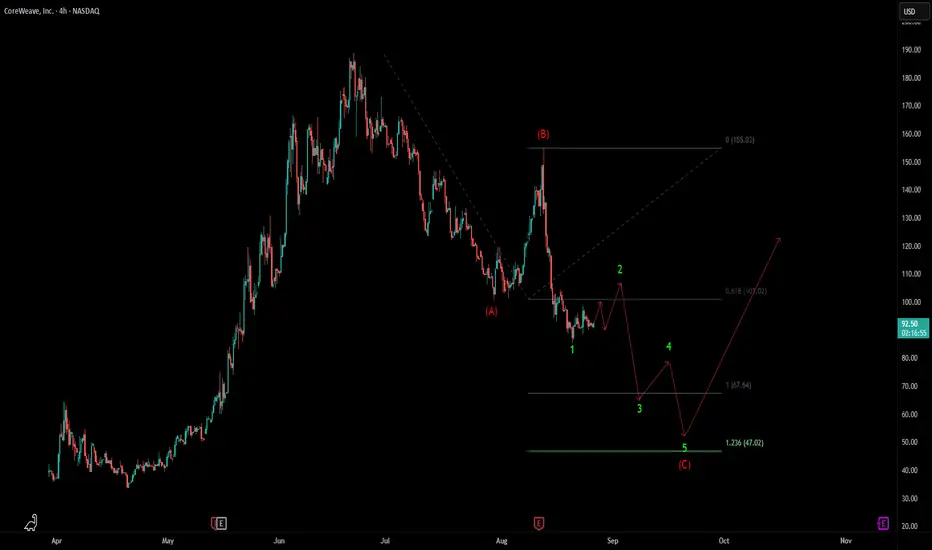
CRWV - Bearish zigzag sequence in play against 8.12.2025 highIt favors daily zigzag correction since June peak. Below 155.05 high if (B) wave, it should continue downside towards 67.6 or lower. Short term bounce in 2 should expect to fail in simple, double or triple correction to continue downside. SPY is showing impulse sequence from April-2025 low and expect pullback soon, which may fuel more weakness in CRWV.
USDJPY: Buy Position to 149Hello friends, USDJPY can be traded in this way. A good long move can be taken and enjoyed. Be successful and profitable. It is added that the analysis is based on fractals and Elliott waves.

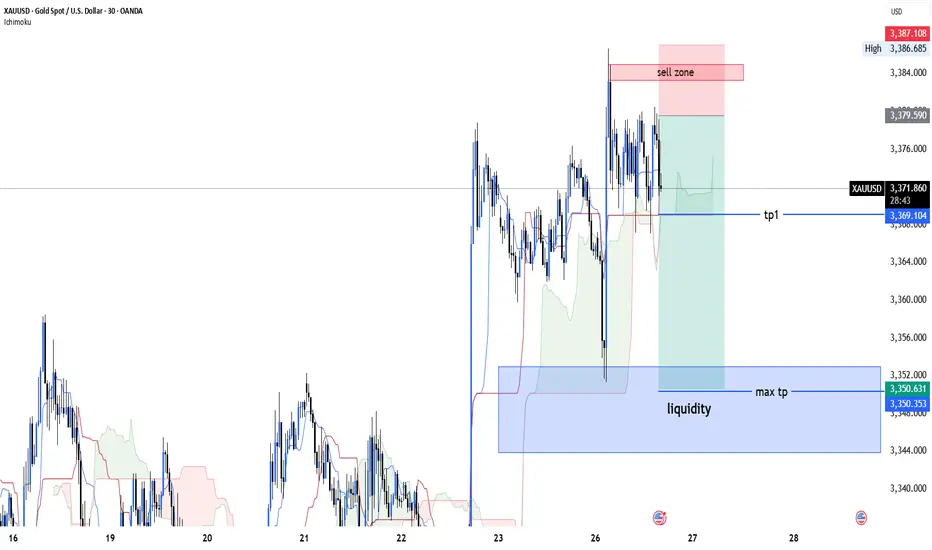
xauusd and Key level#xauusd
#gold
#m15
Key level for xauusd
1. “Gold shows bearish setup with Ichimoku, Elliott Wave, and dynamic resistance levels. Market sentiment supports further downside.”
2. “XAUUSD is facing resistance and signals potential decline. Watch key support levels for price reaction.”
3. “Bearish momentum confirmed by Ichimoku and dynamic levels. Expect further downside if support breaks.”