Hellena | GOLD (4H): LONG to resistance area of 4382.Colleagues, in the last forecast I made a markup of corrective movement (ABC), but the price broke important resistance levels and it means that the price is still in the impulse, namely in the wave “5” of higher order and wave “3” of medium order.
I believe that soon we will see a correction in wave “4”, then an upward movement to the resistance area of 4382.
The correction in wave “4” may reach the support area of 4075, but I still recommend to work with pending orders and look out for long positions.
Fundamental context
The gold market continues to benefit from favourable conditions: demand for safe-haven assets is increasing amid global uncertainty and a weaker US dollar. At the same time, central banks’ purchases of gold remain at record highs, providing a strong structural base for further upside. Despite the recent pullback, the key drivers — low real interest rates and reserve-diversification efforts — remain intact.
Manage your capital correctly and competently! Only enter trades based on reliable patterns!
Elliotwaveanalysis

Dynamatech Has Given a Clean Wave Map to the ₹11,300 ZoneDynamatic Technologies has already completed its big A-B-C correction, meaning the downtrend is over. After this, the stock started a fresh upward Elliott Wave cycle, and waves (i), (ii), and (iii) are already complete. This confirms that the stock has entered a new bullish phase.
Right now, the price is moving inside wave (iv), which is a normal and healthy pullback. This corrective move is shallow and smooth, showing that buyers are still in control. The important support for this pullback sits near 9,082 , where the chart also shows a Fibonacci level. Once wave (iv) ends, the chart suggests a strong rise toward wave (v).
Wave (v) usually extends upward, and based on Fibonacci projections, the next major target is around 11,300 . This level is marked by the 1.618 extension, a common ending point for final impulse waves.
Overall, the stock structure looks bullish and clean. The trendline breakout and wave count both suggest the next move is upward. If the price holds above 9,082, the chances of reaching the 11,300 wave (v) target remain strong.
Stay Tuned! :)
@Money_Dictators

Usdt.d(based on NEo wave)Now 95% of wave G is recognizable and its a bow tie.
Waiting for post pattern confirmation.
$QQQ: Doubtful Low The QQQ is currently showing a lower high and a lower low, indicating a likely corrective Zig Zag pattern, with wave C only slightly longer than wave A. The 1x1 Extension is positioned at 586. Last Friday's promising bounce was halted at the horizontal resistance level of 613.
The RSI has reached the same area where previous bounces occurred during the rally from the April low. The bulls need to demonstrate that last Friday's low can serve as a springboard for a recovery.

$BTC: UNDER SERIOUS STRESS Who would have thought that at the end of September, when Bitcoin ( CRYPTOCAP:BTC ) was working towards achieving a new all-time high (ATH), while it was showing a negative divergence in the Relative Strength Index (RSI), it would have lost 25% of its value by today?
The reality is that CRYPTOCAP:BTC formed a Double Top pattern with a target price of $88,910. Currently, it is struggling to maintain the 0.618 Fibonacci retracement level, having fallen below the trend line that has connected the higher lows since the beginning of August. In the daily time frame, the 200-day SMA is at 110,518, crossing from above the 50-day SMA
CRYPTOCAP:BTC is becoming oversold, which makes a bounce likely, but until proven otherwise, the trend is bearish

$SPX The trend remain up, but it's crucial to stay alert!SPX: Analyzing the weekly chart, at first glance, it seems that everything is under control. However, since the formation of the doji three weeks ago, the SPX has lost upward momentum, despite Friday's attempt with a positive opening that failed to consolidate by the close of trading.
It's clear that the 10-week simple moving average is on the market's radar and is currently holding. We can also draw a blue oblique support line; however, last week's doji is signalling uncertainty in the market, in addition to having closed below the horizontal support level at 6754.
Meanwhile, the MACD is about to issue a sell signal. For now, the SPX remains fine, but it needs to hold firm; otherwise, it might need to test the strength of the next support level, located at 6550, where the 20-week simple moving average will also be found next week.
The stakes are high!

$VIX: ALLIGNED FOR FURTHER EQUITY MARKET WEAKNESS We can observe the following on the weekly chart:
1. MACD buy signal since September 29th
2. RSI 14 above the 50 line at 53
3. From October 27th onwards, higher weekly lows and higher weekly closing highs.
4. Despite new all-time highs for benchmark stock indices, there is a divergence with the TVC:VIX (negative divergence for equities)
If this pattern persists, the risk to the stock market remains.

Elliott Wave Analysis and Key Levels for the Next MoveThis analysis shows how to apply Elliott Wave Theory together with fundamental and volume research. The content is professional, but it is also educational for anyone learning wave counting and market structure. I cover the full correction, the start of the impulse phase and the main levels that guide the scenario.

RENDER: Slightly higherRENDER recently managed to push higher once again. Currently, within the larger turquoise wave Y—which is developing as a five-wave move in magenta—it is expected to continue its upward momentum in the near term. As a key initial step, price should break above resistance at $5.51.

BULLISH CRAB PATTERN ON NFEI’ve charted this ticker before and the setup didn’t play out, but this time the structure looks a lot more convincing. We’re at a point where the stock is likely gearing up for a major move — either a full breakdown or a sharp upside reversal. From a risk-management standpoint, a small allocation (e.g., ~1% of a diversified portfolio) could make sense for those who understand the volatility, but that’s strictly a general observation, not advice.
The good news: price action looks like it’s forming a potential bottom. On the log chart, I’m seeing a possible crab harmonic completion lining up with the end of a Wave C, backed by weekly MACD divergence. I’ve outlined the levels I’m watching — entry zone, stop-loss region, and upside targets — strictly as charting reference points.
Not financial advice — just sharing the setup as I see it on the charts.

Johnson & Johnson: Extended Wave 3 Nearing Completion, Watching Johnson & Johnson is showing a very nice recovery with clear impulsive price action since breaking out of the downward channel back in July. The structure suggests an ongoing trend with an extended black wave three that now has five waves up as expected, after a nice fourth wave retracement to 186 in last few weeks. So if we are correct then market is now in late stage of an extended wave 3 which could be coming to an end somewhere around 200 level; near the channel resistance. That said, be aware of a new higher degree reversal going into end of this year. However, once we see next retracement, interesting support can once again be at 186-180 region.
Highlights:
Trend: Bullish (fifth wave within ongoing wave three)
Support: 186,180
Resistance: 200–208
Invalidation: 169
Note: Favoring continuation higher after a pullback toward support

THE TOP: Bitcoin is at its top. Enjoy.The fibs line up with the waves. We might be up for a fakeout then a massive dump.
Be careful and goodluck trading. Take profit and sit back. Dont lose everything back.

USDJPY Still Awaits the Next CatalystThe Japanese Yen (JPY) struggled to attract buyers and languished near a nine-month low against the US Dollar (USD). Despite some downside risks (from Japanese intervention), the JPY remained weak due to dovish signals from the Japanese government.
--------------------------------------------------------------------------------
## JPY Weakening (Driving USD/JPY Up)
- PM Takaichi's Signal: Prime Minister Sanae Takaichi expressed the government's preference for keeping interest rates low and called for close coordination with the Bank of Japan (BoJ).
- Impact: These comments cooled market expectations for an upcoming BoJ interest rate hike, a key factor behind the JPY's underperformance.
## Limits to USD/JPY Upside
- BoJ Hike Expectations: Despite the weakening, traders still see a 24% chance of a BoJ rate hike in December and a 46% chance in January.
- Intervention Warning: The recent decline in the JPY prompted Japan's Finance Minister and Economy Minister to issue warnings about currency movements, fueling concerns about intervention.
- USD Weakens: The US dollar (USD) is languishing near a two-week low amid economic concerns (post-shutdown), which could help limit USD/JPY gains.
- Risk-off sentiment: A surge in risk-off sentiment could support the JPY as a safe-haven currency.
--------------------------------------------------------------------------------
## Bullish Scenario
- Upside Trigger: This week's breakout through the 154.45-154.50 horizontal resistance is seen as a key trigger.
- Next Target: Spot prices may rise to the 155.60-155.65 intermediate resistance and eventually aim to reclaim the 156.00 round number.
- Warning: Repeated failures above the psychological 155.00 level warrant caution before taking aggressive bullish positions.
## Bearish Scenario
- Buying Opportunity: Any further weakness should be viewed as a buying opportunity and is expected to find support near 154.00.
- Pivot Point: A convincing break below $154.00 could drag USD/JPY to the 153.60-153.50 region and the 153.00 round number. The 153.00 level should act as a key pivot point.
- Bias Reversal: A break below 153.00 could shift the bias to bearish and open the way to the 152.15-152.10 area.

Hellena | EUR/USD (4H): LONG to the resistanse area 1.16296.Colleagues, the rather complicated correction suggests that the upward movement is gradually slowing down and I think that we will see a rather confident move towards the 1.16296 area.
The difficulty is that on higher timeframes we are dealing with a ending diagonal, and these are quite complicated figures to analyze.
Nevertheless, I think that there is a probability of reaching the support area of 1.14647 before the upward movement.
Fundamental context
The U.S. dollar is under pressure: weak economic data and expectations of monetary easing are reducing its appeal as a safe-haven asset. The euro is receiving moderate support amid relative stability in the eurozone economy and investor interest in non-dollar assets. These conditions set the stage for a resumption of the EUR/USD pair’s upward move.
Manage your capital correctly and competently! Only enter trades based on reliable patterns!

$TZA: BULLISH PATTERNS AMEX:TZA : This chart is quite interesting.
Starting point: The MACD indicates a buy signal, and the 14-period RSI is at 60 (though not shown). Therefore, everything considered, the trend appears to be bullish.
I can identify two possible patterns:
1) Since the low on October 27, AMEX:TZA is unfolding a Zigzag (ABC) pattern. The 1x1 extension for the wave (C) at 9.22. Additionally, a double bottom pattern is present with a target of 9.45.
2) AMEX:TZA has formed an inverse head and shoulders (IHS) pattern with a target at 10.52. It’s worth noting that the right shoulder may be somewhat indistinct.
In any case, we will see how the price develops.

$MAGS: Risk of a mean reversionIt doesn't look promising. If there is a weekly close below the 10-week simple moving average, and this is accompanied by a MACD sell signal, it could indicate a mean reversion toward the 20-week simple moving average, or potentially even lower, testing the high from December 2024.

$XHB: A POTENTIAL REVERSAL PATTERN Monitoring a potential Falling Wedge. If it pans out (missing the last leg down) it should be followed by a sharp move to the upside
$XLV:A BREAK BEFORE RESUMING THE CLIMBThe five-wave impulsive count from the August low may be completed; additionally, the RSI 14 is currently indicating overbought conditions. Wave 5 has nearly reached the 1x1 extension. Additionally, today’s Shooting Star also suggests a pause in the rise. A corrective phase should begin, potentially taking the form of a Flat or zig-zag, followed by another impulsive rally.

XAUUSD NEW WAVE COUNTseems all the earlier assumption of correction is invalid as new impulse have emerged.
i dont think is an Leading Diagonal, more like normal IM (impulse move)

Strategy: Downward Pressure Intensifies Strategy has continued to develop downward pressure as anticipated since our last update, bringing it closer to the targeted low of the turquoise wave 2. Our alternative—and now grayed-out—Target Zone has been breached to the downside, allowing us to remove the alternative scenario of a premature breakout to the upside. Investors who speculated on this alternative and entered within the alternative Target Zone with a stop 1% below the lower edge have likely been stopped out by now. For now, we are still allowing some room for turquoise wave 2 to move lower; however, it should find its bottom above the support at $102.40 to set the stage for wave 3 to advance further above the resistance at $674.18.

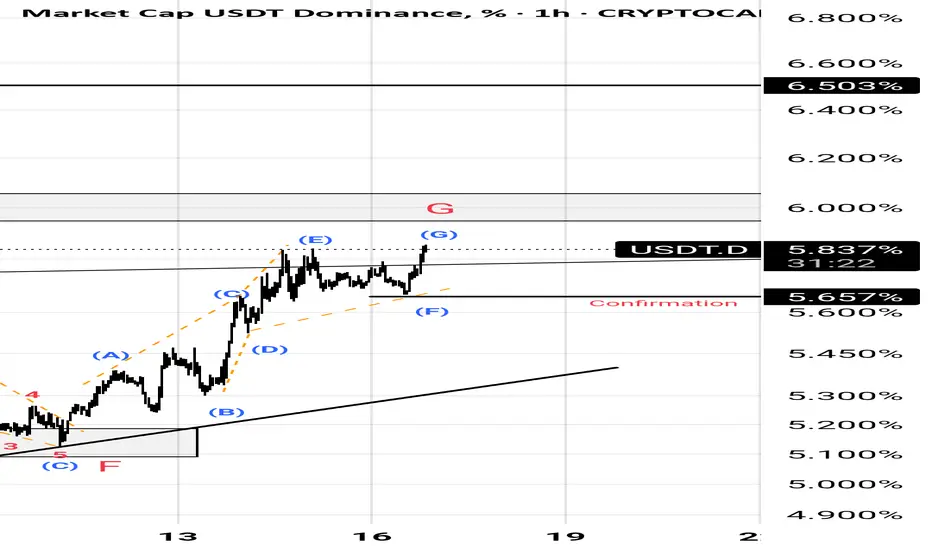
USDT.D(based on NEo wave)I think wave G is showing the pattern.
wave G might be a triangle or a diametric.
Im ready for both scenarios.

Gbpusd long setupFPMARKETS:GBPUSD looks bullish for wave 5, as the correction wave is completed. Price has broken the previous high 1.31647 & after a retrace till 1.30842, which is also in a OB and near fino level, high possibility of price to change the trend toward bullish. Please watch the chart carefully, below is the buying zone , with proper risk management one can take entry.

USDJPY bearish sceneUSDJPY has completed a bearish diagonal pattern possible breakdown, If breaks below EAB huge downfall check picture carefully for targets
