Gold may be taking a breatherWhat we know:
- Price has moved up strongly but is now forming a sideway-up structure.
- The range can be drawn as a wedge.
- Structure looks similar to a Motive wave.
- There are signs of Throw-under and Throw-over.
- This could be interpreted as a Leading Contracting Diagonal, or possibly evolving into a Flat pattern.
What to do:
- Wait for the uptrend to be invalidated by a breakout to the downside,
- Then observe the sideways movement to assess the next trend direction.
Elliotwaveanalysis

Nifty 50's Elliott Wave Analysis & Price ProjectionHey, so let's take a look at this chart of the Nifty 50. where the market might be heading. Just a heads-up, this is all for learning, not for making actual financial decisions. Think of it more like a potential roadmap than a guaranteed outcome.
From what I can see, the chart is laying out a classic five-wave pattern.
* Wave 1: The first big push up was in the latter half of 2022 into early 2023. It was the start of the uptrend.
* Wave 2: After that, the market pulled back a bit—a healthy correction, really—in the middle of 2023. It didn't drop below the starting point of the first wave, which is exactly what you'd expect.
* Wave 3: This was the huge run-up that we saw from mid-2023 all the way into early 2024. That's typically the strongest and longest part of the move. The chart marks it with a "(b)" which suggests it's part of a bigger picture, but for now, we can see it as the big third wave.
* Wave 4: Now, we're in the middle of a correction, a kind of zigzag, that started after that massive run-up. The chart shows it finding a bottom around mid-2025. It's like the market is taking a breather before the final push.
* Wave 5: And this is where it gets interesting. The chart is forecasting the final leg up, starting from this mid-2025 low. It's suggesting we could see a big rally, with the Nifty potentially hitting targets around 28,000 and even above 30,000 by late 2026 or 2027.
Basically, the chart is saying we've gone up, corrected, gone up big, and now we're in a smaller correction, getting ready for one last big move to the upside.
Again, this is just one way of looking at the market. No one has a crystal ball, and a ton of other things—like news, company earnings, and what's happening around the world—could change this forecast completely. So, always do your own homework and talk to a pro before you invest your hard-earned money.
This forecast report is for educational purposes only and should not be considered financial advice. Market analysis, especially projections based on technical indicators like Elliott Wave theory, is speculative and does not guarantee future results. Always conduct your own research and consult with a financial professional before making any investment decisions.

BTCUSDT Elliott Wave – End of the Rally or Start of a Crash?📉 BTCUSDT Elliott Wave Analysis – End of the Rally or Start of a Crash? ⚠️
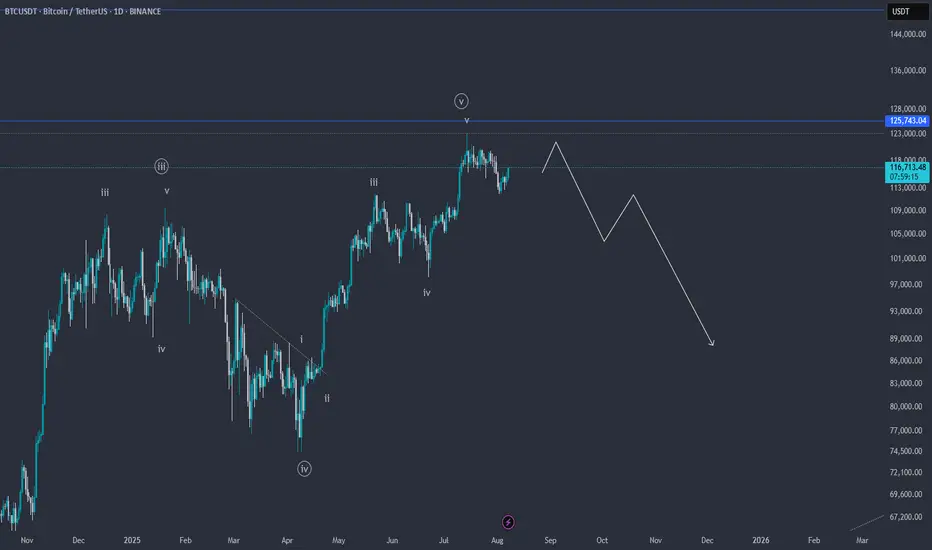
On the BTCUSDT chart, it appears that the fifth wave of the impulsive structure is nearing completion. The wave count clearly shows a full five-wave sequence, suggesting that Bitcoin may be forming a major top around the $119,000–$125,000 resistance zone.
🔻 If price action confirms a reversal and breaks key support levels, we could see a deep correction potentially taking BTC below $90,000.
📌 Keep in mind this is a scenario based on wave structure and requires confirmation via breakdowns and price action.
💬 What do you think? Is Bitcoin ready for a major correction, or will it break into new all-time highs?
✅ Save this idea & follow for updates!
3rd Wave About to Start in Ingersoll Rand (IR)Good looking Elliott Wave setup in NYSE:IR
Stock rose in clean 5 waves impulse wave followed by 3 waves down in ABC to almost exactly at 61.8% level around 75. If the wave C low 73.87 holds then we can expect another 5 wave rise in larger (3) or (C) on the upside. As per wave equality principle, we can expect it to be same in size as the previous 5-wave rise seen in the chart. That gives a potential target of 98.7 for current levels. 1.618 times of the move is at 114.04 which could be second (extended) target.
Note that invalidation level for this setup is wave C low at 73.87.

USDCAD Daily AnalysisUSDCAD has recently completed a clean 5-wave Elliott Wave decline, reaching a significant low at 1.3540 on June 16, 2025. This low marks the end of the bearish cycle, followed by an accumulation phase. During this phase, price formed a triple bottom pattern, confirming strong demand around the 1.3540–1.3560 zone.
The breakout above the neckline confirms this reversal pattern, and price is now retesting the previous resistance zone (1.3750–1.3770), which has turned into support.
The pair is also trading above the 21-period EMA, reinforcing the bullish momentum.
Elliott Wave & Structure Outlook
Elliott Wave count shows a completed 1–5 bearish wave, followed by a corrective bullish structure in progress.
Wave A of the corrective move has likely completed, and Wave B retracement is underway.
A continuation toward Wave C is expected, targeting the 1.4180–1.4300 resistance area, aligning with prior major supply zones.
Trade Plan
Buy Entry Zone: 1.3750 – 1.3700
Stop Loss: 1.3560 (below structure support and trendline)
Take Profit Targets:
🎯 TP1: 1.4000
🎯 TP2: 1.4180
🎯 TP3: 1.4300
USDCAD has shifted from a prolonged bearish trend into a bullish corrective phase. A successful retest of the breakout zone offers a high-probability long trade setup. Breakout and continuation toward 1.4180–1.4300 aligns with wave theory and technical resistance zones.

Hellena | Oil (4H): SHORT to support area of 65.944.Colleagues, I previously recommended moving trades to break-even, and for good reason. It is always necessary to hedge and reduce losses—this is part of professional work.
(Breakeven=Risk Free: Move Stop loss to the entry level).
The price has nevertheless shown a stronger correction, and I now believe that the medium-term “ABC” waves have not yet formed, nor has the large “Y” wave.
This means that I expect the completion of wave “B” and then a continuation of the downward movement in wave “C.”
I consider the support area of 65.944 to be the minimum target.
Manage your capital correctly and competently! Only enter trades based on reliable patterns!

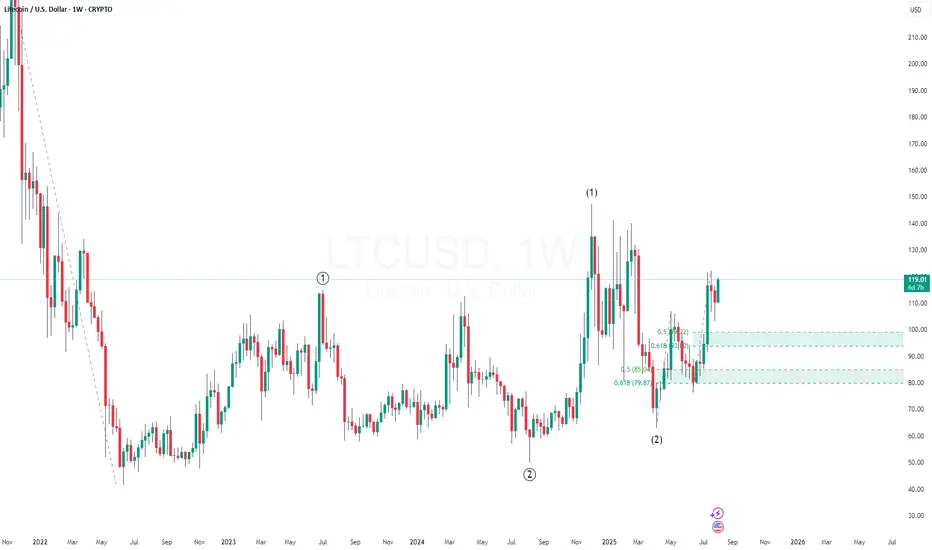
LTC Could Be Gearing Up for a Massive Wave 3 post 1-2, 1-2 Litecoin (LTC) appears to have completed a 1-2, 1-2 wave pattern, a classic bullish setup in Elliott Wave theory that often precedes an explosive move.
This nested formation signals strong internal momentum, where both the higher and lower degree structures are aligned for upside. If the count holds, LTC is now positioned to launch into Wave 3 of the larger Wave 3 — typically the most powerful and extended rally in the entire wave cycle.
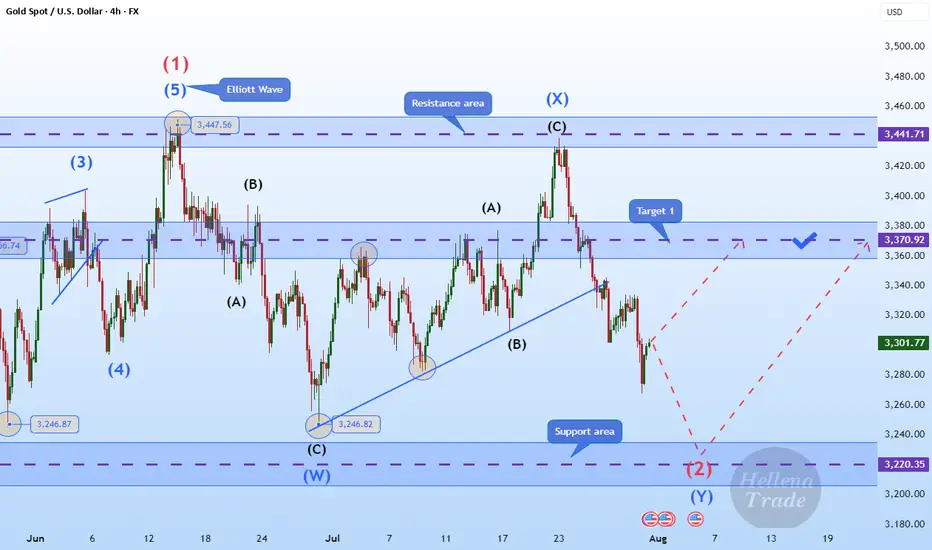
Hellena | GOLD (4H): LONG to area of 3370 (Wave 2).Colleagues, gold is once again disrupting our plans, and I have to revise the wave marking. It's not easy, but the most important thing is to keep doing it.
Now I'm back to the previous marking — the price is in wave “2” correction.
To complete this wave, the price needs to overcome the level of wave “W” of the middle order 3246.82. Then the correction will be completed and wave “3” will begin an upward movement.
I see the minimum target in the area of the 3370 level.
Manage your capital correctly and competently! Only enter trades based on reliable patterns!
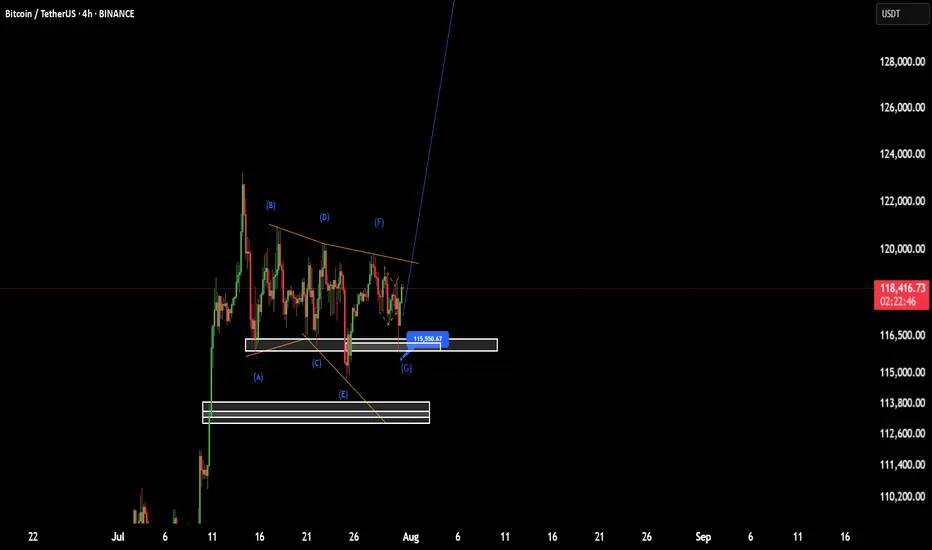
NeoWave Alert: BTC G-Wave Sets Up a Brutal Drop After $116K PumpAs anticipated in our previous NeoWave analysis, the market appears to be deep within Wave G of a Contracting Diametric structure (A–G), originating from the March 2025 high.
⸻
🔻 Key Developments:
• After rejecting from $119,000–119,500 (Wave F resistance), price dipped to $112,000, breaking below the previous channel’s lower bound, and now appears to be forming a steeper descending channel.
• This new channel’s resistance has shifted lower to $116,000, becoming a potential bull trap zone.
• The bounce from $112K is likely a liquidity sweep, preparing for one final upside to $116K, followed by aggressive distribution.
⸻
💡 Trading Thesis:
We’re likely seeing a trap-style rally within Wave G, aiming to:
• Attract liquidity up to $116K
• Induce late longs before initiating a more violent selloff toward $105K or lower
⸻
🔍 Smart Money Confluence (SMC / ICT)
• 🟥 Confirmed bearish structure on 1H (Lower Highs + BOS)
• 🟨 Liquidity above $120K already swept during Wave F
• 📉 Order blocks around 119.5K rejected
• 🔻 Price currently trades above $114K, but trapped inside a sharper descending range
• 🧲 Unfilled FVGs between $113K–$110K may serve as magnets
⸻
🧠 Wave G Structure (Diametric)
• Possibly unfolding as a Zigzag or Complex Combination
• Channel boundary now capped at $116K
• Wave G likely targets a breakdown below Wave E ($113K) and toward $105K
⸻
📌 Primary Scenario:
• Final push to $116K → strong rejection expected
• Bearish continuation targeting $110K → $105K
🧯 Invalidations:
• Clean breakout & daily close above $120.5K invalidates this diametric structure
• Watch for triangle or flat morphing if structure shifts
⸻
⚠️ Risk Management:
• $116K = key distribution zone
• Watch closely for rejection and breakdown confirmation
• Shorts valid below $114K with tight invalidation above $117K
⸻
📌 Conclusion:
Bitcoin is nearing the climax of a multi-month complex correction. The current setup favors a liquidity trap toward $116K, followed by continuation of Wave G toward major demand zones. Smart money bias remains bearish below $117K.
⸻
💬 Drop your alternate wave counts or SMC confirmations in the comments!

ETHUSDT: Elliot Analysis You can see the Ethereum chart in the long term, which indicates the end of the fourth wave and the beginning of the fifth wave, so with capital management, you can have a good investment.

GBP/USD: Post-Impulse Sell Setup from Ending DiagonalThe chart depicts a completed 5-wave impulsive structure, culminating at the top of wave (5). The internal wave structure of the final fifth wave forms a classic ending diagonal pattern, typically signaling a trend reversal or deep correction.
After this extended fifth wave, the price has started rolling over, confirming the start of a corrective decline. The wave count now expects an ABC correction targeting the previous wave 4/2 demand zone, highlighted in red.
Target 1 (T1): 1.33608
Target 2 (T2): 1.32436
Stop Loss (SL): 1.35988
Ending diagonal at the top of wave (5) signals exhaustion of bullish momentum.
Clear bearish divergence (not shown here) is commonly seen with this pattern.
The price has broken the short-term structure and is now forming lower highs.
Target zone aligns with previous wave 2 consolidation – a typical retracement zone for post-impulse corrections.

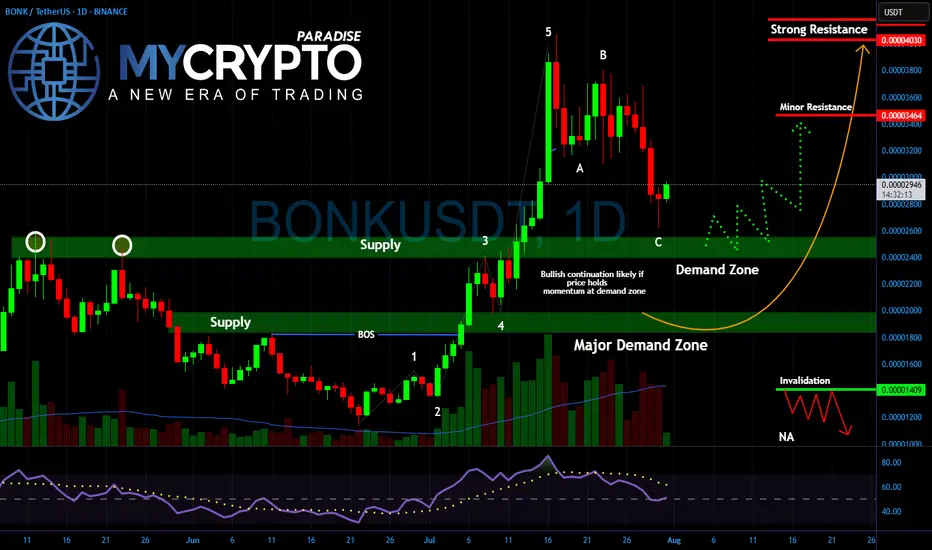
BONK About to Break Out or Break Down?Yello Paradisers! Are you ready for the next explosive move in #BONK? After nailing the last rally and spotting the impulsive 5-wave structure early, we’re now entering a critical phase — and what happens next could decide whether BONK flies or collapses.
💎The recent pullback has followed a clean A-B-C corrective structure, landing perfectly into the key demand zone between 0.00002600 and 0.00002200. This zone now acts as the battlefield between smart money buyers and weak-handed sellers. Price action is slowing down, volume is drying up, and RSI is resetting all classic signs of a potential bullish continuation. But if buyers fail to step in with conviction, the market could easily sweep lower to test the major demand zone closer to 0.00001800.
💎As long as price holds this area and confirms a reversal with follow-through momentum, we could see #BONK heading back toward 0.00003460 as the first stop, and possibly a retest of the 0.00004030 resistance. However, if price closes below 0.00001409, that would invalidate the bullish setup and confirm a deeper corrective phase.
Patience and strategy win the game, Paradisers! The market is designed to shake out weak hands before the real move happens.
MyCryptoParadise
iFeel the success🌴
BTC(based on NEo wave)I think wave G is finished and soon it will pump to 138K.
stop loss is 115500.
attention:138K is the first target of these bullish waves.
EUR/USD Elliott Wave: Corrective Pullback in Progress Wave ((4))EUR/USD 4H chart with Elliott Wave count. The pair remains in a steady downtrend after peaking at the wave (C) high, and is now in the middle of a larger wave iii decline. Bearish impulse waves dominate, with lower lows confirming the trend (mid-wave iii scenario). Now expecting a wave ((4)) relief bounce (corrective) within this wave iii. Price could rebound toward 1.15788–1.16153, the ~38.2–50% Fibonacci retracement zone of the prior drop.
This area is a likely resistance for the bounce, suggesting only a temporary uptick in an otherwise bearish move. After wave ((4)) completes, the downtrend should resume as wave ((5)) of iii kicks in. The next downside target is around 1.13974 (or lower) – near a 1.618 Fibonacci extension projection where wave ((5)) may complete. This would likely finish wave iii and aligns with the broader bearish Elliott Wave count.

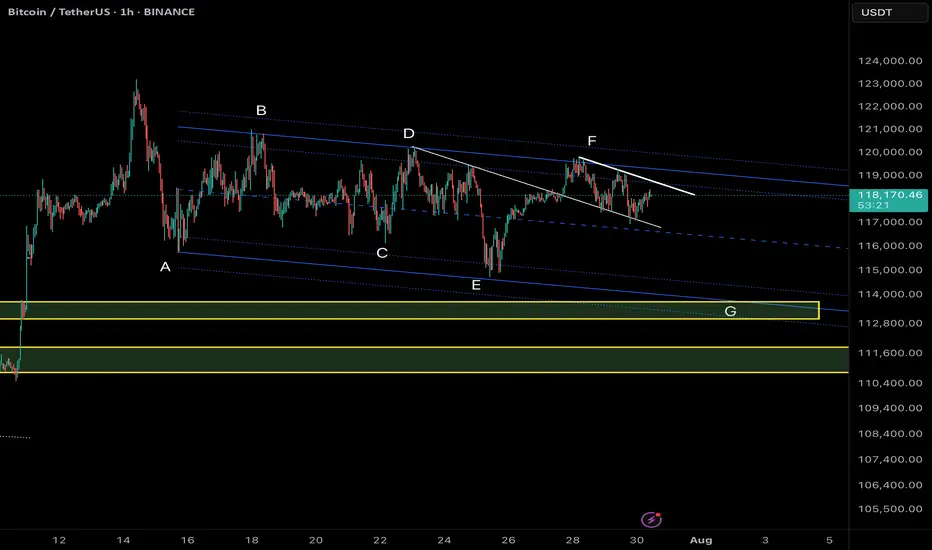
Bitcoin (BTCUSDT) - Possible Completion of a Complex CorrectionTimeframe: 4H + 1H
Methodology: NeoWave (Glen Neely) + Smart Money Concepts (ICT/SMC)
Posted by: @CryptoPilot
⸻
🧠 NeoWave Analysis: Complex Correction Ending?
From a NeoWave perspective, BTC seems to be in the final stages of a Complex Correction that started in March 2025 from ~72k. The upward move appears to form a Contracting Diametric structure (7 legs: A–B–C–D–E–F–G), with the current leg G potentially unfolding now.
• ✅ Wave A: Sharp recovery from March lows
• ✅ Waves B–F: Alternating corrective legs with varied time and complexity
• 🔄 Wave G: Could be starting now, expected to break structure to the downside
This suggests that the entire move from March till now may represent a large Wave B, setting the stage for a deeper Wave C down.
⸻
🔍 Price Action + Smart Money Confluence
The following observations strengthen the NeoWave scenario:
• 🟨 Liquidity Pools above 120k were swept recently, creating a potential Buy-side Liquidity Grab
• 🟥 Imbalance/FVGs below 114.5k remain unfilled
• 🔻 Market Structure Shift (MSS) evident on 1H chart — lower highs forming
• 🧠 Price rejected from a key Supply Zone, aligning with end of Wave F
• 🟩 If price re-tests the internal bearish OB (near 119.5k–120k), it may provide an ideal short trigger
⸻
📌 Key Levels to Watch:
Level
Description
120.2k
Liquidity sweep zone / MSS confirmed
118k
Current structure base (pivot)
114.5k
FVG + potential Wave G target
111–112k
Strong demand zone (accumulation support)
🧭 Scenario Outlook:
Primary:
→ Price is in Wave G of a Diametric (NeoWave)
→ Likely to unfold as a 3-leg Zigzag down or a Complex combination
→ Objective: break below Wave E low and target the unmitigated imbalances
Alternative:
→ Extended Flat or Triangle, if 120.5k is broken impulsively
→ Invalidation = clean break and hold above 121k
⸻
⚠️ Risk Note:
This analysis assumes Wave G is beginning. If bulls manage to reclaim 120.5k with momentum and close above, the bearish structure will be invalidated.
⸻
💬 Final Thought:
We are potentially nearing the end of a complex corrective rally. The confluence of NeoWave structural symmetry, Smart Money traps, and market inefficiencies suggests that BTC may be preparing for a retracement. Stay alert for confirmations before executing.
⸻
📌 Follow @CryptoPilot for advanced wave structure updates, market geometry insights, and ICT-style smart money traps.
💬 Share your views or alternate wave counts in the comments!
AMD: Potential Mid-Term Reversal from Macro SupportPrice has reached ideal macro support zone: 90-70 within proper proportion and structure for at least a first wave correction to be finished.
Weekly
As long as price is holding above this week lows, odds to me are moving towards continuation of the uptrend in coming weeks (and even years).
1h timeframe:
Thank you for attention and best of luck to your trading!

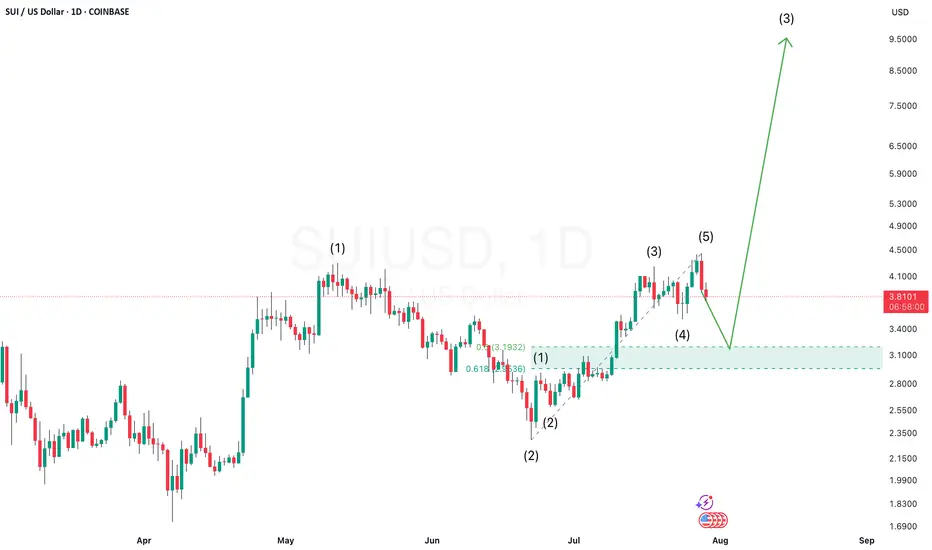
SUIUSD Setting Up for a Potential 1-2, 1-2 Pattern — Wave 3 BlasSUIUSD appears to be forming a classic 1-2, 1-2 Elliott Wave setup — a bullish structure that often precedes an explosive third wave rally.
In this pattern, we first see a motive Wave 1 followed by a corrective Wave 2, then another smaller-degree Wave 1 and 2 within the larger Wave 3. This kind of nested structure shows strong underlying bullish momentum building up in layers.
Once the second minor Wave 2 completes, SUI could launch into a powerful third wave of Wave 3, typically the strongest and most extended move in the sequence. That’s the breakout phase where price accelerates rapidly, often leaving late buyers behind.
Watch for confirmation
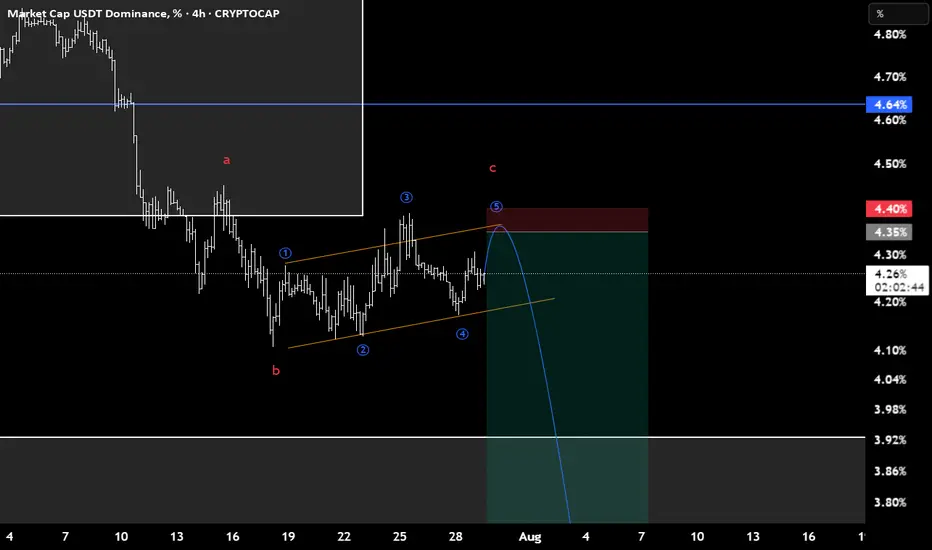
USDT.D(based on NEo wave)I consider this branch as a flat and c wave is the terminal with 3rd extended.
stop loss is 4.4.
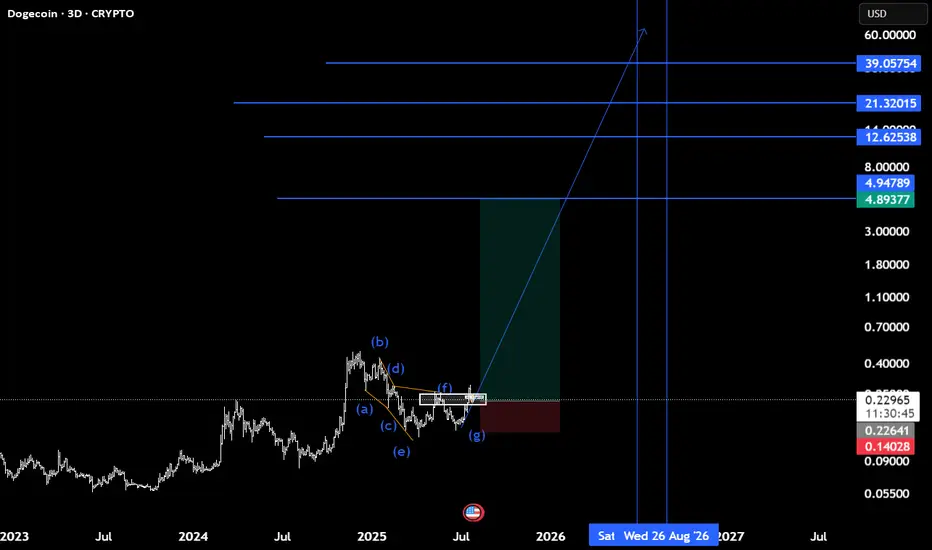
Doge(based on NEo wave)confirmation of finishing the E wave of triangle is here now.
it takes about 400 days for all targets to pass.
see the related last chart of doge.
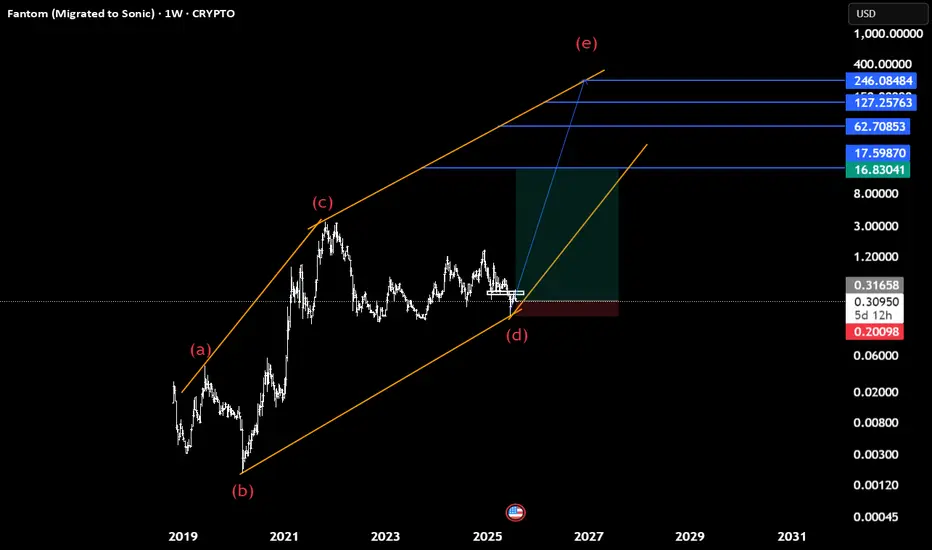
Sonic(based on NEo wave)Soon Sonic will start heavy bullish waves to the targets which shown with blue lines.
95% it is a diamnod diametric and we cant consider this as descending triangle because there is no overlap between wave d and a.
Hellena | GOLD (4H): LONG to resistance area of 3440 (Wave V).As you can see, everything turned out to be more complicated than I had previously thought. We are dealing with a complex correction and a diagonal. I believe that the “ABCDE” waves, which make up the corrective wave “4”, are completing their levels, and I continue to expect the upward movement to continue.
The first area I expect is the resistance area of 3440. This will be the beginning of the large upward wave “V.”
Manage your capital correctly and competently! Only enter trades based on reliable patterns!

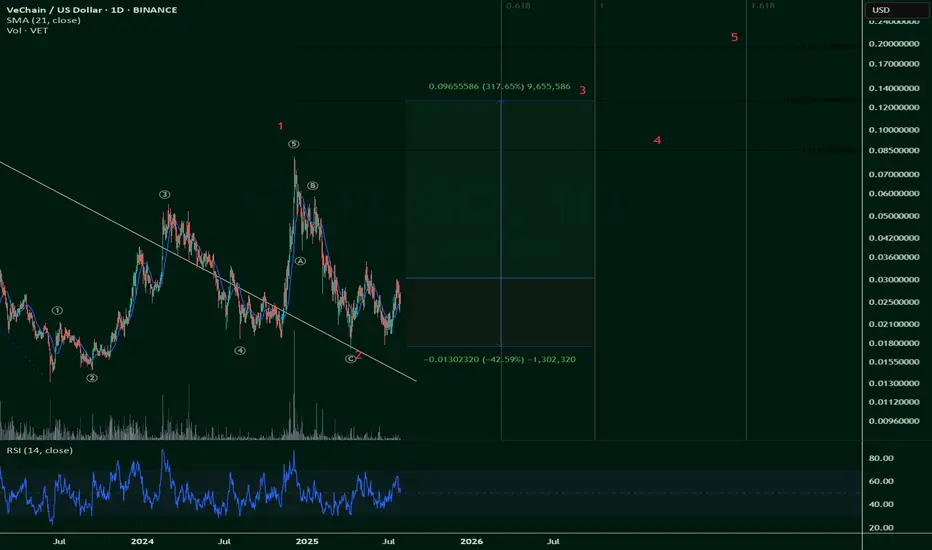
$VET Vetchain - A very generous Bullish scenario (ShortTerm)NOT FINANCIAL ADVICE
This is a very generous idea that considers the bullish scenario for $VET.
The risk/reward ratio is 7.5 (317% upside vs42.5% downside).
However, this is only due to the really high beta that NYSE:VET posits.
It's a risky trade, sure, but the rewards are sweet -- if this plays out.
$BTCUSD - Bullish 2025 - Cycle Wave III up (eta Dec2025)NOT FINANCIAL ADVICE
Let's start with this bullish outlook on Bitcoin and its various phases:
Here, I estimate the likelihood of CRYPTOCAP:BTC 's journey through its Cycle Wave III.
