UKOIL
Oil is completing a complex corrective pattern, and the current wave is a branch of the corrective wave forming a
Elliotwaveanalysis

GBPNZD Potential Long setup Price has formed and ABC pattern and has reacted from a demand area
waiting to see some price action at pullback inside the zone with some volume pushing price up targeting around 2.35 area
watching price action here is a must
trade safe

EURUSD SHORTPrice tapped the supply zone at daily
overall trend bearish
ABC formation high probability for short trade to 1.1550
Trend safe

BTC Wave 4 Bounce Looks Like a Trap! Is it?BTC is still moving inside a clear corrective channel, with the current bounce likely forming wave 4 before one final drop toward the 1.618 extension near 79,650 . The highlighted red zone shows a potential trap area where price may lure traders into thinking a reversal has started. Until BTC breaks above the channel convincingly, the broader structure still favors a wave 5 decline. The wave count from 1–2–3 supports this final leg down before any major recovery.
Stay Tuned!
@Money_Dictators

BTC reality check! Flat wave C & Oct 26 bottomWe’re back on BTC to drill into my alternate Elliott Wave count and the cyclical roadmap. Cycle work pointed to an October top, which we’ve seen. I remain long-term bullish, but near term I still see a flat correction in play, with wave C unfolding.
Drivers
Elliott Wave structure
The larger uptrend remains intact, but the current phase looks corrective as a flat: wave A as a flat, wave B irregular, and wave C unfolding in five subwaves.
Near term, price action looks like we’re in or finishing wave 4 of C. By alternation, with wave 2 having been deep (around the 61.8% area), wave 4 often resolves shallower (around the 38.2% area). If it stretches closer to 50% and compresses, a triangle into a final wave 5 is plausible before completion of C.
If C remains overlapping and wedge-like, an ending diagonal scenario keeps downside limited. If instead the decline is impulsive, this drop could be only wave 1 of a larger 5-wave move lower.
Momentum-wise, higher-timeframe RSI shows divergence, consistent with a late-stage correction.
Cyclical framework
Bitcoin’s recurring rhythm has often mirrored halving cycles: a bear phase roughly around a year, followed by multi-year bull advances.
Symmetry between bottom→halving and halving→top continues to be informative. With the next halving due in 2028, the cycle window I’m monitoring points to a potential bottom window around Q4 2026 (often cited around October).
This video focuses less on a single trade and more on the timing roadmap: when the corrective structure might complete and when to consider re-engaging for the longer term.
Key zones to watch
If an ending diagonal plays out, a termination near the high-60Ks (around 69k area) would be consistent with “limited downside.”
A more dramatic impulse path could open a wider “magnetic zone” of support roughly spanning the low-70Ks down toward the 50Ks, with deeper stretch risks if the impulse extends.
Confirmation will depend on how wave 4 resolves and whether the next leg proves corrective (ED) or impulsive.
Trade idea
My base lens is structure-first, timing-second. If wave C finishes as an ending diagonal, downside should be limited in the high-60Ks and setting up a bullish continuation in 2026. If instead the drop proves impulsive (5 down), treat bounces (0.5–0.618 retraces) as opportunities to reassess shorts, with a support “magnet” spanning roughly low-70Ks to low-50Ks, and deeper risk if momentum accelerates. Validation hinges on how wave 4 resolves and whether the final leg is overlapping (ED) or cleanly impulsive.
If you want my annotated charts and live invalidation levels, drop a comment. Like and subscribe to catch the mid‑week follow‑up when wave 4/5 signals firm up.
This content is not directed to residents of the EU or UK. Any opinions, news, research, analyses, prices or other information contained on this website is provided as general market commentary and does not constitute investment advice. ThinkMarkets will not accept liability for any loss or damage including, without limitation, to any loss of profit which may arise directly or indirectly from use of or reliance on such information.

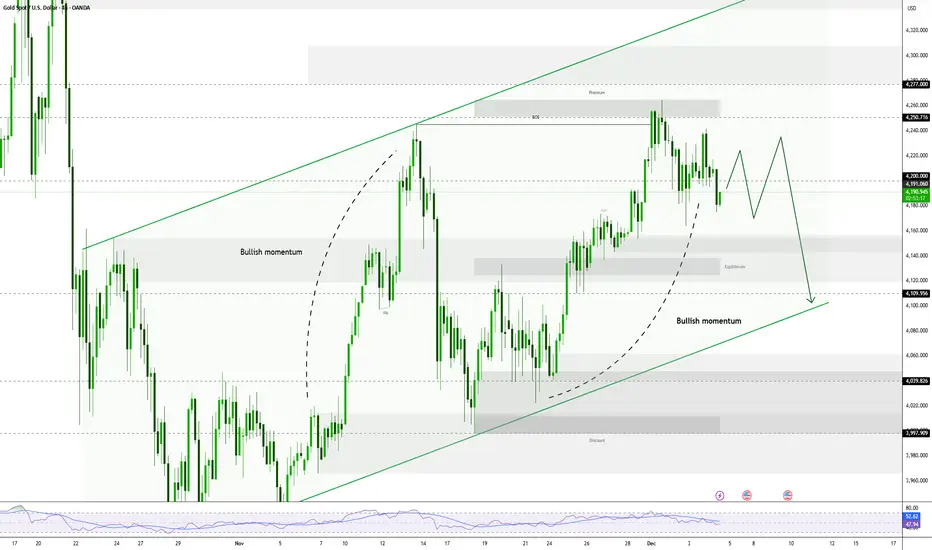
Price Under Pressure and Fails to Break $4,245Gold (XAU/USD) is under pressure as it has repeatedly failed to break through the $4,245-$4,250 barrier. This failure, followed by a decline, supports the bearish view.
✅ Bearish Scenario
- ⚡Initial Critical Point: Diverse technical oscillators indicate that further declines are likely to find decent support near the weekly low, which is the $4,164-$4,163 area.
- ⚡Downside Target: Continued selling below this level could drag Gold towards the $4,100 round figure.
- ⚡Strong Support Base: The next decline will test the confluence support at $4,085.
Note: $4,085 is composed of the 200-period EMA on the 4-hour chart and an ascending trendline. This level should act as a strong short-term base.
✅ Bullish Scenario
- ⚡Strong Hurdle: The $4,245 – $4,250 zone will continue to act as an immediate strong barrier.
- ⚡Next Target: Above $4,250, the price could head towards the $4,277 – $4,278 region.
- ⚡Strong Upside Trigger: Sustained strength beyond the $4,300 round figure will be seen as a key trigger for bulls and pave the way for additional short-term gains.
MSTR - Wave 4? - Next stop 197-202 then reload for 220-235!THESIS
The recent price action confirms a bullish Elliott Wave impulse move from the $155.61 low. The market has validated an Extended Wave 3 by successfully holding the maximum 61.8% retracement level during the deep Wave 4 pullback (low of $177.82).
We are now in the final thrust of Minor Wave 5, we should then see a 3 wave pullback which sets up the full corrective rally to our higher-degree target of $220-$235!
Analysis & Targets (Aligned to the Chart)
1. 🎯 Wave (A) Completion: The Final Minor Impulse
The current action is the final push of Minor Wave 5 (the fifth wave of the initial impulse from the $177.82 low).
• Entry Signal: The bounce from the $177.82 low confirmed the Wave 4 bottom.
• Target Zone (A): The technical projection for Wave 5 (using W5 = W1 or 0.618 \times W1-3) places the peak between $196 - $202
• Action: This is the initial profit-taking zone. Look to sell calls here, as this completes the first major structural move.
2. 🌊 Wave (B) Correction: The High-Grade Reload
Once the Wave (A) target is hit, a larger corrective pullback (Wave (2) in the larger context) is mandatory before the final surge. Since the preceding Wave 4 was sharp/deep, this Wave (B) correction is likely to be shallow/sideways (a Flat or Triangle) to adhere to the Principle of Alternation.
• Target Zone (B): We project a 38.2-50-61.8% retracement of the entire impulse. This places the reloading zone between $182 - $172 (The green box on the chart).
• Action: This is the Optimal Reloading Zone for long positions before the final rally.
3. 🚀 Wave (C) Final Target: The Greater Rally Peak
The final Wave (C) completes the overarching corrective rally. This leg is targeting a significant Fibonacci retracement of the prior, large bear wave.
• Target Zone (C): The $220 - $235 box is perfectly aligned with the high-probability 38.2% of the massive Wave 3 down that preceded this entire rally.
• Action: This is the final take-profit target for the entire trade structure.
Key Levels to Watch
• Buy Target (Sell Limit): $197 (Exit Minor W5).
• Reload Zone: $182- $172 - (Buy the Wave B dip).
• Invalidation Price: $170 (A close below this invalidates the entire impulse).
Good luck with the final wave! Remember to manage risk and set a stop loss! I am a guy on the internet and not a financial advisor!
#ElliottWave #MSTR #Bitcoin #Bullish #TechnicalAnalysis

Netflix: Long-Term Buy Zone in Focus Netflix shares have recently turned lower, moving towards our previously identified long-term entry zone between $96.27 and $75.19. Within this range, we expect the low of the turquoise wave 4 to form, setting the stage for the ongoing upward impulse in wave 5 to push past resistance at $134.11. In a new alternative scenario, there is a 30% probability that the beige wave alt.IV could establish a lower low below $81.27, though it would still remain within the long-term entry zone

USDJPY Breakdown Begins:Elliott Wave Points to Deeper CorrectionThe USDJPY 4H chart shows a completed five-wave impulsive structure, ending at the recent high marked as wave (5). After finishing this full wave cycle, the price has started to break down from the rising wedge pattern, which is a common sign of a trend reversal. The corrective structure from the top suggests the beginning of a larger A-B-C decline, targeting lower levels in the coming sessions. As long as price stays below the invalidation level near 157.68, the bearish outlook remains valid. This setup indicates that USDJPY has likely completed its bullish phase and is now preparing for a deeper corrective move downward.
Stay tuned!
@Money_Dictators
Thank you :)

EURCHF – Bullish ABC Pattern“Market is forming a bullish ABC structure. Wave C may continue upward if support holds.”

EUR/USD Wave CWe just validated the 5 wave count followed by A & B we expect the the the correctional C wave to be violent to the downside

XAUUSDWhen Elliott and liquidity line up perfectly, the market has only one option: submit. 💸🔥
TP:40RR

S&P500: Futures Stuck in Tight Range S&P 500 futures traded mostly sideways yesterday, remaining confined within a tight range. In our primary scenario, however, we anticipate that magenta wave (4) will soon resume its downward move. During this phase, the index is expected to initially break below the support levels at 6540 and 6371 points. We then look for the final low of the wave (4) correction to occur within our green Long Target Zone between 6163 and 5912 points. Once this low is established, the subsequent wave (5) should propel prices above resistance at 6952, marking the peak of the broader blue wave (III). Immediately after, we expect the onset of magenta wave (1), which should kick off a significant corrective phase. However, if the index continues to fall below the Long Target Zone, our alternative scenario may come into play (probability: 31%). In that case, it would suggest that the alternative blue wave alt.(III) has already completed and the major correction is already in progress.

BTC(based on NEo wave)this is not a trend-impulse...it is terminal and if it hit the limitation of wave 4 its a natural triangle and its not wave C of a flat.

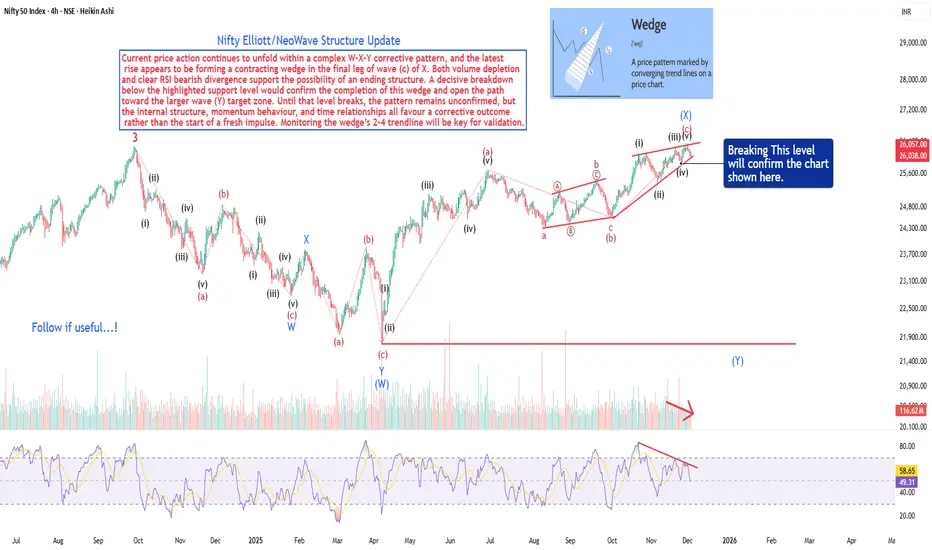
Nifty Forming an Ending Diagonal? Nifty Forming an Ending Diagonal? Key Breakdown Level Ahead #NiftyAnalysis #TechnicalAnalysis Nifty at a Critical Juncture: Wedge + Divergence Warning 🚨 #Nifty #PriceAction #Elliottwave
Current price action continues to unfold within a complex W–X–Y corrective pattern, and the latest rise appears to be forming a contracting wedge in the final leg of wave (c) of X. Both volume depletion and clear RSI bearish divergence support the possibility of an ending structure. A decisive breakdown below the highlighted support level would confirm the completion of this wedge and open the path toward the larger wave (Y) target zone. Until that level breaks, the pattern remains unconfirmed, but the internal structure, momentum behaviour, and time relationships all favour a corrective outcome rather than the start of a fresh impulse. Monitoring the wedge’s 2–4 trendline will be key for validation.
Stay tuned ! Stay Alert...! I dont want my follower to loose at the top.
x handle: @gkneowave
Disclaimer : This analysis is for educational and informational purposes only and should not be considered investment or trading advice. Market conditions can change rapidly, so always do your own research and consult with a qualified financial advisor before making any trading decisions. I am not responsible for any losses incurred based on this analysis.
Mastercard: Further Downside Pressure? Mastercard extended its recent bout of weakness, briefly dipping below support at $527.33 before quickly rebounding. In our primary scenario, we anticipate that the sell-off will continue along magenta wave (4), likely driving price into our green Long Target Zone between $493.51 and $453.69. Alternatively, it’s possible that the turquoise wave alt.2 has already been completed. If so, a direct breakout above $623.64 could occur, which would invalidate our Target Zone (probability: 35%).

BTCUSD can crash to 24k if ABC correction occurs BTC experiencing the effect of Dead cross at 110000 USD ,which can drag upto 74500 and a support can take place due to price convergence and RSI divergence setup.
If price bounce backed from 74500 around ,then it can reach 0.386/0.618 around 106000 and 108000 USD.
A third try to breach 74500 can break the support and can take leap towards 24k making it drag down of 82% which BTC achieved back in 2017- 2018 .
Disclaimer: this is purely based on previous trends study and speculations according to price moments .i recommend to make your own study before investing or consult your financial advisor .

Hellena | GOLD (4H): LONG to resistance area of 4382(Wave 3).In the past forecast, many have rightly pointed out that wave “4” went behind the high of wave “2” and yet we are not dealing with a diagonal.
This means that the waves have stretched and have a larger range of motion and now the correction in wave “2” is ending.
Essentially the upward movement is still prioritized and I expect two scenarios:
1) Continuation of the upward movement to the resistance area of 4382 (market entry)
2) Reaching the support area 3994.4, after which the correction can be considered complete and only then the movement to the area 4382 will start.
Manage your capital correctly and competently! Only enter trades based on reliable patterns!

Hellena | EUR/USD (4H): SHORT to the MIN of wave "3" 1.14647.We continue to monitor the decline in downward momentum. In the last forecast the target was almost reached, but the correction turned out to be stronger than we thought, which does not cancel the forecast, but just gives us an opportunity to enter a short position once again quite favorably.
I expect that the small wave “b” is either over or almost over and the price is about to start its decline to the support area at 1.14647.
This movement should be a confirmation of the completion of the large correction (red) “ABC”.
Manage your capital correctly and competently! Only enter trades based on reliable patterns!

Solana: Is the Bottom In, or More Downside Ahead? SOL has already climbed more than 15% from last Friday’s low at its peak, potentially signaling the completion of wave ii in orange. For now, however, we’re still keeping open the possibility that this move could dip to a new low—within our green Target Zone ($155.80–$113.20). In any case, once this interim correction wraps up, wave iii in orange should kick off an impulsive rally, only losing steam above resistance at $295.31.

GBP/USD Signals Trend Shift – Impulsive Upside ExpectedThe chart shows that GBP/USD has completed a full W–X–Y corrective pattern, with the final wave (y) and its C wave forming a clean bottom near the long-term support line. From that low, price has started a strong upward move, which looks like the beginning of a new impulsive Wave 1. The current pullback toward the 0.382–0.618 Fibonacci zone is typical behavior for a Wave 2 retracement before the next strong rally. As long as the price stays above the invalidation level at 1.30094 (the wave (y) bottom), the bullish scenario remains valid. This suggests that GBP/USD is preparing for a larger Wave 3 push to the upside.
Stay tuned!
@Money_Dictators
Thank you :)

XAUUSD – Ascending channel in play, eyes on the 4,240 regionXAUUSD – Ascending channel in play, eyes on the 4,240 region
Brian – Buying the dip within structure, watching for a fade at higher resistance
Market overview & structure
On the H4 chart, gold is trading neatly inside a well-defined ascending channel, printing higher highs and higher lows. The current leg is pushing up towards the 4,237–4,240 area, which lines up with:
The upper boundary of the channel
A key resistance zone
The 1.618 Fibonacci extension and resting liquidity above recent highs
So for now, the broader bias remains bullish, but as price creeps closer to 4,240, the risk of profit-taking and short-term selling naturally increases.
Wave & technical context
This move is an extension of the previous bullish structure after price broke out of the old descending channel and started to build a new bullish one.
Liquidity levels around 4,193 and above suggest the market has been building positions and still has room to drive price into the higher resistance band.
The buy zone around 4,154–4,157, near the lower edge of the channel, is where buyers are likely to step back in to defend the trend.
As long as price holds above 4,150–4,154, the continuation scenario towards 4,240 remains the higher-probability path.
Key zones & trading plan
Primary scenario – Buy with the trend
Buy zone: 4,154–4,157 (channel support + marked buy zone).
Idea: Wait for a pullback towards the lower boundary of the channel, or a brief liquidity sweep into this region, then look for a clear rejection candle on H1/H4 before going long.
Targets:
Short term: 4,190–4,200 (mid-channel / interim liquidity).
Extended: 4,237–4,240 (major resistance + 1.618 Fib extension).
This is a trend-following “buy the dip” setup, more suited to swing and short-term position traders rather than scalpers.
Secondary scenario – Short-term fade from 4,237–4,240
Sell zone: 4,237–4,240 – confluence of strong resistance and the 1.618 Fibonacci extension.
Idea: If price tags this zone and shows clear rejection (long upper wicks, bearish reversal pattern on H1/M15), it may offer a counter-trend short back towards the middle of the channel or the 4,190–4,200 support area.
As this is a counter-trend play:
Keep position size smaller than the main long idea.
Use a tight stop above 4,240 and avoid widening it out of emotion.
Macro and liquidity backdrop
Liquidity is likely to thin out towards the end of the session with the US Thanksgiving period in play, which can lead to the odd sharp spike or stop-hunt, especially around obvious liquidity pools.
On the political front, headlines such as Mr Trump’s comments about “permanently suspending immigration from third-world countries” add to broader policy uncertainty, but the impact on gold is indirect via risk sentiment rather than a direct driver.
It’s also worth noting that silver has been rallying strongly, supported by solar-related demand and supply concerns – a bit of a “silent workhorse” at the moment. That doesn’t remove gold’s role, but it does show that precious metals as a whole are attracting capital.
Strategy & risk management
For now, my focus is on buying dips around 4,154–4,157 in line with the ascending channel, and only looking for tactical shorts if price clearly rejects the 4,237–4,240 band.
I prefer not to open fresh trades when US liquidity is extremely thin or straight into major holiday sessions, as spreads can widen and price can behave erratically.
If we see a decisive close below the buy zone and a clean break of the channel structure, this bullish plan is invalidated – at that point it’s better to step aside and reassess rather than forcing trades.
What do you reckon – does this structure still favour the bulls, or are you leaning towards a deeper correction from the 4,240 region? Feel free to share your view in the comments.

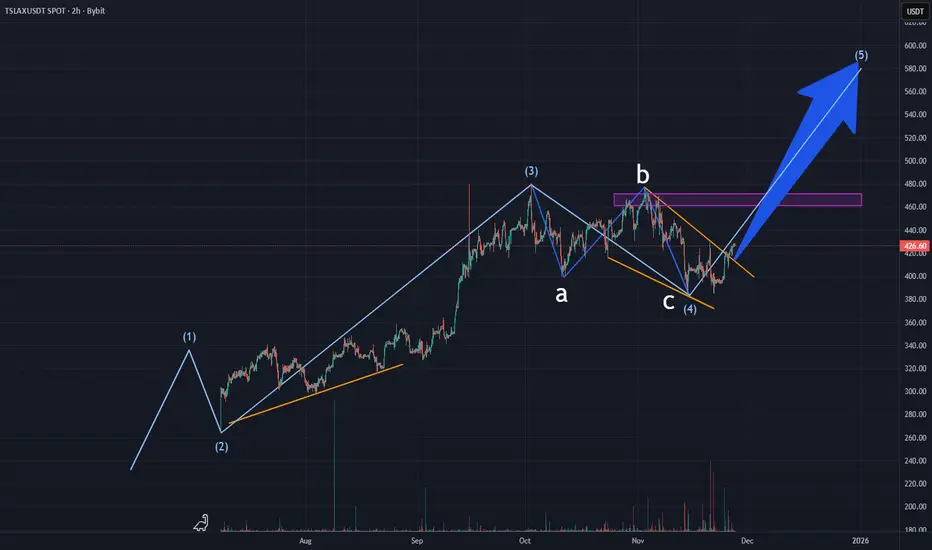
Tesla stock analysis based on Elliott WaveTesla (TSLAX, TSLA) is forming its 5th full wave of growth according to Elliott Wave Theory.
Unfortunately, the chart on TradingView is incomplete; it was created based on other sources and then transferred to TV.
ABC corrective waves (marked in blue) were most likely formed.
Above, we also see an area of liquidity that is more likely to be taken.
According to wave 3, we can predict the length of wave 5 to be around 20%.
As is well known, stock movements last somewhat longer than cryptocurrencies, and this should be kept in mind.
If the price forms a low lower than the start of wave 4, this wave structure will be considered broken, and the price may move downward.
Full breakdown on website