GBPNZD pullback to key higher TF MAsWaiting to see if GBPNZD pulls lower into these 3 higher time frame moving averages. The daily 200SMA, weekly 50SMA and monthly 10EMA have lined up for what could be a glorious long setup. 1H & 4H RSI oversold with the daily nearly in this area as well. Watching closely.
EMAS

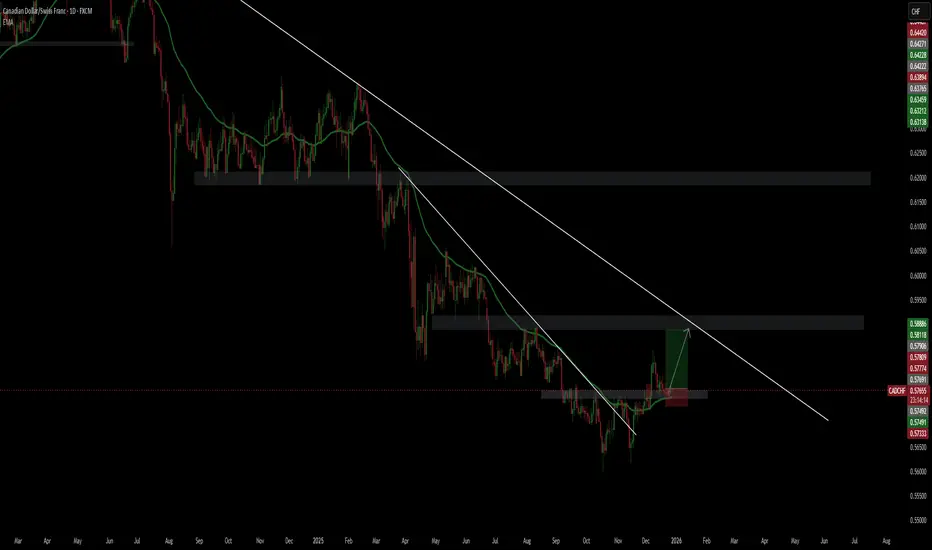
CADCHF LONG SCENARIO Here I'm using a slightly different approach.
So I'm using a 1:3+ RR and not the usual 1:1, because this is kinda different setup and here I'm combining the breakout of the minor resistance zone, which is now a support zone + the breakout of Daily 50 EMA + the breakout of the internal descending trend line (DTL).
Now is retesting all of these 3 indicators with SL not so far below and TP is the Weekly 50 EMA + minor zone + touch of the bigger weekly DTL (I'll put screenshot of the Weekly chart).
!!!- I already have an open trade from 22.12 from around this level here and I'm using only 0.4 risk for this trade, because it's a bit different from my strategy, but I like how the setup looks and everything is adding up perfectly + it's a clean setup.
BTC’s OCD means EMA by NYEWe all know the market has a little OCD. Certain levels it just has to touch before it’ll allow the next move.
On the monthly BTC chart, that level looks like the 9 EMA — and it’s lining up as a likely “must-tag” into month’s end.
Here’s the key observation:
• The monthly 9 EMA has been sliding down ~$2k–$3k per month.
• It’s already dropped from just over $100k last month to a little over ~$98k this month.
• Meanwhile, this month’s high / top wick area is ~94,500.
So right now there’s a gap: 9 EMA above, price wick below.
For the 9 EMA to “touch” the top of this month’s candle (~94,500), one of two things has to happen:
1. EMA drops to price (hard), or
2. Price rises to EMA (much easier).
To get the EMA to drop several thousand more this month, BTC would need a major dump (think the kind of move that drags the average down hard — i.e., ugly). That’s possible, but it’s the less probable path compared to a tag from price.
I built a simple little calculator/tool on my chart that estimates what price would need to do for an EMA tag — and based on that, the cleaner path is BTC pushing higher into month-end to meet the 9 EMA, then potentially setting up the next move (including a possible January fade).
We’re already in the final week of the month, and the tape is starting to look like that “EMA magnet” move could be underway.
Bias: Looking for a long into the 9 EMA tag into year-end — with eyes open for a potential January reversal setup after the touch.
Merry Christmas — consider it my gift to the chart watchers 🎁

NZDUSD testing high resistance moving averagesNZDUSD has rallied to a series of moving averages that have the potential to create a great short opportunity. Similar to the usual BorrowedClothes plays, the pair has already rejected the Monthly 10EMA, and is now testing the weekly 20SMA and 50SMA below. With the 4H RSI overbought and a generally hawkish tone from Powell after Wednesday's fed rate decision, there's a chance this rally will correct which could lead to good profit. Of course I could be wrong. The markets do what they want to do.

XAUUSD PATHThe possibility that will occur with gold is a temporary surge caused by uncertainty or due to the liquidation of traders who use excessive leverage. We know that after this FOMC meeting, the direction of the US economy will become clear, although there are many other factors such as global tensions between China and Japan, which have recently caused uncertainty, Japan's interest rate hike, the unresolved conflict between Iran and Israel, and the unfinished peace agreement between Ukraine and Russia. However, looking at several catalysts for 2026, I believe gold prices have already been priced in. My analysis may be incorrect if gold manages to break through the $5,000 mark due to increased uncertainty. However, what is currently visible is that 2026-2027 will be a year of weakening and ranging prices for gold. Therefore, take advantage of this for short-term trading with proper money management so that you can beat the bookies.
I hope my analysis is helpful to you.
Please leave your questions and comments.
I will try to respond to them.
Good luck

Bitcoin Weekly: The EMA 50 Test🎯 Why the EMA 50 Matters
The 50-week moving average is a simple trend line that traders watch:
✅ Trend signal – If price stays above it, the trend is up. Below it, the trend is down.
✅ Support/Resistance – It acts like a magnet that price bounces off.
✅ Everyone watches it – When many traders use the same level, it becomes real support.
📈 Scenario 1: REJECT (Price Goes Down)
Bitcoin bounces down from the EMA 50
Price falls back to ~$85–92K
Trend weakens temporarily
What to look for:
Weekly close below $99,553
Lower highs on daily chart
Selling pressure increases
📉 Scenario 2: BREAK (Price Goes Up)
Bitcoin closes above EMA 50 with strength
Price continues toward $120–128K
Trend stays strong
What to look for:
Weekly close above $99,553
Strong volume on the push up
Higher lows forming
🔮 Most Likely Outcome: DOWN FIRST, THEN UP
Probability:
Reject now: ext 1–2 weeks
Eventually breaks higher: ~70% (next 1–2 months)
📌 Simple Trade Plan
If you're bullish:
Buy dips near $85–87K (the blue line)
Stop loss below $83K
Target $120K+

XRPUSD testing monthly 20EMA supportCritical area for XRP bulls. If the Monthly 20EMA holds (overlayed on this 4H chart) we could see price retrace to the high 2.20s/low 2.30s to test the resistance at the Monthly 10EMA. Needless to say that the RSI is oversold on multiple time frames but with the algorithm set to "sell off" the RSI has become useless for now. As always, on a play like this, tight SL and sniper entries.

BXY approaching weekly 50SMA & monthly 20EMAThe pound is due for a rally as it is nearing critical SMA and EMA. The algorithm presumably has to test these moving averages before higher highs. If support holds, all pound pairs should see some bullish momentum.

GBPCAD Weekly 50SMA testPrevious idea failed at the 200SMA which is why tight SL was key. Now testing a stronger support at the weekly 50SMA and a daily support level dating back to early August. Tight SL for this kind of play. Fundamentally, BoC rate cut today should play a factor in the long hypothesis but the conference after the rate decision leaned towards a hawkish stance.

GBPCAD daily 200SMA testPair is reaching the daily 200SMA (overlayed on this 4H chart). Looking for a bounce here into tomorrow morning, BoC announcing an expected rate cut, could send longs if forecast is met. Hourly RSI oversold, 4H RSI entering oversold territory. Simple play, tight SL.

AUDCAD potential long setupLooking at AUDCAD this morning and noticed the 3 bounces off the Monthly 50EMA (overlayed on this 4H chart). The pair is stuck in a wide range after a strong September rally linked to the gold (commodities) strength and above forecast AUD economic data. The pair is also sitting at a critical trend line support while RSI is positioned well for a move upward.
Fundamentally, precious metals are erasing Friday's losses while a meeting between President Trump and Australian PM Albanese is set to take place Monday morning to discuss a critical minerals deal (among other topics), which could boost the AUD significantly. In the meantime the Canadian government continues to follow Brussel's lead in economic obliteration and CAD insignificance.
I could be wrong, I'm a nobody.

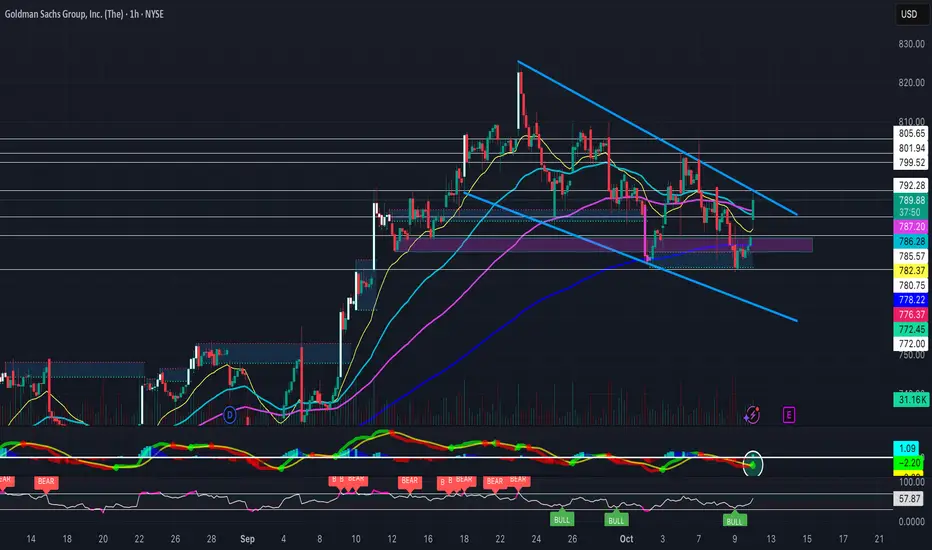
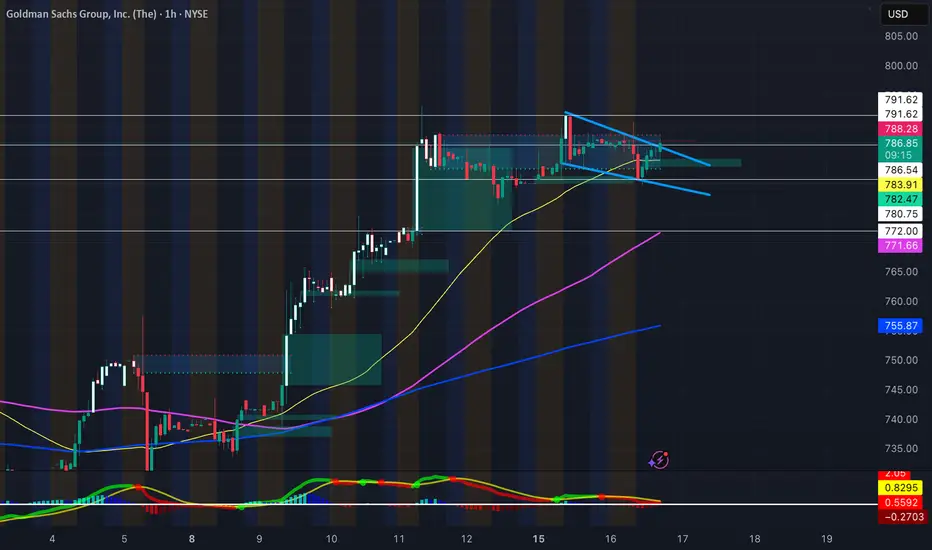
Falling Wedge Heading into EarningsAfter previously breaking out of a falling wedge to hit new ATH's, NYSE:GS is holding yet another falling wedge heading into earnings next week. (Previous Chart Below)
Its EMA's are curling upwards, some bullish hidden divergence on the RSI, a MACD golden cross, and a bullish FVG formed as support- Will definitely be watching this one.
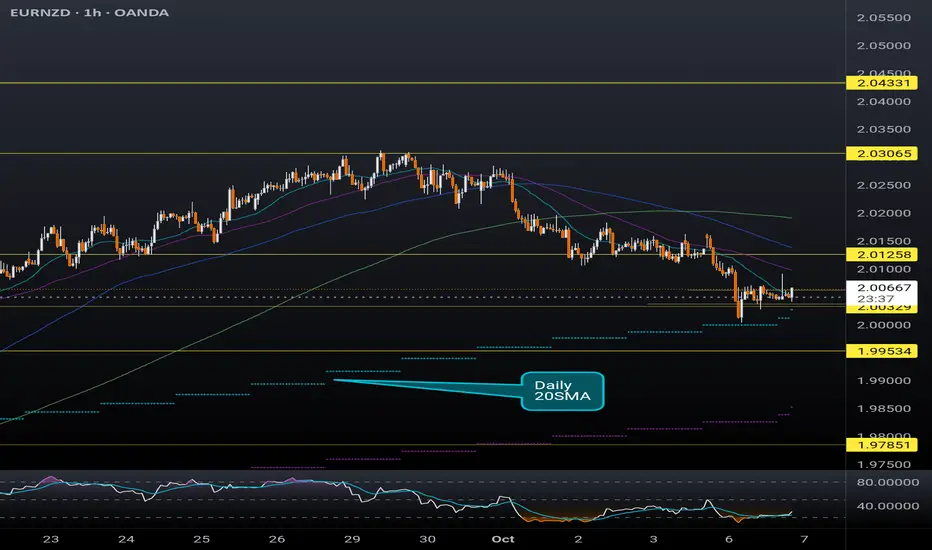
EURNZD finding support at the daily 20SMASimilar to the previous 2 posts regarding GBP pairs, EURNZD is currently riding support at the daily 20SMA (overlayed on this 1H chart). The hourly RSI is also indicating this pair is oversold. RBNZ is expected to cut interest rate tomorrow by another 25 basis points which could be the catalyst to realizing this potential bullish move. Recent weakness in the NZD came after the latest interest rate cut, and if further dovish comments follow the interest rate decision tomorrow, this pair could retest the 2.03xx high hit in late September.
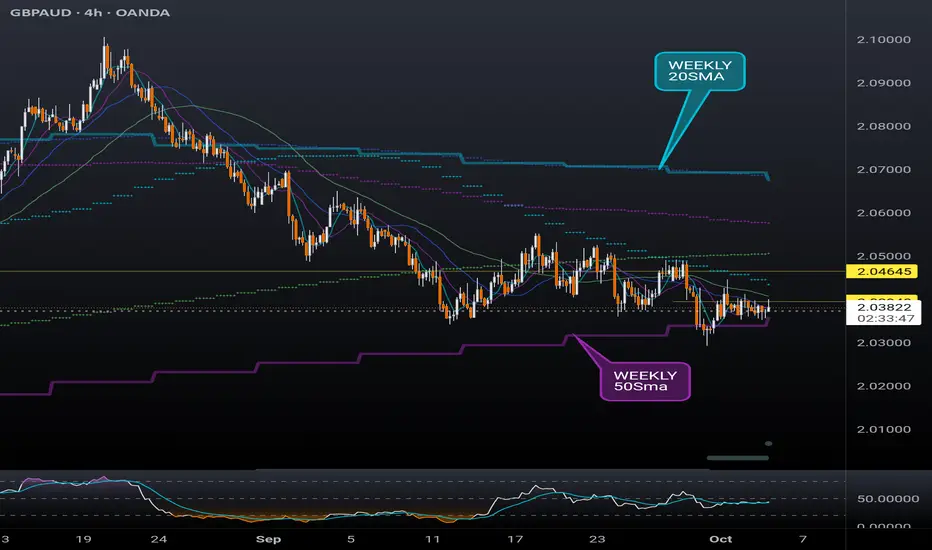
GBPAUD finding support on Weekly 50SMASimilar to the previous post regarding GBPJPY, the British pound is finding support at the weekly 50SMA (overlayed on this 4H chart) after a long sell off indicated in the RSI. Cautiously bullish on GBPAUD considering recent strength in the Aussie dollar due to gold hitting new ATHs (and commodities rallying in general). Approach this with expectations of lots of rejections and chop as price action breaks through the daily moving averages wedged between the 50 and 20 weekly SMA (daily and weekly SMAs overlayed on the 4H chart). This could potentially bounce to retest the weekly 20 currently at 2.06 area.
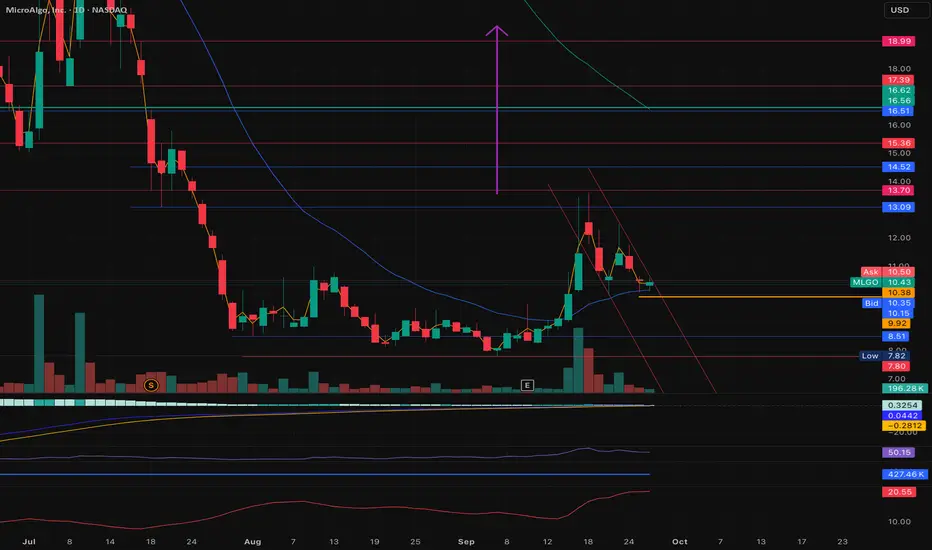
MLGO is heatting up for 57%+ upside potential !Looking at the current trend on the Daily Chart, we see there are three possibilities on MLGO:
1.
It can breakDown from the current support of ema20 to re-test the RED downWard channel to further downSide.
2.
From the end of July'25, a healthy depth of Cup was being formed which peaked to $13.6 from the ytd_Low $7.82 and then kept re-testing ema20 as it's support between $10-$10.6 area for last few days which now looks like a strong Handle. If this ema20 or support of $10 does not break with the current surge in Volume, surely this Bullish Trend can complete a successful Cup&Handle outcome touching around $19.5 which is a solid 85% from current price.
3.
It's been almost two Quarters starving to touch ema50, which is apparently a due with the current level of Volume since the last Reverse Split.
-We've also seen a similar Bullish CrossOver between ema5 and ema20 on early July'25 when after the CrossOver ema5 worked as a Resistance for a few days before the price pushing through for 75% upSide. We're currently at the exact same situation except ema50 is much closer within the range.
-Volume Profiling shows there is significant amount of Buyers/Sellers right above current ema50 price target which can cutDown/disContinue this bullishNess to below 57% from the current price level.
Considering all 3scenerios above, stop-loss is at-least at $10 to minimize the loss from this Paper-Trading concept.
This is not a buy/sell advice, rather shared to learn from others' opinions on MLGO chart.
Nifty 50 Chart Analysis: Key Support, ResistanceGet the latest insights into the Nifty 50 as markets brace for action! As of today, September 25, 2025, at 03:15 PM IST, our technical analysis dives deep into the Nifty 50's recent performance, spotlighting critical support and resistance levels, and offering a bold prediction for tomorrow, September 26, 2025. Buckle up for a data-driven breakdown that could shape your trading strategy!
EMA Insights: Riding the Trend Waves
The Nifty 50 chart reveals a fascinating dance with its Exponential Moving Averages (EMAs). The 20-period EMA hovers around 25,042, acting as a short-term pivot, while the 50-period EMA (25,040-25,132) and 200-period EMA (around 25,132) underpin a broader bullish trend. Recently, the index dipped below the 20 EMA, signaling short-term weakness, but its position above the 50 and 200 EMAs keeps long-term optimism alive. Watch for a potential bearish crossover that could trigger further declines if momentum shifts.
RSI Breakdown: Neutral Territory Holds the Key
The Relative Strength Index (RSI) stands at 52.17, placing it in neutral territory (45-55). This balance suggests no immediate overbought or oversold conditions, with recent bearish candlesticks hinting at caution. An RSI above 50 still supports consolidation, but traders should stay alert for any breakouts that could signal the next big move.
Support and Resistance Levels to Watch
Key support levels are emerging as critical battlegrounds. The psychological mark of 25,000, reinforced by recent lows, offers immediate cushioning, with stronger support at 24,900 (aligned with the 50-day EMA and 50% Fibonacci retracement). A deeper drop could test 24,400. On the upside, resistance kicks in at 25,600 (past highs) and 25,630. A breakout above 25,600 could ignite bullish momentum, while a fall below 25,000 might accelerate selling toward 24,900.
Tomorrow's Market Prediction: What to Expect
Looking ahead to September 26, 2025, the Nifty 50 is poised for a cautious start, likely consolidating around the 25,000 support. A close below this level could spark a decline toward 24,900, fueled by recent EMA softness. However, a rebound from 25,000-25,042 (20 EMA) with strong volume might push prices toward 25,600. The bias leans neutral, with global cues and an opening above 25,100 as key bullish triggers. Stay tuned!
This analysis blends cutting-edge technical tools with real-time market vibes, making it a must-read for investors and traders alike. Bookmark this page for updates, and let’s navigate the Nifty 50’s next move together!

Long GS Falling Wedge FormingFalling wedge forming on NYSE:GS hourly, with NYSE:GS bouncing off its 50-day SMA. It's EMA's are curling upwards, and a bullish FVG formed as support. With pending FOMC conference tomorrow and potential rate cuts, certainly will be watching NYSE:GS
PT1 - 790.40
PT2 - 794.50
PT3 - 798.90
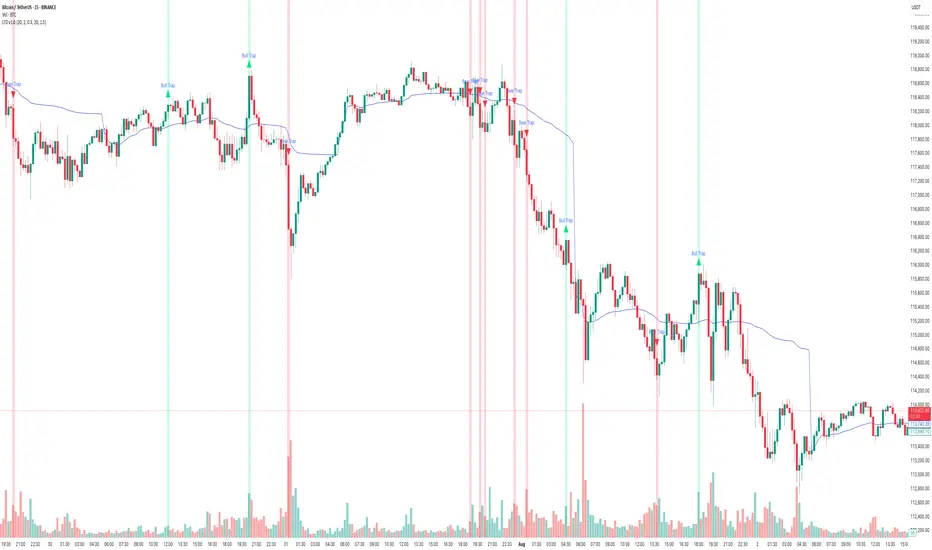
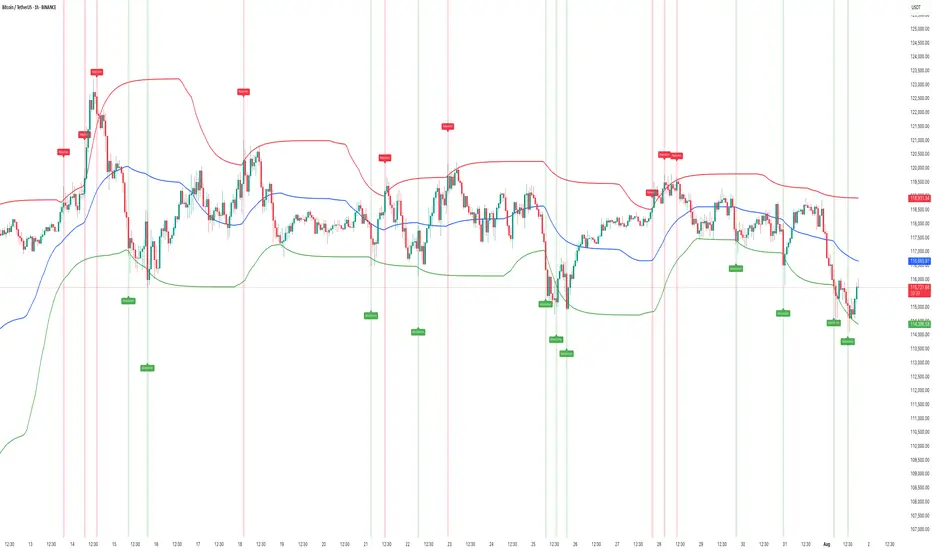
How to use Free TradingView Indicator to detect Liquidity TrapsPerformance on Shared BTC/USDT Chart
Indicator : Liquidity Trap Detector (LTD)
Timeframe: 15-sec (as per chart)
Observation Period: Full session visible in the screenshot
1. Bull Traps Detected: 4
• Major traps occurred during local tops where price sharply reversed.
• Example: ~19:15 and ~21:00 marked strong reversals after fake breakouts.
2. Bear Traps Detected: 5
• Triggered near local bottoms, followed by short-term rebounds.
• Example: ~22:15 and ~00:30 triggered after sudden downward sweeps.
3. Accuracy:
• Approx. 70–75% of traps correctly led to meaningful reversals.
• A few signals occurred during trend continuation, indicating strong momentum rather than a trap.
4. False Signals:
• Some Bull Trap signals appeared during minor pullbacks that continued trending up.
• Filtering with cooldown periods or trend filters (e.g., EMA alignment) can reduce noise.
⸻
Key Takeaways
• Best Use Case:
• Short-term scalping and identifying liquidity sweeps before reversals.
• Works well in ranging or high-volatility conditions.
Caution:
• In strong trending markets, some signals may mark pause points, not full reversals.
• Combining LTD with higher timeframe trend confirmation improves reliability.
HOW TO Spot Liquidity-Driven Reversals & Market TrapsAdaptive Liquidity Pulse
🎯 Spot Liquidity-Driven Reversals & Market Traps
The Adaptive Liquidity Pulse is designed to help traders detect high-volume rejections and absorptions, revealing where big players are likely defending or accumulating positions. This indicator is especially useful for spotting market traps, liquidity sweeps, and swing reversals.
⸻
🧠 How It Works
1. Dynamic Liquidity Zones
• Red Band (High EMA) → Potential supply/rejection zone
• Blue Band (Mid EMA) → Equilibrium / magnet zone
• Green Band (Low EMA) → Potential demand/absorption zone
2. Signal Labels
• 🔴 Rejection → Price spikes into high liquidity with volume → Bearish bias
• 🟢 Absorption → Price flushes into low liquidity with volume → Bullish bias
3. Volume-Weighted Detection
• Only triggers signals when volume exceeds a configurable threshold
• Filters out weak moves, highlighting true liquidity events
⸻
📊 Best Use Cases
• Scalping & Intraday Trading: Identify early reversal points
• Swing Trading: Track absorption/rejection cycles to time entries/exits
• Liquidity Sweep Detection: Spot where false breakouts occur with volume confirmation
⸻
⚡ Trading Tips
• Use Rejection (Red) for short entries or take-profits near highs
• Use Absorption (Green) for long entries or short exits near lows
• Combine with support/resistance zones or trend structure for higher accuracy
• Midline (Blue) often acts as a mean-reversion magnet in ranging markets
⸻
📢 Alerts
• 🔴 Rejection Alert → Strong selling pressure at liquidity zone
• 🟢 Absorption Alert → Heavy buying at demand zone
⸻
🧠 Why Traders Love It
• ✅ Visualizes hidden liquidity interactions
• ✅ Highlights trap zones before reversals occur
• ✅ Works across crypto, indices, forex, and commodities
• ✅ Designed for confluence with other strategies
⸻
This script gives you a real-time pulse of liquidity shifts, allowing you to trade like institutions and avoid falling into retail traps.
⸻
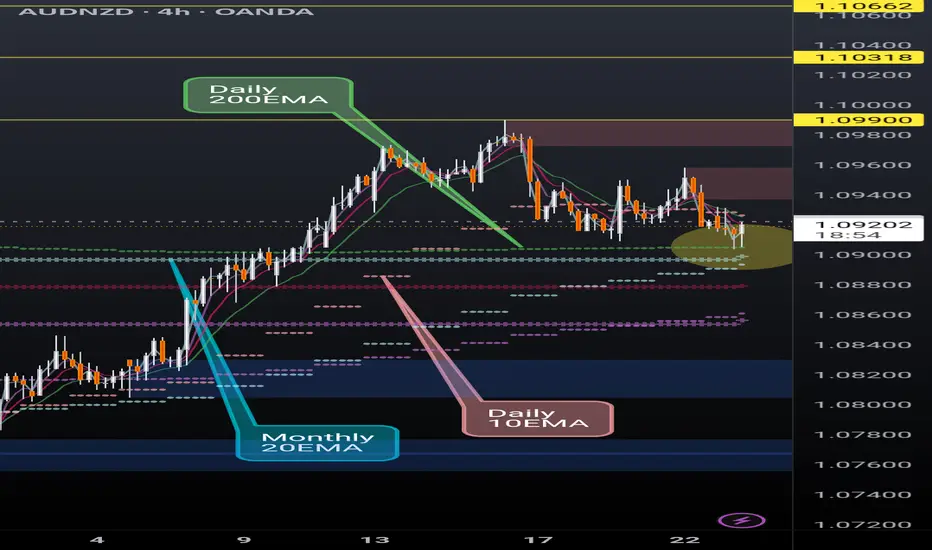
AUDNZD finding support on critical EMAsAUDNZD is finding support at the daily 200EMA (overlayed on 4H chart) and, more significantly, above the monthly 20EMA (overlayed). Break and hold the daily 10EMA (overlayed) will be key.
If the momentum continues we could see a continuation of the ongoing rally however recent AUD monetary policy meeting minutes seemed to lean dovish.
I'm a cat not a financial advisor.
CADJPY daily 20EMA bounceSimple idea here, CADJPY is testing the daily 20EMA (overlayed on this 4H chart) and recently broke above the monthly 20EMA (overlayed)... if price reclaims the daily 10EMA (overlayer) could be a nice move up.
Very simple trade, tight SL if entering.

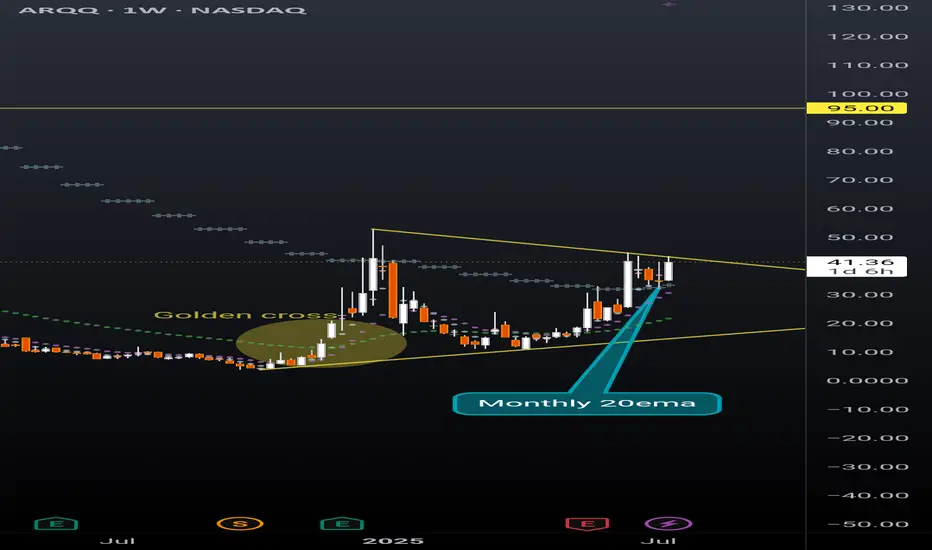
ARQQ weekly pennantBeautiful weekly pennant on ARQQ weekly timeframe. This chart is coiling nicely for a continuation. Still early in the process of reaching breakout but given the recent momentum in this sector a premature break to the upside can happen at any moment.
The ticker is currently sitting above the monthly 20ema (overlayed on this weekly chart), and just had a strong bounce off the daily 20ema (overlayed on this weekly chart). Golden cross is also highlighted that occurred in December 2024 with the daily 50ema retracing back to the daily 200ema and then continuing the uptrend earlier this spring.
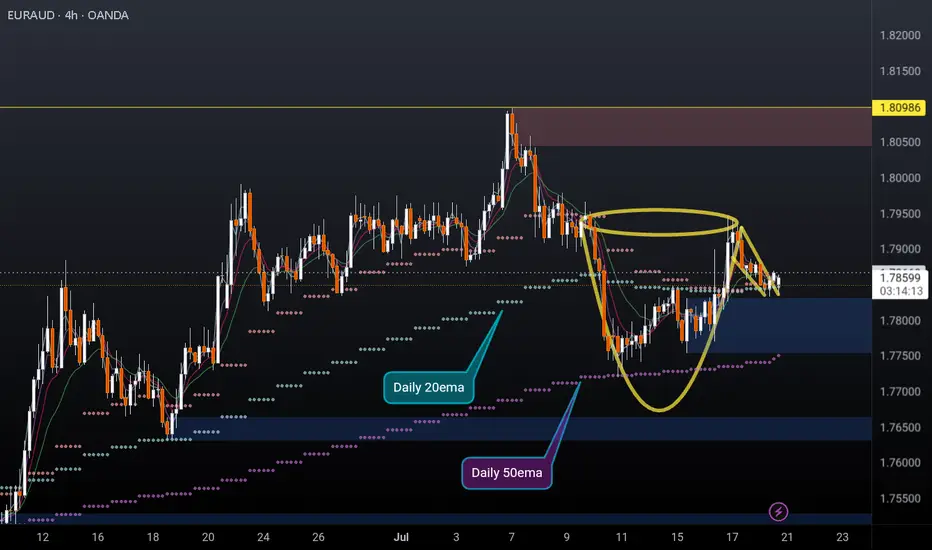
EURAUD 4H cup and handleEURAUD 4H cup and handle formed and possibly breaking out to the upside. Price recently found support off the daily 50ema (overlayed on this 4h chart) and is holding above the daily 10 & 20EMAs (overlayed).
I'm a cat not a financial advisor.