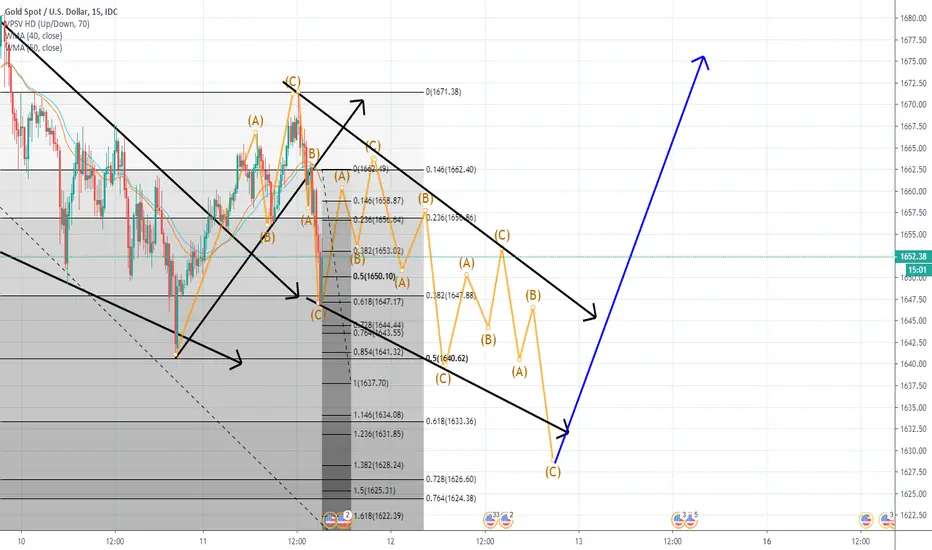
Bearish ending diagonal confirmed, target 5800This downward move is enough to change my intraday and swing trading bias to short. Chart is same as previous with target around 5800 in the green buy zone box. I actually am long term bullish on this and ultimately looking to buy if it squeezes in that box.
However that probably won't be for a few days if not a few weeks. The lower bollinger band will be both an exit area for shorts and entry area for long term buys.
I am not opening an actual short trade here yet but will be scalping in that direction and probably not updating TV with every trade I do. This is just a note of my bias.
Ending Diagonal

Could reach 23 - 24$ again.A failure swing low what I would like to seem. Even I don't know which type of correction has been underway in wave 4 (it could be Triangle or Flat) but whichever it is I expect to see a downward movement to retest the low near 20$ again.
Ideally, the oil won't move above 28.24 - 29.13 resistance zone until it reaches 23 - 24$ price zone.

Case for bearish ending diagonalI have my doubts about the recent bullishness. It's hard to make the case that this is a perfectly flat top triangle which would be bullish.
Overall the top of the triangle has been getting nudged upward as it fills in which means there isn't necessarily a huge chunk of buy stops waiting above it to explode upward when it breaks the top of the triangle.
Instead the stops get cleared out gradually each time it makes a new high. However on the down side all the sell stops have been accumulating on the lower swings and this creates the bearish ending diagonal triangle shape. I will probably scalp long on the short term but am treating it only as a capitulation 5th wave.
I think there's a pretty good chance that it will drop lower. Basically retesting the x point around 5800 would make the price action look healthier for a move upward.
I actually have a small scalp long from a trade earlier today which I have mostly scaled out of and am letting the final portion run but I don't think this particular trade is the one that's going to the moon.

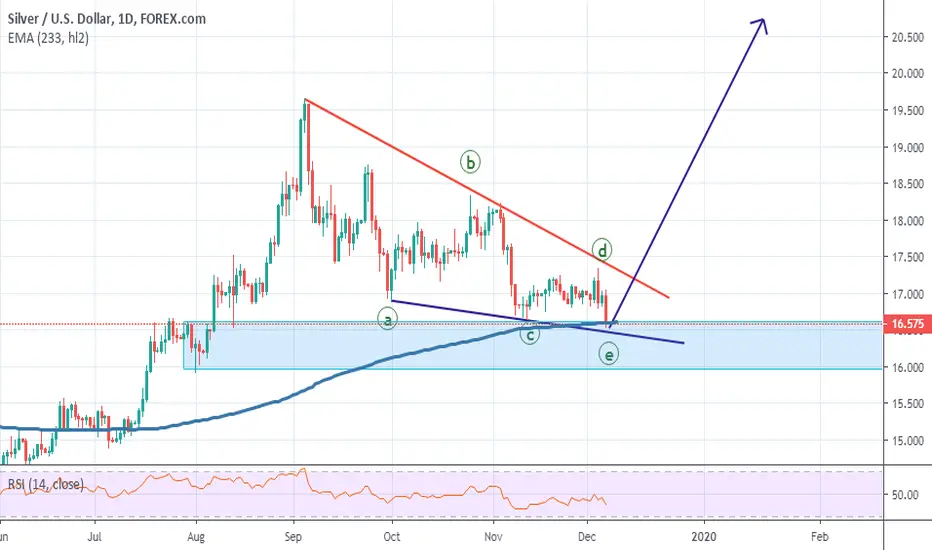
Oil has a great run.Oil is close to its top. There can be one more push up but if the lines break then a B correction will have been underway.
I am looking for a top. I have closed my long position already.

Bear side is favoredFailure swing high indicated me to open an early short in AUDUSD. This is the first position.
If the price fall below 0.6024 then I will be strengthened, and I will search the next high probability trade set up.


GBPJPY - Is there a Throw over?There is an RSI divergence between wave 3 and 5 in an ending diagonal.
I am waiting for a trendline break down and the GBPJPY will go through 1.3217.
If this condition will be then a dramatic fall could happen and the GBPJPY could reach 127, 124 support levels.

Gold UpdateGold is sporting a ending diaganol pattern which suggests a rally to new highs for the year and possibly to new all time high. and beyond.
An ending diaganol at this point so close to the trend high is very strange and seems to suggest that we may be in the early stages of Hyperinflation!
$2000 to all Americans......hmmm .... Isn't it funny how charts setup the news!

it will form triangle down again...called ending diagonal (google it)
cannot predict... at least see 1633 as good target
Bearish Trend on niftyNifty in Ending diagonal which is coinciding with Downside RSI range shift.......If Nifty goes below 11000 levels than we might see big Down Trend on the chart

AUDUSDAUDUSD is now in the big wave and on the H4 chart we will find that its contain from 5 waves comes as ending diagonal.
The pair is expected to go up to make wave 2 from the 5 waves
This scenario confirms after break the 0.6940 level

EW Analysis: DASH Is Showing Bullish EvidencesHello traders!
Today we will talk about cryptocurrencies, specifically DASH in which we potentially see the bottom and bullish reversal.
Well, what we have noticed in the Crypto market is that we usually see some trend changes at the end of the year. Let's take Bitcoin for example; BTC topped at 20k at the end of 2017, then bottomed at 3k at the end of 2018 and now at the end of 2019, we may see another trend change, ideally to the upside after a complex corrective decline in the second half of 2019.
Anyway, let's talk about Dash. Dash was not so strong like BTCUSD in the beginning of 2019, which has later, in the second half of 2019 caused bigger and much more impulsive decline back to 2018 lows, mainly because of BTC dominance, while BTCUSD was trading just in a corrective downtrend. But now, at the end of 2019 and in the beginning of 2020 seems like we may see a bullish reversal once again, so let's go through some evidences.
The first evidence is that DASH might have completed a big five-wave decline from June 2019 highs.
The second evidence is that DASH formed a big an ending diagonal (wedge pattern) into the final wave 5.
And the third, the most important evidence is that we can see a five-wave bullish turn from the 38.00 psychological target level, which confirms more upside at least for wave "c"or "iii" after pullback in wave "b" or "ii".
That being said, we believe that DASH can see at least a bigger recovery in three waves towards 80 area, but there's also a high probability that we may see even higher prices towards within wave "iii" this year.
Be humble and trade smart!
If you like what we do, please like and share the idea.
Disclosure: Please be informed that information we provide is NOT a trading recommendation or investment advice. All of our work is for educational purposes only.

USDJPY - Short in January (long Term)This is not a setup but this is a forecast based on Elliot Wave Analysis. Please keep in mind that no guarantee this is gonna work but it is what it is.
USDJPY has been in a long term correction, slowly but sure it creates sort of clearer movement so easier to catch it. I assume USDJPY is making an ending diagonal pattern in Weekly timeframe and its finishing Wave 5, with that being said I would love to see this pair to drop to at least 105.000. Remember that this is a long term forecast and see how it goes.

USDJPY - ABC correction is over1. It seems to be an Ending Diagonal.
2. The big picture shows us ABC correction is over.
3. Rejection from resistance zone (109.732)
4. Divergence on MACD.
Let's see what happen next ;) good luck

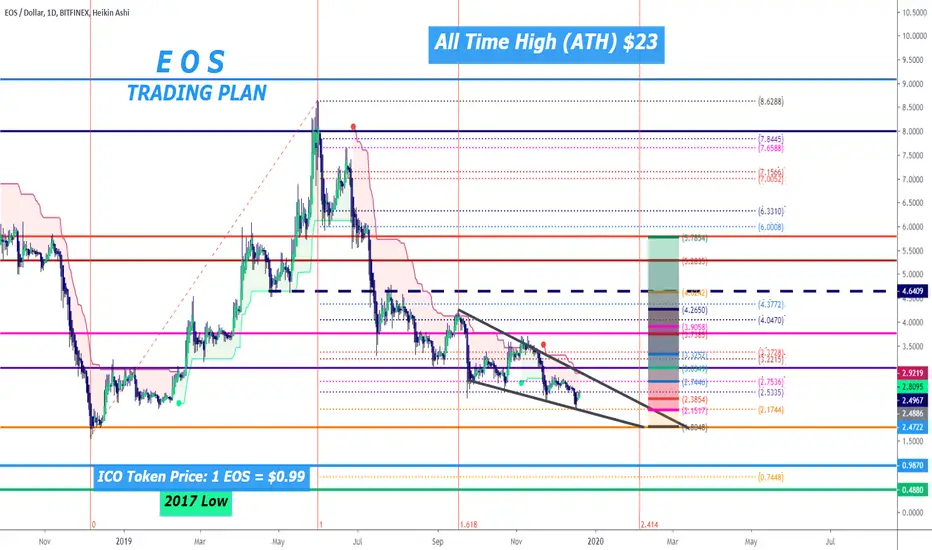
EOS EOS Trading Plan.
Disclaimer:
We are not registered or licensed in any jurisdiction whatsoever to provide investing advice or anything of an advisory or consultancy nature,
and are therefore are unqualified to give investment recommendations.
Always do your own research and consult with a licensed investment professional before investing.
This communication is never to be used as the basis of making investment decisions, and it is for entertainment purposes only.
NZDUSD: Bull Momentum Weakens - Watch For SellHi Traders,
We have a textbook ending diagonal pattern currently in progress. This is a reversal pattern and is confirmed by the loss of bullish momentum as illustrated by the RSI and MACD. Wait for a bear impulse breakout from the structure before looking for any short trades.
Regards,
Wave Theorist

USDCHF: Ending Diagonal - Signal for ReversalEnding diagonals are motive wave patterns yet not impulses, as they have two corrective characteristics (wave 4 must always enter the price territory of wave 2). ED's usually take the shape of a wedge and in all cases, they are found at the reversal points of the larger patterns, showing exhaustion of the larger movement. I usually confirm that I have an ending diagonal if I see divergence on the RSI. In many cases, an ending diagonal is usually followed by a strong impulsive move in the opposite direction of the trend.


GBPCAD Setting Up For A DipLooking at bottom of the charts, we have bearish divergence.
We also have an ending diagonal pattern about to complete.
Then a bearish Harmonic pattern in confluence with other factors.


Ending Diagonal before the Great Bull run?We are currently at the wave B of the 5th Wave of this ending diagonal. Will this be it?
