When to enter? Does it even matter?With value investing everyone knows: Buy when there is blood in the street, when a good company has a P/E ratio of maybe under 10.
But with currencies, other than the advice "50% to 61.8% fib" and a whole lot of troll "buy every bottom sell every top with the magic indicator or magic drawing on the chart" there is no common knowledge.
We can look at this recent example where the price dropped, went sideways, and then dropped hard.
We could keep looking at winning examples when selling or buying at the top of these bands or ~61.8% retracement
The only way to know how good they are is by backtesting a large number and writing down the stats.
But are there other ways to enter?
Rather than write an entire novel with chapters I will simply go through a list of screenshots
Some say it doesn't matter where you enter...
It does and it doesn't, depends what you mean by that.
First
Second
Third
Fourth
Fifth
Sixth
Seventh
Eight
Ninth
Final
This is all simplified to make my point, or points I guess.
So you can't just say "entry doesn't matter". People that tried trading, failed, got into "holy grail" safe good boy passive S&P in the last 70 years averaged bla bla bla wake me up, they're the ones saying this. Oh so it does not matter if they buy a stock at a P/E of 8 or 280?
Of course it matters!!! Entry matters!
BUT where you enter EXACTLY does not matter. I'm not sure how to put it, but go through the examples and you see what I mean. Sometimes it matters, but even if you miss it there are other ones, and these entries are going to be at least a small area "of opportunity" anyway. Well it's more complicated than a "yes" or "no". There are plenty of ifs. And plenty of ways to approach this.
Look, Warren Buffett bought too early or later and sold too early all the time. And? Most famous investor in the world. Is there an optimal super entry that gives better results than anything else? Statistically there has to be one, so yes. If we spend ages making stats and we find it do we know it will remain this particular one? Probably not... Can we find it without it just being hindsight bias? Probably not... Would having the mighty perfect entry (I didn't say find every exact bottom, that's not actually possible) make a big difference to our results? Lol you might go from 20% returns to 20.5%. Probably even less.
The endless search for the holy entry newbs seem to all be obsessed with... Fool game. It's same as with video games, Starcraft, Lol, Dota, W3. Or chess... Newbs go "I will farm for 40 minutes full eco ignore military, full Nasus q, full catch his pawns, I'll be a monster and they'll see", 15 minutes later "Ok tough guy just wait late game you will feel sorry", 5 minutes later "Victory!" or "GG easy noob", 1 minute later "Report Nasus useless afk trash ebay account". Haha I laugh every time.
They really make all the same type of newbie "late game" and "magnet logic" mistakes, 80% of retail FX goes into "day trading" because "hey I figured out I'll get more trades and therefore grow my account faster duh", "Hey you can't lose if you don't sell", "Hey I have this brilliant martingale average down", "Hey wassup wassup wassup I found a trick", "hey if I go for lots and lots of little wins, take my profit fast I'll win small but very often and scale", "hey if I run conservative robots that only return 1% but I run 500 of them...", "hey if I add all these conditions". What a circus.
Miss the good old days. Can't humiliate noobs with trading their account is secret, they open their mouths when they get lucky then vanish, and it's not a 1 v 1 or 3 v 3 or whatever it's a 1 v whole market. Even if we cooperate and share ideas it's still a 10 v 10 million or idk. There is however the "bull vs bear" thing. But the Bitcoin bulls from 2018 from 15k to 3k almost all left (losers) and the few ones that stayed pretend they won (or they're too dumb to figure out they were on the wrong side of the market). S&P 500 bear tears are pretty delicious at the moment by the way.
You both can say entry matters and entry doesn't matter and be mostly right. Don't waste too much time trying to perfect it. Calculating max risk, probabilities of drawdown, when to exit, when to hold, when to add, how to trail, correlations, those are at least as important as the entry. What I can say is entering very early, far from the stop, out of fear of missing out is bad, and entering very late for a giant risk to reward is greedy and bad. Around 50% retracement is often a good compromise. Stats will help choosing areas and price action (stats such as: over the past 10 years on breakouts would it work out to enter in the big red candle? How about on the previous low? How about 61% fib when the price reacts near the previous low? Etc).
Entry doesn't go alone, for example when you average in a sideways within a trend well you'll want to move your stop each time you add according to your average price. That's a whole other subject. Coming up with a whole strategy even simple and even once you sort of understand the markets and have the basics of price action is still clearly going to take a couple hundred hours at best... Just writing this took me a little over 2 hours, and I rushed it, and I obviously don't start from scratch I researched all of this. Just writing an intro like this about entries and stops and targets and trends and pullbacks and breakouts and timeframes and risk and all the other stuff, not even with stats, that alone probably would take 100 hours by itself. How long it takes to convince yourself to hold winners and cut losers and quit a gambler mentality however = infinite time, just quit now you'll save time (thousands of hours!), investing is not for you.
Oh and finally, an entry "signal" is a joke. You don't go from 0 to 100 "wow this would be a great buy because of this entry", that's beyond ridiculous. You are supposed to be watching something before getting in and waiting on certain conditions to enter (pullback after breakout), never heard of anyone that had "entry signals". When George Soros went short the GBP it was "because of the entry" but he had a whole theory. The "entry" wasn't a magical signal it's simply he was close to the floor, well ceiling, and had a big RR with big odds! And he explains how "I was selling weeks before", he actually "dollar cost averaged" as I explained. He didn't wait for a certain magical point, he wasn't greedy waiting for a 1 pip stop.
Entrypoint

Bitcoin / USD - Reaching $50'000 today?The price is in an uptrend for the past 3 days (since Sept. 13) and broke to the upside the descending channel it was in.
NOW
For the past few hours, the price of Bitcoin has touched several times and struggle to break the resistance at $48750. This resistance is materialized by the SSB (Leading Span B) and Kijun on the 4H timeframe.
Entry signal for a long and targets
If we close on the 1H timeframe above $48750, our first target will be $49185, and the second target $49900.
What do you think?

HUGE CUP&HANDLE JUST BEFORE LAUNCH BINANCE:RUNEBTC
Coffee time!
Hi guys!
I don't have enough time to share some ideas.
Just see another cup&handle (C&H) as we had LUNA recently,
On the picture you can see huge C&HELLO already nicely formed and ready to launch to get you some $$$.
Volume is rising and we are for the 3d time trying to get through strong mirror level which is right on 0.382 fib.
Wait for breakout of pattern
I will wait for 4h green dot on Market Cipher/Vumanchu.
Then Look on short time frame how it reacts on the top of the C&H pattern.
Target is sitting right on the 0.61fib extention from the whole move of RUNEBTC pair where is also spike on volume (VPVR indi).
First stop should be around 0,5 fib extention where is big spike on volume also.
If you find this useful then give like to this post and comment. Thanks!
Good luck!
M
This is not any financial advise, always check the market before entering any position.

NULS USD Bullish Continuation Soon --14 X + PossibleNULS has finished it's long retrace after its initial 24x from the bottom back in March 2020, and it looking to rise upwards once again.
Measuring with the Fibonacci tool after it's long retrace I am finding a possible mid term target of $7.20 per NULS, from it's current price of $.50 that is greater than 14x Gains.
The RSI has a long bullish trend and is at the buy zone again currently.
The Stoch RSI is oversold and indicating a good entry.
NULS has found support on the Moving Averages as well as Historic support from previous Tops.
Nuls is a buy currently, as it should soon go bullish.
Targets
$2.43
$7.20
Higher targets should follow $15 is likely over the longer term, and possibly higher.

i use rsi and macd .. to enter the trade can i add anything else for more better trading
and also what can i use for perfect exit

PYPL Bullish SqueezePYPL has displayed a combination of bullish signals indicating we may see a great bull squeeze, allowing for a great entry. Our first indication that a squeeze was coming was our VPCI indication showing us that the current trend is supported by volume. The Stupid Willy also displayed a buy signal while the squeeze indicated bullish momentum needed for a squeeze. I believe this is a great place to enter, to potentially test the 309.80 resistance since the daily time frame also indicates bullishness(VPCI+Willy).
Bullish Signals
-Squeeze Indicator
-Stupid Willy
-Fibonacci Support
-VPCI
Price Target/Resistance
-309.80

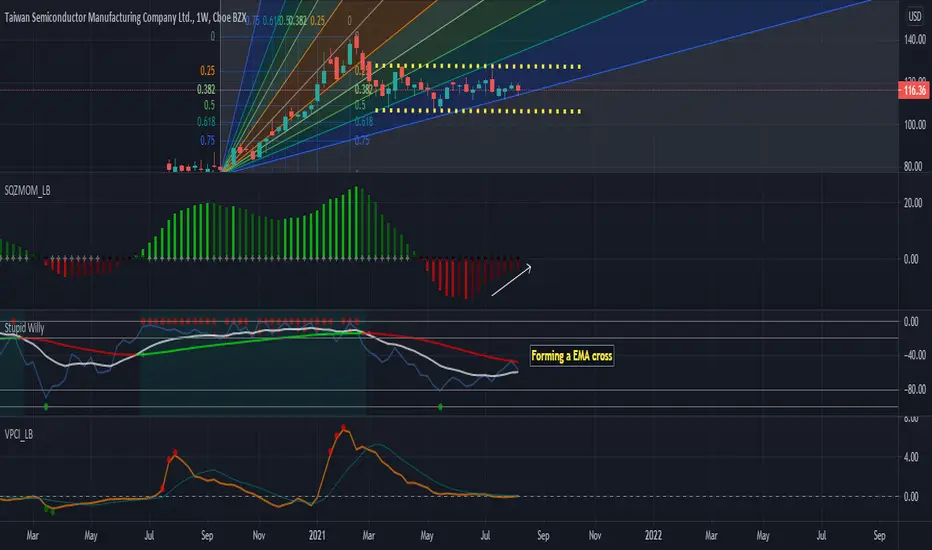
TSM bull entry(setup)Although TSM has been consolidating, it has displayed signals of a bullish move. I think we are seeing a great entry to be taken at the current price since we are seen to be resting at a Fibonacci Support for an even greater chance of an up-move. Not only are we testing a support but we have seen reductions in selling momentum, while also getting signs that emas on the Willy may crossover. We have seen TSM continue to test the resistance of 127 so I believe that is a great target for profits, although I believe we are going to break through that since we are seeing a potential squeeze to be had.
Bullish Signals
-Squeeze indicator
-Willy Oscillator
Price Target
-127
NASDAQ SHORTS ONGOINGDue the high confluence on the actual zone, we can expect a full sell setup, with a high R:R ratio

BLDP head and shouldersWe are right before ending a head and shoulders patttern. It seems it could get lower again, but in this case it will offer a new long position, mentioned in the chart.

SPCB waiting for enter opportunitySPCB looks promising, the average target is $1.80.
I suppose there will come a even better entry sooner or later, just wait.
The pattern looks like many bullflags, always with high volatility.
Entry points and targets are mentioned in the chart, could end up in a good swing. I would add slowly from the entry 1.

JINKOSOLAR ENTRY [ELLIOT-WAVE-FORECAST]Entry is based on a flat correction which ends at 0.5 Fib-retracement at 46.34 USD.
EWO shows the performance nicely.
#nofinancialadvice

BTC LongThe dip is coming we're ini the 5th wave of down impulse in 1h. The dip would be around 32k-33k since the 15m still need to form 5th wave. not financial advice

ADA - downtrend I am not a crypto guy but, I m became interested in ADA, for now I looking forward to a good entry-point.
Helping myself with Moving average 50 and 200.... of course line trend, we can see a downtrend with a pattern.
Please advice me as necessary
ty
Valcon

Where to enter and where to exitEnter trades when the price is reversed in double touch areas, confirmed with a good wick. Apart from the H1 timeframe, make sure you will always confirm with H4 and D1 timeframes.
Exit trades shortly before a trendline or shortly before another double touch line

USDJPY > Bullish Hs Pattern, Waiting for Entry!!Analysis on #USDJPY
Hello friends.
again nothing on the higher time frame for me, so let us have a look at the lower time frame technical analysis for USDJPY.
As you can see the market dropped sharply after the NFP news, but since then the market did nothing and formed a head and shoulders pattern.
For me it is a low probability head and shoulders pattern, it did not happen at structure level or a rounded number.
i will watch the market and see if it will break out above 109.65 then I will look for a trend continuation entry
Friend, if I am helping you somehow, you can also help me by liking this post and commenting below. much appreciated
Check today analysis below⠀
>>“In Trading Losses Are the Cost of The Wins, TradingAxis.”
____________________________________________________________________________⠀
-Disclaimer: This information is not a recommendation to BUY or SELL. It is to be used for educational purposes only⠀
-Please note this is just a PREDICTION and I have no reason to act on it and neither should you

THETA/USDT: Finally a pullback for a new entry.THETA was amongst the best performing coins considering the last 12 months.
Finally we see some pullback for new entry opportunities.
The upwards moving trendline did act very well as support so far.
As gaming and streaming will become bigger and bigger also THETA is likely to increase in value.
Basic rules:
- Never buy the top/ATH
- Take profit as long as you can (also partial profit is profit)
- Use Stop/loss for leveraged positions
- If you are not experienced, don't leverage in the first place
Enjoy the ride and don't be too greedy.
If you like the content, please like, comment and give this channel a follow.
We would love it if you could share your thoughts in the comments.
Discussions are very welcome here.
Always do your own research and keep in mind that my charts and comments cannot be considered financial advice.
Cheers
ps.
Chart explanation:
Main lines:
- Green lines are tested support lines.
- Orange lines are resistance lines or, if we are above, possible support lines which were not tested yet.
- Cyan line is for volume trendline.
- White lines are Fibonacci retracement levels
Helplines:
- Purple lines are trendlines we take a look at.
- Yellow lines are for visual help only.
Boxes:
- Either entry zone or support zone. Check the description.

Upcoming BTC Long Entry Point1. If the triangle pattern continues like this, we will most likely see this happening.
2. The other secenario would be just consolidating here and eventually breaking through the 42k+ area.
So the entry at 32.161$ would be a great time to go for a long, in both scenarios. 🚀
Drastically (+3.5%) falling below my long entry is very unlikely.
Like if you agree 👍 Else I would be happy about constructive feedback; so let me know in the comments


ETH Entries . . . Short?Possible entries for Long & Short
Low Vol. Looking more short!
What do you think?

QTUM/USDT Update: Huge pullback. ATH now >10x awayQTUM did see a huge pullback >70% and is now at a critical lvl around 8$.
This and the 4.5$ support are nice entry levels.
We are currently >10x away from the ATH around 100$ and Qtum did have great news this year.
This graphs shows you why it is smart to take out some profit along the upwards ride.
Then you have to buyback at lower levels.
Basic rules:
- Never buy the top/ATH
- Take profit as long as you can (also partial profit is profit)
- Use Stop/loss for leveraged positions
- If you are not experienced, don't leverage in the first place
Enjoy the ride and don't be too greedy.
If you like the content, please like, comment and give this channel a follow.
We would love it if you could share your thoughts in the comments.
Discussions are very welcome here.
Always do your own research and keep in mind that my charts and comments cannot be considered financial advice.
Cheers
ps.
Chart explanation:
Main lines:
- Green lines are tested support lines.
- Orange lines are resistance lines or, if we are above, possible support lines which were not tested yet.
- Cyan line is for volume trendline.
- White lines are Fibonacci retracement levels
Helplines:
- Purple lines are trendlines we take a look at.
- Yellow lines are for visual help only.
Boxes:
- Either entry zone or support zone. Check the description.

ADA/USDT Update: 50% Shakeout. What's next?Cardano did rally to new ATH around 2.4$.
Some speculations about Elon accepting ADA as payment did help as well.
At one point the FUD did influence the price and we saw a huge shakeout well >50%.
Luckily most people in the Cardano system are more of the hodl and stake type so we don't expect mass panic in ADAland.
Currently we got back new upwards moving trendlines.
Let's see if these can hold and if we get a nice bounce of them.
The Cardano ecosystem is about to explode once we get smart contracts which are around the corner.
Basic rules:
- Never buy the top/ATH
- Take profit as long as you can (also partial profit is profit)
- Use Stop/loss for leveraged positions
- If you are not experienced, don't leverage in the first place
Enjoy the ride and don't be too greedy.
If you like the content, please like, comment and give this channel a follow.
We would love it if you could share your thoughts in the comments.
Discussions are very welcome here.
Always do your own research and keep in mind that my charts and comments cannot be considered financial advice.
Cheers
ps.
Chart explanation:
Main lines:
- Green lines are tested support lines.
- Orange lines are resistance lines or, if we are above, possible support lines which were not tested yet.
- Cyan line is for volume trendline.
- White lines are Fibonacci retracement levels
Helplines:
- Purple lines are trendlines we take a look at.
- Yellow lines are for visual help only.
Boxes:
- Either entry zone or support zone. Check the description.

NEO/USDT Update: Closing the gap to old supportCurrently Neo closes the gap to the old support arounf 40$.
We still did not see new ATH which lies around 180$.
However, we stay optimistic for this year to reach new ATH after the dust settles from this current pullback.
We broke out of the upwards channel and try to get back in again.
The volume over 2021 is high which indicates demand.
Basic rules:
- Never buy the top/ATH
- Take profit as long as you can (also partial profit is profit)
- Use Stop/loss for leveraged positions
- If you are not experienced, don't leverage in the first place
Enjoy the ride and don't be too greedy.
If you like the content, please like, comment and give this channel a follow.
We would love it if you could share your thoughts in the comments.
Discussions are very welcome here.
Always do your own research and keep in mind that my charts and comments cannot be considered financial advice.
Cheers
ps.
Chart explanation:
Main lines:
- Green lines are tested support lines.
- Orange lines are resistance lines or, if we are above, possible support lines which were not tested yet.
- Cyan line is for volume trendline.
- White lines are Fibonacci retracement levels
Helplines:
- Purple lines are trendlines we take a look at.
- Yellow lines are for visual help only.
Boxes:
- Either entry zone or support zone. Check the description.

ONT/USDT Update: Retesting old support lineOntology is currently retesting the 0.9 support line the second time. It did hold strongly during the last test and we assume it will again.
We did break out of our upwards moving channel and have to take another shot.
Checking the RSI we see that we are near the oversold region and the volume is in a steady rise since 2021.
Basic rules:
- Never buy the top/ATH
- Take profit as long as you can (also partial profit is profit)
- Use Stop/loss for leveraged positions
- If you are not experienced, don't leverage in the first place
Enjoy the ride and don't be too greedy.
If you like the content, please like, comment and give this channel a follow.
We would love it if you could share your thoughts in the comments.
Discussions are very welcome here.
Always do your own research and keep in mind that my charts and comments cannot be considered financial advice.
Cheers
ps.
Chart explanation:
Main lines:
- Green lines are tested support lines.
- Orange lines are resistance lines or, if we are above, possible support lines which were not tested yet.
- Cyan line is for volume trendline.
- White lines are Fibonacci retracement levels
Helplines:
- Purple lines are trendlines we take a look at.
- Yellow lines are for visual help only.
Boxes:
- Either entry zone or support zone. Check the description.
