Is Tesla entering a distribution phase before a potential move?Could Tesla be in a distribution phase before heading south? 300 is a critical support—lose it, and 130 comes into play.
ETF

Let’s zoom out and look at the bigger picture for Bitcoin.After this week’s sharp drop, Bitcoin likely needs time to cool off and move sideways. BTC is sitting at a major support zone around 60K, which won’t be easy to break. Could we eventually see another capitulation toward the 40K or even 30K range? And will Bitcoin make a new all-time high in the future? Time will tell.

Are we due for a relief bounce on Bitcoin soon?After the ~22% drop I mentioned earlier, could Bitcoin see a relief bounce this weekend toward the 78,000 range? Indicators are already showing bullish divergence.
The question is whether this would be a dead-cat bounce before another leg down or a potential double bottom. A clean break above 78,000 could also open the door for further upside.

Can Bitcoin finally hold above $72,000–$73,000?Bitcoin is under pressure again, and the market is asking an uncomfortable question. Is this the bottom, or just a pause before more pain?
The world’s largest cryptocurrency slid to around $73,000 on February 3, extending a selloff that has now wiped out about 41% from its October 2025 peak above $126,000. That kind of drawdown has shifted the mood fast, from confident dip-buyers to cautious capital preservation.
The latest drop didn’t happen in isolation. Rising geopolitical tension between the United States and Iran rattled global markets after reports that an Iranian drone was shot down near a US aircraft carrier. Risk aversion surged, the VIX jumped roughly 10%, and the Crypto Fear and Greed Index sank deep into “extreme fear.”
At the same time, traditional safe havens caught a strong bid. Gold climbed nearly 7% and silver jumped about 10%, reminding investors where capital often hides when uncertainty spikes. Bitcoin, once pitched as digital gold, instead traded like a high-beta risk asset.
Policy signals added to the pressure. US Treasury Secretary Scott Bessent told Congress that while the government will keep Bitcoin seized through asset forfeitures, it has no plans to encourage banks to buy BTC during market stress. For some investors, that removed hopes of an unofficial backstop.
Fund managers say the selloff was made worse by forced liquidations. As Bitcoin broke key support levels, leveraged long positions were flushed out, accelerating the decline. Research desks note momentum indicators now look oversold, but warn that oversold does not mean safe.
The focus is now on the $72,000 to $73,000 zone. If Bitcoin can stabilize here, volatility may cool and a base could form. A clean break below it, however, could open the door to another leg lower before confidence returns. For now, the trend is bearish, but the next few sessions may decide whether fear peaks or deepens.

SGOL – Swiss Vaulted Physical Gold Trendabrdn Physical Gold Shares ETF (SGOL) holds allocated gold bars stored in Swiss vaults, giving investors direct physical exposure with transparent bar lists. This chart tracks gold’s structural trend via SGOL, focusing on weekly bases, prior breakout zones, and fresh demand blocks where I want to position long into sustained bullion moves.

Bitcoin Hits Two-Month Low—Rebound to $90K Ahead?Bitcoin has slipped to its lowest level in two months, surprising many investors who expected smoother sailing after last year’s rally. The world’s largest cryptocurrency is now down about one-third from its October all-time high, raising a sharp question across markets: is this just a healthy correction, or the start of something deeper?
The recent drop is tied to growing speculation that the next Federal Reserve chair could tighten financial conditions. Tighter money usually hurts risk assets, and Bitcoin has not been spared. Still, optimism hasn’t disappeared. Crypto supporters point to President Trump’s plan to nominate Kevin Warsh as Fed chair, highlighting his past comments that were seen as open-minded toward Bitcoin. Michael Saylor of Strategy even called him a potential “pro-Bitcoin” Fed chairman, a comment that quickly gained traction online.
Behind the scenes, adoption continues to grow. Bitcoin firm River says more banks are rolling out crypto services, with around 60% now involved in the Bitcoin ecosystem. Institutional exposure is also rising quietly. Research firm K33 reports that Norway’s sovereign wealth fund boosted its indirect Bitcoin exposure by 149% in 2025 through stakes in companies like Strategy, Coinbase, MARA, Metaplanet, and Block. These firms continue to add Bitcoin to their balance sheets, increasing long-term demand.
From a market perspective, some classic Bitcoin indicators suggest the correction may be nearing its end. Fund managers note that long-term holders are not selling aggressively, which often signals a base forming rather than panic.
Macro uncertainty and volatility remain the main challenge. If financial conditions tighten, Bitcoin could remain volatile in the short term. Still, with fundamentals improving and institutional interest holding firm, many analysts believe Bitcoin could stabilize near current support and attempt a rebound toward the 90,000 level. The outlook remains cautiously bullish, not broken.

Is Microsoft headed for a downturn?Microsoft is starting to show signs of weakness and could fall further to 350 if the 400 support level fails to hold.

Europe’s Center is CRUMBLING: VGK on the Brink? 🚨 Europe’s Center is CRUMBLING: VGK on the Brink? 🚨
Europe’s elections just lit a FUSE! 💥 Poland (May 18), Portugal (May 18), and Romania (May 4 & 18) held off populists, but the center’s hanging by a thread—50% in Poland went right-wing, Portugal’s Chega is shaking things up.
Immigration and globalization fury could rattle EU trade & policy. 📉 VGK ($75.53) is inches from its yearly high ($75.56)—ready to crash or soar?
💡 Trade Idea: Plot VGK price action with election dates (May 4, May 18, June 1, 2025) to spot volatility breakouts. Watch for support near $70 or resistance at $76.
❓ Your Move? Will VGK tank or rally on Europe’s chaos? Drop your trade below! 👇

NIFTY | BANK NIFTY – Breakdown, Range Play & Key Levels AheadNifty closed at 25,048, down nearly 650 points from the previous week. The index made a high of 25,653 and a low of 24,919, and in the process breached my earlier range of 26,150–25,200, confirming continuation of weakness.
The only silver lining this week is that Nifty managed to close above the psychological 25,000 mark, which now acts as an important decision zone going forward.
Key Levels to Track Next Week
if Nifty sustains above 25,000
A technical pullback cannot be ruled out towards:
25,200
25,300
25,500
❌ Day close below 25,000
Downside may open towards:
24,850
24,600
24,550
👉 Expected Trading Range:
25,500 – 24,500
With Republic Day holiday on Monday, the week is truncated, and hence chances of range-bound trade remain high. In such conditions, large players generally focus on option premium decay from both sides rather than strong directional bets.
Medium-Term Support Zones
23,900
23,500
These are important demand areas, from where a meaningful relief rally can emerge if tested. Till then, the approach remains disciplined — set alerts, wait for confirmation, and deploy capital only in fundamentally strong stocks.
BANK NIFTY – HEAVYWEIGHT PRESSURE CONTINUES
Bank Nifty closed at 58,473, down nearly 1,600 points for the week. The index made a high of 60,107 and a low of 58,278.
As discussed earlier, weakness in HDFC Bank continued this week, with the heavyweight correcting nearly 3%, dragging the broader banking index lower.
Downside Levels:
Below 58,278 → 57,700 / 57,200
Upside Scenario:
If Bank Nifty manages to trade above 59,000, a pullback towards 59,700 is possible.
One Chart to Keep on the Radar (Observation Only)
While indices remain volatile, HNGSNGBEES is showing relative strength. The ETF has delivered a weekly timeframe breakout, which makes it worth tracking as a banking sector strength gauge.
If the breakout sustains, the structure highlights the following reference zones:
579 → 615 → 633 → 660 (important level)
This is not a recommendation, but a technical observation to monitor price behavior during this corrective phase.
Market Structure Insight
As per my calculations, on Tuesday:
Either the market may open gap-up, OR
Even in case of a gap-down opening, an attempt to move higher early in the session is possible
Reason: Put option premiums are currently very lucrative, and such imbalances are often adjusted by big players intraday.
Bonus Trading Tip
If Nifty sustains above 25,400 for at least one hour, chances of short covering increase
Until then, sell on rise remains the preferred strategy

Long Dimon, Short Corn: $XLF vs. $BTC🏛️🏛️🏛️🏛️🏛️
🌽🌽🌽🌽🌽
Banks make profits
Banks can innovate and adopt new technologies
Bitcoin core devs can't.
Goal: Capture the capital flight from the meme of decentralised money and the central bank disruptor, back to the money centers of the US empire.
I believe a retest of December 2017 is on deck.
#XLF #BTC #Bitcoin #Corn #MacroTrade

SILVER and the ETF'sI reckon it's now time for Silver to relax. It has been on amazing run but fibonacci levels have always been the ring master. The ring master is now likely saying enough is enough.

100% UPSIDE Precious Metals Playbook — Gold, Silver & Miners ETF🏛️ Precious Metals Playbook — Gold, Silver & Miners ETFs
🔑 Executive Summary
• We combine the 2026 parabolic metals thesis gold/silver/platinum with leveraged ETF implementation to target triple-digit portfolio upside under view that gold’s bull run continues into 2026 $5,500–$6,500/oz.
• Miners’ torque has been massive in 2025: GDX ~+123% YTD while gold itself is up ~51% YTD; levered miners e.g., NUGT, JNUG, GDXU show ~360–700%+ YTD — confirming high beta to metal.
• Implementation below caps any single ETF at 10% within 10–20% limit and keeps ≥50% of the book in 2×–3× products for upside torque while diversifying across metal vs. miners and gold vs. silver.
________________________________________
🌍 Market View Condensed
• Gold: Momentum + macro easing bias, softer USD, central-bank demand support the “second-leg melt-up” case into 2026; miners’ margin torque can deliver 2–3× metal beta.
• Silver: Structural deficits + PV/EV/datacenter demand have super-charged silver miners in 2025.
________________________________________
📊 2025 YTD Scorecard Key ETFs
• Gold metal (unlevered): GLD +50.9% YTD.
• Gold miners (unlevered): GDX ~+123% YTD.
• Silver miners (unlevered): SIL ~+137% YTD.
• Leveraged miners:
o NUGT (2× miners) ~+361% YTD; JNUG (2× juniors) ~+394% YTD.
o GDXU (3× miners ETN) ~+706% YTD (top performer cohort of 2025).
• Leveraged gold & silver metals: UGL (2× gold) ~+125% YTD; DGP (2× gold ETN) ~+123% YTD; AGQ (2× silver) ~+159% YTD.
________________________________________
🧩 Portfolio Construction Target book: $100,000
Constraints honored: max 10% per ETF, ≥50% allocation to 2×/3× ETFs.
🎯 Target Allocation 60% leveraged / 40% unlevered
Leveraged — 60% total
• 10% GDXU 3× gold miners ETN
• 10% NUGT 2× gold miners
• 10% JNUG 2× junior gold miners
• 10% AGQ 2× silver
• 10% UGL 2× gold
• 10% DGP 2× gold ETN
Rationale: diversify torque across miners vs. metals, 2× vs. 3×, and gold vs. silver to avoid single-product concentration risk.
Unlevered — 40% total
• 10% GDX VanEck Gold Miners
• 10% GLD SPDR Gold Trust
• 10% SIL Global X Silver Miners
• 10% SLV (or) IAU silver or gold bullion, choose per preference
Rationale: ballast and liquidity; preserves exposure if volatility in levered products forces risk-off.
Dollar mapping (@ $100k):
• Each 10% line = $10,000 notional; 10 tickers → $100,000 fully invested.
________________________________________
📈 Scenario Analysis Hypothetical, path-dependent
Gold advances toward $5,500–$6,500 by 2026. We translate that into rough upside bands using historical betas and allowing for daily-reset drag on leveraged products.
• Base case +100% portfolio:
o Gold +40–60% from here; 2× gold funds net ~+70–110% conservative for compounding/decay.
o GDX sensitivity ~2–3× metal → ~+80–150%; 2× miners ~+160–300%; 3× miners can overshoot in trending tapes.
o With 60% in levered assets and 40% in unlevered miners/metals, blended outcome can land near ~+100% if trends persist and volatility stays manageable.
• Stretch case +200% portfolio:
o If the “second-leg melt-up” plays out momentum + flows + central-bank bid and miners’ margins expand, levered miners dominate returns similar to 2025 YTD pattern.
o Portfolio hits ~+200% if miners continue to over-beta the metal and 3× exposure compounds favorably no major whipsaws.
Risk reality check: Leveraged ETFs reset daily; high volatility or choppy reversals can erode returns even if the long-term trend is up. Position sizing 10% lines and diversification across instruments help mitigate single-name decay risk.
________________________________________
🧭 Implementation Notes
• Execution: stage entries over several days reduce gap/vol risk, prioritize liquid hours; use stop-loss/hedge bands on the 3× sleeve.
• Rebalancing: monthly bands ±3–5% per line to defend the 60/40 torque mix.
• Risk budget: expect 3× ETN drawdowns >60% in sharp pullbacks; keep dry powder OR pre-define risk limits.
________________________________________
🗂️ Product Appendix — Quick Stats
• GDXU (3× miners ETN): ~+706% YTD; ER ~0.95%.
• NUGT (2× miners): ~+361% YTD.
• JNUG (2× junior miners): ~+394% YTD.
• AGQ (2× silver): ~+159% YTD.
• UGL (2× gold): ~+125% YTD.
• DGP (2× gold ETN): ~+123% YTD.
• GDX (miners): ~+123% YTD.
• SIL (silver miners): ~+137% YTD.
• GLD (gold): ~+50.9% YTD.
________________________________________
⚠️ Disclosures & Risks
Leveraged ETFs/ETNs are short-term trading tools with daily reset/compounding; they can significantly underperform their leverage multiple over holding periods with high volatility or mean-reversion. ETNs (e.g., GDXU, DGP) also carry issuer credit risk. This memo is informational, not investment advice; consider your risk tolerance, liquidity needs, and tax/ETN suitability.

$PSCF: Small Banks, Big Breakout! This HVF Funnel is Primed!NASDAQ:PSCF (SmallCap Financials) is carving out a textbook Hunt Volatility Funnel after a strong rally in late 2025. We have the required 3 alternating touches, and volatility is now at an extreme 'squeeze'.
@TheCryptoSniper
The Catalyst: Banks are entering a 'sweeter spot' in 2026 with falling benchmark rates and a steepening yield curve.
Technical Trigger: Looking for a daily close above High 3 with a volume spike.
Risk Management: Standard HVF stop-loss is placed vertically below the entry point at the most recent swing low 3.
Small-cap financials often lead the charge in the second half of a recovery—this funnel suggests the expansion phase is near.
🏛️ Top 10 #PSCF Holdings
1 CareTrust REIT, Inc. #CTRE 2.15%
2 Jackson Financial Inc. #JXN 1.98%
3 Lincoln National Corp #LNC 1.82%
4 MarketAxess Holdings Inc. #MKTX 1.66%
5 Terreno Realty Corp. #TRNO 1.62%
6 Essential Properties Realty Trust. #EPRT 1.56%
7 Piper Sandler Companies. #PIPR 1.55%
8 Ryman Hospitality Properties. #RHP 1.52%
9 Moelis & Company. #MC 1.41%
10 StepStone Group Inc. #STEP 1.38%

UVXY short-term TAUVXY is trying to reverse and getting ready for the push higher, currently there's a positive accumulation on hourly frame and daily frame is starting to accumulate as well, daily frame remains in the bearish area yet but it's improving and may break out soon. Keep an eye on VIX.

The Good, The Bad, and the Ugly. Silver.Silver, oh Silver.
My sweet, shiny stone. Since $24 or so, I've tried to preach the good word.
Where are we at now?
Ill start with my fundamental idealism and a short bear/bull case.
Year of the horse, lets keep it short-ish..
Bull
Silver has never seen her own bullrun.. until now(?).
We have new imposed restrictions via China on export.
We can sleep at night knowing silver is never going away.
We can sleep at night knowing they want to keep continue building data centers.
Silver is everything we wholeheartdly use, electronically.
Bear
We are going to see some sort of bearish diver, weve been hot too long
$70 support? we are currently ping-ponging in price, not an ideal entry point.
I've made a channel for our temporary upper and lower bounds.
Id suggest to watch for now, its a great time to take TP if youve been here.
Peace on Earth, happy new year.

Quantum Leap: $QTUM Continuation Pattern has triggered.The Defiance Quantum ETF (QTUM) is showing a classic bullish continuation pattern after a spectacular 2025. Following a sharp rally, the price has been consolidating in a tight range near its 52-week high of $117.12.
The Technical Setup: We are seeing a clear consolidation phase—likely a cup and handle / or continuation inverse head and shoulders Both have the same price objective—just above the 50-day moving average ($114.36).
This 'pause' in the trend is healthy and suggests that the previous uptrend is ready to resume.
FUNDAMENTAL DRIVER:
2026 is being labeled a potential 'inflection year' for the industry.
IBM is targeting quantum advantage by the end of this year with its 120-qubit Nighthawk processor, while IonQ aims for systems up to 256 qubits.
Diversified Exposure: Unlike betting on a single stock, QTUM holds 84 different companies, spreading risk across hardware, software, and machine learning leaders like Microsoft, Alphabet, and NVIDIA.
Massive Market Growth: Analysts estimate the quantum computing market could grow from $0.8 billion in 2025 to over $1 billion in 2026, with some projections suggesting a nearly $2 trillion value creation potential by 2035.
Sustained Inflows: The ETF has seen net AUM growth of over $2.39 billion in the last year, proving that institutional capital is rotating heavily into this sector.
What's your take? Is the quantum sector ready for another parabolic move?

PSE ETF looks BullishPSE ETF looks Bullish and may achieve 10% gain by March 2026.
Warning: This is my personal opinion high chances might go wrong.

QQQ mid-term TANasdaq is having negative divergence in volumes, there'e a trampoline move in the process with a potential squeeze downside, be careful and watch for the correction in upcoming days.

SLV | Next Leg Higher Is Here | LONGiShares Silver Trust seeks to reflect generally the performance of the price of silver. The Trust seeks to reflect such performance before payment of the Trust's expenses and liabilities. It is not actively managed. The Trust does not engage in any activities designed to obtain a profit from, or to ameliorate losses caused by, changes in the price of silver.

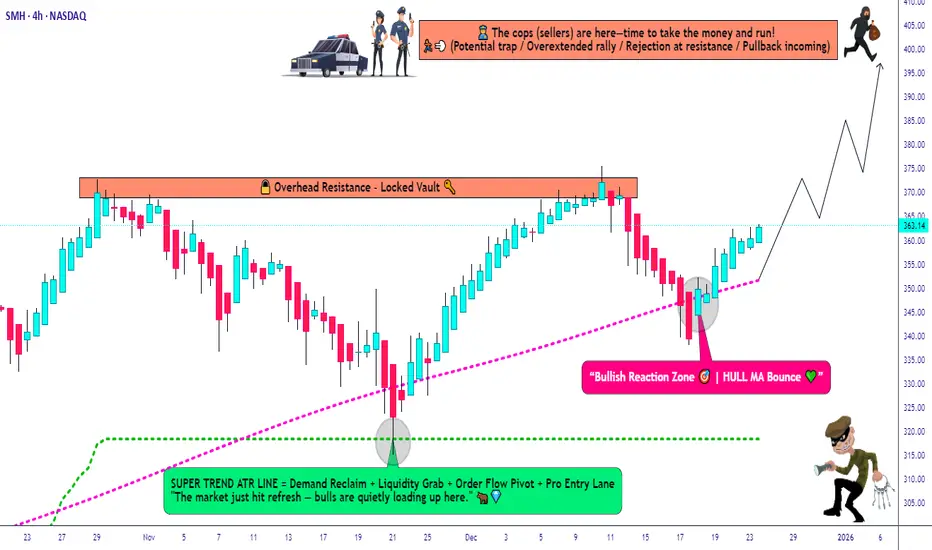
SMH Bullish Structure Confirmed — Pullback Strategy Active!🎯 SMH Semiconductor Heist: The $400 Target Caper 💰🚀
📊 Asset Overview
VanEck Semiconductor ETF (SMH) - NASDAQ Listed
Trade Type: Swing Trade (Bullish Setup)
Strategy Style: "The Thief Method" - Layered Entry Approach 🏴☠️
🔍 Technical Analysis Breakdown
📈 Bullish Confirmation Signals
✅ Supertrend ATR Indicator: Bullish pullback confirmed
✅ HULL Moving Average: Clean retest and bounce pattern detected
✅ Market Structure: Higher lows forming with momentum building
The setup is cooking like a perfectly timed bank job - all the technical stars are aligning! 🌟
💼 The "Thief Strategy" Game Plan
🎯 Entry Strategy (Layered Limit Orders)
Multiple Buy Limit Layers:
🥇 Layer 1: $340.00
🥈 Layer 2: $345.00
🥉 Layer 3: $350.00
💎 Layer 4: $355.00
Note: You can add more layers based on your position size and risk appetite! This "scaling-in" approach reduces timing risk and averages your entry price. Think of it as sending multiple agents into the vault instead of going all-in at once! 🕵️♂️
🛑 Risk Management
⚠️ Stop Loss Zone
Thief's Emergency Exit: $335.00
Disclaimer: This is MY stop loss level based on technical invalidation. You're the captain of your own ship! 🚢 Set YOUR stop loss based on YOUR risk tolerance and account size. Risk management is personal - what works for a $10K account differs from a $100K account!
🎯 Profit Target
💰 Take Profit Zone
Primary Target: $400.00
Reasoning:
🚧 Major resistance confluence zone ("Police Barricade" level)
📊 Historical supply zone where sellers previously appeared
⚠️ Potential overbought conditions expected at this level
🪤 Bull trap risk increases as retail FOMO kicks in
Disclaimer: This is MY target based on technical analysis. YOU make the final call! Scale out partially at psychological levels ($375, $385, $390) if you prefer to lock profits along the way. Remember: "Pigs get fed, hogs get slaughtered!" 🐷
🔗 Related Pairs to Watch (Correlation Analysis)
📱 Individual Semiconductor Stocks:
NASDAQ:NVDA (NVIDIA) - AI chip leader, ~10% weight in SMH
NASDAQ:AMD (Advanced Micro Devices) - Strong correlation with SMH
NASDAQ:AVGO (Broadcom) - Networking chips, infrastructure play
NYSE:TSM (Taiwan Semiconductor) - Foundry leader, bellwether for sector
NASDAQ:INTC (Intel) - Legacy chips, inverse correlation at times
NASDAQ:QCOM (Qualcomm) - Mobile chips, 5G exposure
NASDAQ:ASML (ASML Holding) - Chip equipment, leading indicator
📊 Broader Market ETFs:
NASDAQ:QQQ (Nasdaq-100) - Tech-heavy index with high SMH correlation
AMEX:SPY (S&P 500) - Overall market sentiment gauge
NASDAQ:SOXX (iShares Semiconductor ETF) - Direct competitor/confirmation
AMEX:XLK (Tech Sector SPDR) - Broader tech exposure
Key Correlation Points:
🔸 SMH typically moves with NVDA and AMD momentum
🔸 Watch NYSE:TSM for Asian market sentiment on chips
🔸 Rising NASDAQ:QQQ usually lifts all semiconductor boats
🔸 NASDAQ:SOXX divergence from SMH can signal sector rotation
🌍 Fundamental & Economic Factors
📰 Macro Catalysts to Monitor:
💡 Positive Factors (Bullish):
🤖 AI Boom Continuation: ChatGPT, autonomous vehicles, data centers = insatiable chip demand
🏭 CHIPS Act Funding: US government subsidies for domestic semiconductor production
📱 5G Rollout: Global infrastructure upgrades driving chip sales
🎮 Gaming & Crypto: GPU demand remains elevated
📈 Inventory Restocking Cycle: Post-2023 correction, supply chains normalizing
⚠️ Risk Factors (Watch Closely):
🇨🇳 China-Taiwan Tensions: Geopolitical risk (TSM produces ~90% of advanced chips)
💵 Fed Interest Rate Policy: Higher rates = lower tech valuations
📉 Economic Slowdown Fears: Recession = reduced corporate IT spending
🚫 Export Restrictions: US-China chip technology trade wars
📊 Inventory Glut Risk: Oversupply if demand weakens suddenly
📅 Key Events to Track:
Quarterly earnings from NVDA, AMD, TSM (guidance is crucial!)
Federal Reserve rate decisions (tech is rate-sensitive)
US-China trade negotiations
Monthly semiconductor sales reports (SIA data)
🎭 The Thief's Philosophy
This isn't your grandpa's "buy and hold" strategy - this is active swing trading with style! 😎 We identify the setup, execute with layers, manage risk like professionals, and exit before the party turns ugly. No emotional attachment, no hopium - just cold, calculated profit extraction! 🧊💰
Remember:
✨ The market doesn't care about your mortgage payment
✨ Technical setups fail sometimes - that's why we use stops
✨ Taking profits is NOT a crime (despite the "Thief" branding! 😂)
✨ Live to trade another day > revenge trading losses
✨ If you find value in my analysis, a 👍 and 🚀 boost is much appreciated — it helps me share more setups with the community!
🏴☠️ Happy Trading, Fellow Thieves! May your stops never get hit and your targets always fill! 💎🙌
Nasdaq ETF QQQ: Liquidity Sweep Then Expansion Play📊 ASSET DETAILS
Instrument: QQQ — Invesco QQQ Trust Series
Market: NASDAQ
Type: ETF
Trading Style: Swing Trade
Bias: 🟢 Bullish
🧠 MARKET STRUCTURE & TECHNICAL CONTEXT
QQQ is currently respecting a bullish market structure, supported by a triangular moving average pullback and clean retest.
This behavior typically signals trend continuation, not reversal, provided key liquidity zones remain defended.
📌 Key confirmations:
Higher-timeframe trend intact
Price reacting positively to dynamic support
Healthy pullback (not impulsive selling)
Liquidity resting below current price action
🧩 TRADE PLAN — THIEF STYLE (EDUCATIONAL / ENTERTAINMENT)
🟢 Bias
Bullish continuation scenario
🎯 ENTRY STRATEGY (THIEF LAYER METHOD)
This plan uses a layered limit order approach, commonly known as a scaling-in / cost-averaging style entry.
You may also choose any price level entry based on your own confirmation.
Example Layered Buy Limits:
605.00
610.00
615.00
620.00
➡️ You may increase or adjust layers based on your own risk profile and execution model.
⚠️ This method is designed to avoid emotional chasing and allows flexibility during volatility.
🛑 STOP LOSS (REFERENCE LEVEL)
Stop Level: 600.00
📌 Note for Thief OGs:
This stop level is not a recommendation.
Risk management is your personal responsibility.
Use your own stop logic if it better fits your strategy.
🎯 TARGET / EXIT ZONE
Primary Target: 650.00
📍 Rationale:
Strong resistance / supply zone
Potential overbought conditions
Possible liquidity trap above highs
🧠 When price reaches this zone, capital preservation > greed.
Escaping with profits is always a professional move.
📌 Reminder:
This target is not mandatory — partials, trailing exits, or custom targets are valid alternatives.
🔗 RELATED PAIRS & CORRELATED MARKETS TO WATCH
📈 AMEX:SPY (S&P 500 ETF)
Confirms broader market risk-on sentiment
Strength in SPY often supports continuation in QQQ
💻 NASDAQ:AAPL / NASDAQ:MSFT / NASDAQ:NVDA
Heavy-weight components of QQQ
Institutional accumulation in these names often leads QQQ direction
💵 TVC:DXY (US Dollar Index)
Weak or sideways DXY typically supports tech strength
Strong DXY may slow upside momentum
📉 TVC:VIX
Rising VIX = caution
Suppressed VIX supports bullish continuation
⚠️ IMPORTANT NOTES (READ BEFORE COMMENTING)
This setup is educational & entertainment-based
No guarantee of outcome
Markets can invalidate any setup at any time
Always manage risk and position size responsibly
✨ “If you find value in my analysis, a 👍 and 🚀 boost is much appreciated — it helps me share more setups with the community!”
⚠️ DISCLAIMER
This is a thief-style trading strategy just for fun.
Nothing here should be considered financial advice.

BTCUSDT - Range-Bound at $87KExecutive Summary
BINANCE:BTCUSDT is trading at approximately $87,740 after a turbulent 2025 that saw Bitcoin hit an all-time high of $126,272 in October before correcting 30%. The price is now stuck in a tight consolidation range between $85,000 support and $90,000 resistance. While short-term metrics show slight recovery (+1.5% weekly, +3.53% monthly), the bigger picture is concerning: YTD performance is -6.25%, and multiple on-chain indicators suggest we may be entering a late-cycle distribution phase with bear market risk in early 2026.
BIAS: NEUTRAL TO SLIGHTLY BEARISH - Bullish Potential with Bearish Undertones
The short-term structure allows for bullish breakout, but the weight of on-chain evidence and macro factors lean bearish for Q1 2026. Trade the range, respect the levels.
Current Market Context - December 23, 2025
Bitcoin finds itself at a critical juncture:
Current Price: $87,825.99 (-0.99% on the day)
Day's Range: $86,601.90 - $88,940.00
52-Week Range: $74,508.00 - $126,199.63
All-Time High: $126,272.76 (October 6, 2025)
Volume: 9.22K (below 30D average of 17.23K)
Down 30.06% from ATH
Performance Metrics - MIXED:
1 Week: +1.50% (Green)
1 Month: +3.53% (Green)
3 Months: -21.67% (Red)
6 Months: -18.27% (Red)
YTD: -6.25% (Red)
1 Year: -7.83% (Red)
The short-term green metrics mask a deeply concerning longer-term picture. Bitcoin is underperforming its 2024 and 2023 seasonal patterns significantly.
THE WARNING SIGNS - 5 Charts Suggest Bear Market Risk
Multiple on-chain and market-structure indicators are flashing caution:
1. Bitcoin's Apparent Demand Growth Is Rolling Over
Demand growth slowing after multiple waves earlier in the cycle
While price remained elevated through 2025, demand failed to make new highs
This divergence indicates price strength relied more on momentum and leverage than fresh spot buying
When demand growth flattens while price stays high, markets shift from accumulation to distribution
This often marks early stages of a bear market or long consolidation
2. US Spot Bitcoin ETF Inflows Are Losing Momentum
ETFs have been the strongest source of structural demand this cycle
In 2024, ETF inflows accelerated steadily into year-end
Q4 2025 shows inflows flattening and, in some periods, declining
ETFs represent long-term capital, not short-term trading
When ETF demand slows while price remains high, large buyers are stepping back
Without sustained institutional inflows, Bitcoin becomes more vulnerable to derivatives-driven volatility
3. Dolphin Wallets (100-1,000 BTC) Are Reducing Exposure
"Dolphins" are typically sophisticated investors and funds
Sharp decline in dolphin holdings on a one-year basis
Similar behavior appeared in late 2021 and early 2022, ahead of deeper drawdowns
This points to risk reduction by experienced holders
When this cohort distributes while price remains elevated, it reflects expectations of lower returns ahead
4. Funding Rates Are Trending Lower Across Exchanges
Funding rates measure cost to hold leveraged positions
Clear downward trend across major exchanges
Indicates waning demand for leverage even as price remains relatively high
In bull markets, strong rallies are supported by rising funding and persistent long demand
Falling funding rates suggest traders are less confident and less willing to pay to stay long
This environment often precedes choppy price action or broader trend reversals
5. Bitcoin Broke Below the 365-Day Moving Average
The 365-day MA historically separates bull markets from bear markets
Bitcoin has now crossed below this level for the first sustained period since early 2022
Previous macro-driven sell-offs in 2024 and early 2025 tested this level but failed to close below it
A sustained break signals a shift in long-term momentum
Increases probability that rallies will face stronger resistance
CRITICAL: None of these signals confirms a full bear market alone. Together, they suggest rising downside risk and weakening support.
How Low Could Bitcoin Go?
If bear market develops:
Bitcoin's realized price is currently near $56,000 (average cost basis of all holders)
In prior bear markets, Bitcoin often bottomed near or slightly below this level
This doesn't mean Bitcoin must fall to $56,000
But in a full bear scenario, long-term buyers historically step in closer to that zone
Wide range of outcomes possible, including prolonged sideways movement rather than sharp decline
THE BULL CASE - Wall Street Is Coming
Despite the warning signs, major bullish catalysts are emerging:
JPMorgan Exploring Crypto Trading
Largest US bank considering crypto trading services for institutional clients
Assessing spot and derivatives trading products
Would represent major evolution for JPMorgan
CEO Jamie Dimon has been critical of Bitcoin but bank is expanding blockchain activity
In May, Dimon said JPMorgan would allow clients to buy Bitcoin
Bank launched tokenized money-market fund (MONY) on Ethereum with $100M initial capital
Arranged short-term bond for Galaxy Digital on Solana blockchain
Wall Street's Broader Embrace
Morgan Stanley offering crypto trading on E*Trade platform (H1 2026)
Charles Schwab ($11.6 trillion firm) launching Bitcoin trading (H1 2026)
20% of Schwab clients already own crypto
Growing institutional demand as regulatory frameworks clarify
Trump administration pledged to make America "crypto capital of the world"
JPMorgan Analysts' Price Target
JPMorgan analysts projected Bitcoin could climb to $170,000 within 6-12 months
Contingent on perpetual futures deleveraging completing
Global crypto market valued at ~$3.1 trillion
Bitcoin accounts for ~$1.8 trillion
Projected to reach new ATH next year as adoption grows
Arizona Crypto-Friendly Legislation
Senator Wendy Rogers proposed bills to exempt virtual currency from taxation
SB 1044: Exempt crypto from state taxation
SB 1045: Bar cities/counties from taxing blockchain nodes
SCR 1003: Amend constitution to exclude crypto from property tax
Arizona already has digital asset reserve law
Other states (New Hampshire, Texas) have similar laws
Technical Structure Analysis
Price Action Overview - 4 Hour Timeframe
The chart shows a clear consolidation structure:
Current Range:
MAJOR RESISTANCE: $89,000-$90,500 zone
SUPPORT: $86,600-$87,200 zone
Price oscillating between these levels
Multiple tests of both zones without sustained follow-through
Neither bulls nor bears have full control
Equilibrium state - buyers step in near support, sellers defend resistance
Recent Price Action:
Sharp rejection from ~$90,500 area
Price dropped to current ~$87,740 level
Testing mid-range support
Two scenarios visible on chart:
Bullish: Break above resistance toward $89,000+
Bearish: Break below support toward $85,000
Key Observations:
Volume below 30-day average (9.22K vs 17.23K) - thin liquidity
Range-bound trading suggests indecision
Breakout direction will determine next major move
Holiday period typically sees lower liquidity, amplifying moves
Key Support and Resistance Levels
Resistance Levels:
$88,940 - Day's high / immediate resistance
$89,000-$90,500 - MAJOR RESISTANCE ZONE
$92,000-$93,000 - Secondary resistance (breakout target)
$95,000 - Psychological level
$100,000 - Major psychological barrier
$126,272 - All-time high (October 2025)
Support Levels:
$87,200 - Immediate support
$86,600-$87,000 - MAJOR SUPPORT ZONE
$85,000 - Critical support (strong demand in early December)
$82,000-$83,000 - Secondary support
$74,508 - 52-week low
$56,000 - Realized price (bear market bottom zone)
Chart Pattern Analysis
Current structure shows a consolidation rectangle :
Clear horizontal support at $86,600-$87,200
Clear horizontal resistance at $89,000-$90,500
Price compressing within this range
Breakout imminent - direction TBD
Volume declining during consolidation (typical)
Watch for volume spike on breakout for confirmation
Moving Average Analysis
Price trading BELOW 365-day moving average - bearish signal
This is first sustained break below 365 MA since early 2022
Short-term MAs may be providing temporary support
Long-term trend structure has weakened significantly
Rallies likely to face resistance at declining MAs
Volume Analysis
Current volume: 9.22K (significantly below 30D average of 17.23K)
Thin liquidity environment
Low volume consolidation typical before breakouts
Holiday period reducing participation
Watch for volume confirmation on any breakout
Low volume moves are less reliable
Market Structure Assessment
Current State:
Range-bound with thin liquidity
High sensitivity to leverage-driven moves
Retail participation appears cautious
Institutional flows have slowed
Selling pressure primarily retail-driven from leveraged and short-term participants
US spot Bitcoin ETF holdings declined less than 5% despite 30%+ drawdown - institutions holding
Expert Analysis - Ray Youssef (NoOnes CEO):
"BTC's upside is now tied to liquidity expansion, sovereign policy clarity, and risk sentiment, rather than to monetary debasement alone."
"From a market-structure perspective, Bitcoin remains stuck in a compressing, range-bound action bout."
Bitcoin has failed to deliver on its hedge narrative in 2025, demonstrating heightened sensitivity to macroeconomic factors rather than trading like digital gold.
SCENARIO ANALYSIS
BULLISH SCENARIO - Breakout Above $90,000
Trigger Conditions:
Daily close above $90,500 with volume
ETF inflows resume/accelerate
JPMorgan or other major bank announces crypto trading launch
Positive regulatory news
Break above 365-day MA
Price Targets if Bullish:
Target 1: $92,000-$93,000 - First resistance above range
Target 2: $95,000 - Psychological level
Target 3: $100,000 - Major psychological barrier
Extended: $170,000 (JPMorgan analyst target for 2026)
Bullish Catalysts:
JPMorgan crypto trading launch
Morgan Stanley E*Trade crypto (H1 2026)
Charles Schwab Bitcoin trading (H1 2026)
Arizona crypto tax exemption bills
Trump administration pro-crypto policies
ETF inflow recovery
Institutional adoption acceleration
BEARISH SCENARIO - Breakdown Below $85,000
Trigger Conditions:
Daily close below $85,000
ETF outflows accelerate
Funding rates continue declining
Dolphin wallets continue distributing
Break below 365-day MA confirmed
Macro risk-off event
Price Targets if Bearish:
Target 1: $82,000-$83,000 - Secondary support
Target 2: $74,508 - 52-week low
Target 3: $65,000-$70,000 - Major support zone
Bear Market Bottom: $56,000 area (realized price)
Bearish Risks:
5 on-chain indicators warning of bear market
Below 365-day MA for first time since 2022
Demand growth rolling over
ETF inflows losing momentum
Dolphin wallets reducing exposure
Funding rates trending lower
YTD performance negative (-6.25%)
30% down from ATH
NEUTRAL SCENARIO - Continued Range Trading
Most likely short-term outcome:
Price continues oscillating between $85,000-$90,000
Low volume holiday trading
Wait for January 2026 for directional clarity
Institutions reassess positions in new year
Watch for ETF flow data in early January
MY ASSESSMENT - NEUTRAL TO SLIGHTLY BEARISH
The evidence is genuinely mixed, but the weight leans bearish:
Bearish Factors (Dominant):
5 on-chain indicators warning of distribution phase
Below 365-day MA - historically bearish
Demand growth diverging from price
ETF inflows slowing
Sophisticated holders (dolphins) reducing exposure
Funding rates declining
YTD, 3M, 6M, 1Y all negative
30% down from ATH with no recovery momentum
Bullish Factors (Secondary):
Wall Street adoption accelerating (JPMorgan, Morgan Stanley, Schwab)
Pro-crypto regulatory environment under Trump
Arizona tax exemption bills
JPMorgan $170K price target
Institutions holding ETF positions despite drawdown
Short-term metrics slightly positive
My Stance: NEUTRAL with Bearish Lean
I believe the path of least resistance is sideways to down in Q1 2026. The on-chain data is too concerning to ignore. However, Wall Street adoption could provide a floor and eventually drive recovery.
Strategy:
Trade the range - buy support, sell resistance
Don't get caught in the middle
Respect $85,000 as critical support
Respect $90,000 as critical resistance
Wait for breakout confirmation before directional bets
Reduce position size given uncertainty
Trade Framework
Scenario 1: Bullish Breakout Trade
Entry Conditions:
4H candle closes above $90,500
Volume exceeds recent average
ETF inflows positive
Trade Parameters:
Entry: $90,500-$91,000 on confirmed breakout
Stop Loss: $88,000 below recent support
Target 1: $93,000 (Risk-Reward ~1:1)
Target 2: $95,000 (Risk-Reward ~1:1.8)
Target 3: $100,000 (Extended)
Scenario 2: Range Trade - Buy Support
Entry Conditions:
Price tests $86,600-$87,200 support zone
Bullish rejection candle
Volume spike on bounce
Trade Parameters:
Entry: $86,800-$87,200 at support
Stop Loss: $85,500 below support zone
Target 1: $89,000 (Risk-Reward ~1:1.5)
Target 2: $90,500 (Risk-Reward ~1:2.5)
Scale out at resistance
Scenario 3: Bearish Breakdown Trade
Entry Conditions:
4H candle closes below $85,000
Volume confirmation
ETF outflows accelerating
Trade Parameters:
Entry: $84,500-$85,000 on confirmed breakdown
Stop Loss: $87,500 above recent support
Target 1: $82,000 (Risk-Reward ~1:1)
Target 2: $78,000 (Risk-Reward ~1:2.5)
Target 3: $74,500 (52-week low)
Risk Management Guidelines
Position sizing: 1-2% max risk per trade (reduced due to uncertainty)
Thin liquidity = amplified moves - use wider stops
Holiday period trading - expect erratic price action
Watch ETF flow data closely
Monitor on-chain metrics for trend confirmation
Don't fight the range - trade within it
Scale out at targets rather than all-or-nothing
Be prepared for extended consolidation
Invalidation Levels
Bullish thesis invalidated if:
Price closes below $85,000 on daily timeframe
ETF outflows accelerate significantly
Funding rates go deeply negative
Dolphin distribution accelerates
Break below 52-week low ($74,508)
Bearish thesis invalidated if:
Price closes above $93,000 with volume
ETF inflows surge
Reclaim 365-day moving average
JPMorgan announces crypto trading launch
Major institutional adoption news
Conclusion
BINANCE:BTCUSDT is at a critical juncture. After hitting an all-time high of $126,272 in October 2025, Bitcoin has corrected 30% and is now stuck in a consolidation range between $85,000 and $90,000.
The Concerning Data:
5 on-chain indicators warning of potential bear market in 2026
Below 365-day MA for first time since 2022
Demand growth diverging from price
ETF inflows losing momentum
Sophisticated holders reducing exposure
YTD: -6.25%, 3M: -21.67%, 6M: -18.27%
The Hopeful Data:
JPMorgan exploring crypto trading
Morgan Stanley, Charles Schwab launching crypto in H1 2026
Arizona crypto tax exemption bills
JPMorgan analysts target $170,000
Institutions holding ETF positions despite drawdown
Key Levels:
$90,000-$90,500 - MAJOR RESISTANCE (breakout level)
$86,600-$87,200 - MAJOR SUPPORT (current test)
$85,000 - CRITICAL SUPPORT (must hold)
$70,000 - Realized price (bear market bottom zone)
The Setup:
Bitcoin is range-bound with thin liquidity. The on-chain data suggests we may be in a late-cycle distribution phase with bear market risk in early 2026. However, Wall Street adoption is accelerating, which could provide a floor.
Strategy:
Trade the range - don't predict the breakout
Buy $86,600-$87,200 support with stops below $85,000
Sell $89,000-$90,500 resistance
Wait for confirmed breakout before directional bets
Reduce position size given mixed signals
Watch January 2026 for clarity
The market is at a decision point. Let price action guide you, not predictions.

XRPUSD - ETF Inflows Hit $1.2B But Whales Dumpingb]Executive Summary
BITSTAMP:XRPUSD is trading at approximately $1.92 after recovering from recent lows, currently testing the critical $1.95 resistance level. Despite the historic launch of US spot XRP ETFs accumulating $1.2 billion in assets with ZERO negative outflow days, the price remains under pressure. On-chain data reveals a troubling divergence: while retail piles into ETFs, whales have been systematically offloading holdings on exchanges. This analysis examines whether XRP can break through $1.95 resistance or if continued whale selling will push price toward the $1.50-$1.66 support zone.
NEUTRAL BIAS - Two Scenarios Presented
I'm presenting both bullish and bearish scenarios because the data is genuinely mixed. ETF inflows are historically bullish, but whale behavior is bearish. Let the market show its hand.
Current Market Context - December 21, 2025
XRP finds itself at a fascinating crossroads:
Price: $1.9249 (up 0.18% on the day)
Day's Range: $1.9014 - $1.9257
52-Week Range: $1.6106 - $3.662
Market Cap: $116.52 billion (battling BNB for #3 spot)
24h Trading Volume: $2.36 billion
Down 50% from July 2025 ATH of $3.65
The broader context:
Crypto market shed over $1.3 trillion since October
XRP down 30%+ over past three months
Fed hawkishness pressuring all risk assets
Yet XRP ETFs seeing unprecedented inflows
THE BIG STORY: ETF Success vs. Whale Dumping
Historic ETF Launch - $1.2 Billion in Assets
Canary Capital launched the first US spot XRP ETF, hitting nearly $250 million in volume on its first day - a RECORD for non-Ethereum altcoin ETFs. The numbers are impressive:
Total XRP ETF Assets: $1.2 billion
Net Inflows: $1 billion since launch
Canary XRP ETF: $335 million AUM (market leader)
21Shares: $250+ million
Grayscale: $220+ million
Bitwise and Franklin Templeton also participating
ZERO negative outflow days since debut
This should be massively bullish. With Bitcoin and Ethereum, ETF launches drove significant price appreciation. So why isn't XRP responding?
The Whale Problem - On-Chain Data Reveals the Truth
CryptoQuant analyst PelinayPA uncovered the issue: whales started offloading their holdings on exchanges as ETF expectations heightened. They provided the sell-side liquidity for retail investors buying the ETF launch news.
Key findings from Exchange Inflow data:
Majority of inflows coming from 100K-1M XRP and 1M+ XRP bands (whales)
After each major inflow spike, price forms lower highs and lower lows
Supply is overwhelming demand despite ETF buying
Whales not aggressively dumping, but continuous supply increase keeps pushing price lower
This explains why XRP faces selling pressure each time it approaches $1.95
CRITICAL: Exchange inflows would need to dry up first before XRP can see a sustained bullish run.
Technical Structure Analysis
Price Action Overview - 45 Minute Timeframe
The chart shows a clear pattern evolution:
Phase 1 - Descending Channel (Previous Weeks):
Price was trapped in a descending channel/wedge pattern
Lower highs and lower lows dominated
Breakdown from the channel led to capitulation
Phase 2 - V-Bottom Recovery:
Sharp selloff found support at major support zone
V-shaped recovery initiated
Price reclaimed lost ground quickly
Phase 3 - Ascending Channel (Current):
Price now trading within an ascending channel
Higher lows forming off the bottom
Currently testing upper resistance of the channel
Fair Value Gap (FVG) identified in the middle of the range
Decision point: breakout or rejection?
Key Support and Resistance Levels
Resistance Levels:
$1.95 - CRITICAL resistance (whale selling zone, repeated rejections)
$2.00 - Psychological round number resistance
$2.10-$2.15 - Secondary resistance zone
$2.50 - Major resistance / bullish target
$3.00 - Major psychological level
$3.65 - All-time high (July 2025)
Support Levels:
$1.90 - Immediate support (current price area)
$1.82-$1.87 - FIRST MAJOR SUPPORT ZONE (historical buying activity)
$1.77 - CRITICAL SUPPORT (large accumulation zone per Glassnode)
$1.66 - Secondary support
$1.50-$1.60 - Deep support if whale selling continues
$0.79 - Next meaningful support if $1.77 breaks (THIN LIQUIDITY between)
WARNING: Ali Martinez's Glassnode data shows a THIN LIQUIDITY ZONE below $1.77. If that level breaks, there's limited support until $0.79. This is a critical risk factor.
Chart Pattern Analysis
Current structure shows an ascending channel within a larger recovery:
Channel support: Rising trendline from recent lows
Channel resistance: Parallel line connecting recent highs
Price currently testing upper channel resistance near $1.95
Fair Value Gap (FVG) sits in the middle of the range - potential retest zone
Two clear scenarios: breakout above channel or rejection back to FVG/support
Fibonacci Analysis
Measuring from the July ATH ($3.65) to recent lows:
Current price ($1.92) represents approximately 47% decline from ATH
Key Fib levels to watch for recovery targets
0.382 retracement would target ~$2.50 area
0.5 retracement would target ~$2.70 area
Fundamental Analysis
Bullish Fundamentals
1. XRP ETF Ecosystem Thriving
$1.2 billion in assets - unprecedented for altcoin ETF
Zero negative outflow days
Multiple major issuers participating (Canary, 21Shares, Grayscale, Bitwise, Franklin Templeton)
Institutional infrastructure now established
2. Ripple Ecosystem Developments
XRPL Lending Protocol launching for institutions
Fixed-term, fixed-rate loans (30-180 days)
Secured by Single Asset Vaults
Validator voting expected late January 2026
Protocol-native credit markets coming to XRPL
3. Ripple Escrow System - Institutional Design
According to XRP investor Lord Belgrave, Ripple's escrow mechanism was deliberately structured for institutional deployment:
55 billion XRP locked in escrow contracts
1 billion XRP scheduled for release monthly
700-800 million typically re-locked
Only 200-300 million effectively released monthly
NDAs with institutions across Europe, Middle East, Asia
Discussions allegedly included central banks, IMF, BIS
NDAs may be nearing disclosure phase as systems move to active deployment
4. Banks May Favor Higher XRP Price
Finance expert Dr. Camila Stevenson argues:
Banks look at whether a system can handle stress and move large sums
XRP has fixed supply - price is the only way to support larger volumes
Banks moving billions prefer fewer units representing more value
Fewer tokens = simpler settlement, less slippage risk
Higher XRP price could support smoother transfers at scale
5. Market Cap Battle
XRP market cap: $116.36 billion
BNB market cap: $117.71 billion
Only $1.35 billion difference
XRP vying for #3 spot in crypto
Bearish Fundamentals
1. Whale Selling Pressure
100K-1M XRP and 1M+ XRP bands driving exchange inflows
Whales offloaded as ETF expectations heightened
Continuous supply increase overwhelming demand
Price forms lower highs after each inflow spike
$1.95 resistance repeatedly defended by sellers
2. Thin Liquidity Risk
Below $1.77, next meaningful support is $0.79
Limited accumulation between these levels
If $1.77 breaks, could see rapid decline
3. Analyst Skepticism on Altcoin ETFs
Markus Thielen (10x Research founder) predicts:
Most non-Bitcoin crypto ETFs unlikely to achieve lasting success
Institutional demand centers on Bitcoin
Bitcoin's "digital gold" narrative resonates with institutions
Altcoins like XRP lack compelling institutional narrative
4. Macro Headwinds
Crypto market shed $1.3 trillion since October
Fed projecting only two rate cuts for 2026
Risk-off sentiment persisting
XRP down 30%+ over three months
Analysts warn of potential cooling period in 2026
5. Price Performance Lagging
7-Day: -2.78%
1-Month: -12.91%
3-Month: -7.49%
Down 50% from ATH despite ETF success
ETF inflows not translating to price appreciation
SCENARIO ANALYSIS - NEUTRAL STANCE
BULLISH SCENARIO - Breakout Above $1.95
Trigger Conditions:
Daily close above $1.95 with volume confirmation
Exchange inflows from whales decrease significantly
ETF inflows continue/accelerate
Bitcoin stabilizes above $95,000
Break above ascending channel resistance
Price Targets if Bullish:
Target 1: $2.00 - Psychological level
Target 2: $2.15-$2.20 - Secondary resistance
Target 3: $2.50 - Major resistance / analyst target
Extended: $3.00+ if momentum sustains
Bullish Catalysts to Watch:
XRPL Lending Protocol validator voting (late January 2026)
Potential NDA disclosures from institutional partners
Continued ETF inflows
Altcoin season rotation (expected January 2026)
XRP flipping BNB for #3 market cap
BEARISH SCENARIO - Rejection at $1.95
Trigger Conditions:
Rejection candle at $1.95 with increased volume
Whale exchange inflows continue/increase
Break below ascending channel support
Bitcoin weakness below $90,000
ETF inflows slow significantly
Price Targets if Bearish:
Target 1: $1.82-$1.87 - First major support zone
Target 2: $1.77 - Critical support (Glassnode accumulation zone)
Target 3: $1.50-$1.66 - Deep support if whale selling persists
DANGER ZONE: Below $1.77 = thin liquidity to $0.79
Bearish Risks to Monitor:
Continued whale offloading on exchanges
ETF narrative failing to drive price
Broader crypto market weakness
Fed maintaining hawkish stance
Break of $1.77 critical support
Trade Framework
Bullish Trade Setup
Entry Conditions:
45-minute candle closes above $1.95 with volume
RSI breaks above 55
Ascending channel breakout confirmed
Trade Parameters:
Entry: $1.96-$2.00 on confirmed breakout
Stop Loss: $1.85 below recent support
Target 1: $2.15 (Risk-Reward ~1:1.5)
Target 2: $2.50 (Risk-Reward ~1:3.5)
Target 3: $3.00 (Extended)
Bearish Trade Setup
Entry Conditions:
Rejection candle at $1.95 with upper wick
Break below $1.87 support
Volume confirmation on breakdown
Trade Parameters:
Entry: $1.86-$1.87 on support break
Stop Loss: $1.96 above resistance
Target 1: $1.77 (Risk-Reward ~1:1)
Target 2: $1.60 (Risk-Reward ~1:2.7)
Target 3: $1.50 (Extended)
Range Trade Setup (If Consolidation Continues)
Parameters:
Buy Zone: $1.82-$1.87
Sell Zone: $1.93-$1.95
Stop Loss: $1.75 (below range)
This setup works while price remains in the ascending channel
Risk Management Guidelines
Position sizing: 2-3% max risk per trade
CRITICAL: Respect the $1.77 level - thin liquidity below
Watch whale exchange inflows via CryptoQuant
Monitor ETF flow data daily
Reduce exposure during holiday low-liquidity period
Use hard stops - whale selling can accelerate moves
Scale out at targets rather than all-or-nothing exits
Invalidation Levels
Bullish thesis invalidated if:
Price closes below $1.77 on daily timeframe
Whale exchange inflows spike significantly
ETF outflows begin (first negative day)
Bitcoin breaks below $88,000
Bearish thesis invalidated if:
Price closes above $2.00 with volume
Whale exchange inflows dry up
ETF inflows accelerate significantly
XRP flips BNB for #3 market cap
Conclusion
BITSTAMP:XRPUSD presents a genuinely mixed picture. The ETF success story ($1.2B in assets, zero outflow days) should be bullish, but whale behavior tells a different story. On-chain data shows large holders systematically offloading at the $1.95 resistance level, providing sell-side liquidity for retail ETF buyers.
The Key Question: Will ETF demand eventually overwhelm whale supply, or will whales continue to cap rallies?
Critical Levels:
$1.95 - THE level to watch. Break above = bullish, rejection = bearish
$1.77 - Must hold. Thin liquidity below to $0.79
$2.50 - Bullish target if breakout occurs
$1.50-$1.60 - Bearish target if whale selling continues
My Stance: NEUTRAL
I'm not calling a direction here. The data genuinely supports both scenarios. Let price action at $1.95 determine the next move. Trade the reaction, not the prediction.
Watch For:
Whale exchange inflow data (CryptoQuant)
ETF flow momentum
XRPL Lending Protocol news (January 2026)
Bitcoin correlation and direction
This is not financial advice. Always conduct independent research and manage risk appropriately.
