self driving shifting back into autopilot (IDRV)the turn around in the nasdaq and big tech as well as related sectors and their respective etfs should also hit self driving. we should find ourselves breaking the downtrend soon.
Etfs

seems a lot like volatility has returned as the norm (SPXL)theres a chance that getting back to all time highs may take a lonh time, and when we get there we may be heading into another drop. if volatility has returned as the new norm there is a lot of evidence to suggest that we wont see a stronger market than 2021 until at least 2023. should we make a second break to the downside whether it is sooner or later a touch of vwma monthly is not unthinkable.

vix churning lower, should spring back then decline (UVXY)this is a rapid consecutive forecast going into the end of the week
i dont foresee vix ending above week highs, but there could be bounce if we dont immediately continue lower on the daily
the forecast cluster represents output from the ghost feed
this is based on qqe, rsi, vwma
14.74, 14.24, 13.81 are key levels

oil could resume the boom (GUSH)wti is still in a weekly uptrend, and that could mean bulll
ish business for GUSH.
i think every time we hit a bottom in monthly oil futures we experience a period of upside with extreme volatility until that pattern of lower weekly highs during reversal breaks on the daily.
we are just near treating VWMA as support.

energy is another sector looking for a higher low (XLE)energy bullishness is another sector rotation play that makes me think were in a better place than some seem to believe. i think we will experience additional bolatility for the time being, but so will the markets at large. we should keep a decent uptrend, unless the pullback proves more retracement than risk tolerance for outflows can support.
the long and short of it is thag bulls have given themselves room to work with, even if we go sideways for a while.

nasdaq bear making moves under week highs (SQQQ)generally this etf is going one direction: down, but the weight may be lifted off its shoulders briefly as calls expiring next week are eliminated. if we cant break to new intraday highs i would imagine sqqq has one last trip above 40 only to get sucked back to vwma.

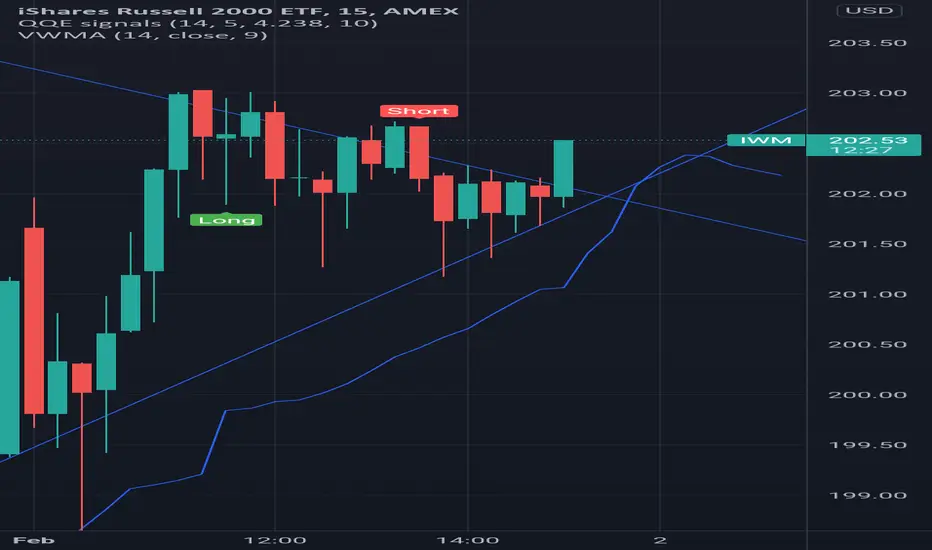
tightening range small caps broke bull (IWM)the tightening range broke to the upside. if we can treat the area as support we could continue higher into upper 202s
consecutive forecast for weeks ahead (TQQQ)i think we will see a lower high, followed by a lower low, but we will stay over the .382, and then continue higher
every period of volatility that dried up quickly or was extenuating in nature was v shaped, and every period that was more exaggerated or corrective in nature was cypher shaped.
we could bull cypher with a touch of support, but if we break it things will get much more serious quite quickly. if we break the 0 of extension the picture will clear up greatly for nasdaq bulls.
sundays session should be bullish continuation, and we should open higher monday and then begin the flush to new lows middle of the week of the 6th, unless we immediately continue higher over 59

typically these indications are a death sentence for vix (UVXY)when we cross this vwma, and the level of .618 retracement doesnt hold uvxy drops really big really fast. algos could flip bear at any moment, but there is bound to be at least one bounce worth noting between here and $12

TLT Seemingly trading higher.TLT ETF seems to be in a good place to trade higher.
Fundamentals back the technicals which is a really sweet spot for this particular ETF with the 20yr TB's.
Expect a rise out of it over the coming weeks back to the previous highs and beyond but only look to "hodl" should price provide us with a bull breakout of the AP which is the previous weekly highs.
If price rejects the highs then we suggest staying clear until the breakout takes place on the proviso you would have already removed any potential risk exposure previously accumalated.

financials sector enjoying a lead on indices (XLF)XLF is one of the instruments whose sectore had a larger terminal upthrust than others, and is enjoying a more sizeable bounce than others after the current peak in volatility.
big names like V, PYPL and BAC are putting up enoughbof a struggle to say that they have tolerance to attract inflow from key players (sm, mm, tutes, pros).
it will be interesting to see if we can confirm a higher low before tech returns to help carry the market, making way for a larger comeback that could enjoy a solid outperformance on indices; at least for the time being.

healthcare is outperforming the broader market (XLV)when an overweight sector corrects with the market volatility is higher in general, but thats why it bounces so much more quickly and outperforms other sectors in the same trend.
sector rotation will have a play in healthcare if we find a higher low, and bulls have given themselves room to complete that reversal.
we should make a higher low somewhere, even if its closer to the bottom than i anticipate, and continue to rally faster than other parts of the market as stocks benefitting from inflow seeking value accumulates.

utilities showing RHS (UTSL)reverse head and shoulders may prove defensive sector stocks may be putting in a bottom. these may do well over the weekend as pros, sm, mm, tutues, and some retail may look to these to provide value when rotation is taking money out of growth.
target 33.33 and 33.97
stop loss 32.89 as this would mean a probable touch of bottom anchored vwap band after a break of the mean.

under aavwap and breaking tightening range bearishly (UVXY)just as spx is in a buy sided tightening range top, vix is in a sell sided tightening range bear.
referto the below chart for that pattern on the 1 minute
if UVXY cant break this range bull then broader markets remain a buy as long as vix puts keep piling in
if we make a lower high and continue down this is a solid confirmation of bear vix

nasdaq futures at resistance, could beat it (TQQQ)this is simple. were at the major resistance in nasdaq furures. if we stay over the .382 of fib trend extend we will probably bull flag, and this could mean we see the 0 of that pattern quite soon (around $55.94)
stop loss around 52.89 as this would mean we need a retest of major support.

ETF:STW ASX200 key levels and trend lines analysis ASX:STW
sharing my view on the STW
Track Record – launched in August 2001, STW was the very first exchange-traded fund listed in Australia.
Core Index Exposure – a potential core Australian equity exposure for investors.
Diversification – low-cost exposure to over 90%1 of the Australian equity market capitalisation in a single transaction.
Capture Capital Growth and Income – capture potential stock growth opportunities, dividends and franking credits offered by 200 largest, and most liquid, publicly listed entities in the Australian equity market.
Rigorous Index Tracking – a rigorous investment approach that seeks to closely mirror the performance returns of the benchmark.

failing double top or continuation (UVXY)if we fail the double top, and break 18.34 confirming a downtrend with a lower high, or immediately continue bear vix, im fine with selling volatility here.
if we immediately continue over 19.17, or we set a higher low over the .382 of the bounce and break the high i would stay long vix for the time being if multiple sectors are continuing to make new lows simultaneously.
vix looks like such a tempting bull trend on many larger timeframes. the weekly is shaping up to be a great reversal from lows, but indices also look equally extended though to the downside.

vix threatening to reverse (UVXY)we are at a critical level in UVXY where oscillators like rsi are making a same low while the price has decreased somewhat.

we should see a bounce some time in the following week (SPXL)i really want to stress that i am not saying the daily/weekly trend is going to change right back to bull.
with that said, i think there is money to be made long over the next week, as long as futures sunday dont have the craziest bear session since corona.
some shorts are going to cover on the next drop, and this is going to cause a small squeeze.
i dont think all time highs are in the cards yet for broader market bulls. i do think 106 and 119 are reasonable targets. rsi is diverging bullishly, and dipping into the high teens would signal oversold conditions.
i realize this differs from my SPY forecast. that is a long term forecast on an unleveraged asset. i am using different strategies for different instruments.
qqe long entry signal should be due soon, although there have already been 3 signals that only led to small bounces, and not a return to a bull trend since the top.

crossroads for vix (uvxy)we have reached another crossroads for vix, and thus one of my favorite etfs: UVXY.
if we hold mid to high 11s the we could be up at mid 12s by friday
if we keep breaking to new lows today and tommorow then we could be back down in the low 11s by the middle of next week.

context for the crossroads (uvxy)i just wanted to show people why this could still go very badly for broader market longs.
im not doomsaying, or fear mongering here. im simply outlining why i still have a long forecast for vix, even though we are almost breaking to new lows in uvxy.
the highlighted areas are times in the very recent past where spx has increased in volatility even while indices were on the verge of fully recovering.
again, im not saying long this thing right now. im pointing out how this could still be a bullish position for vix longs even while the market appears to be about to recover fully.
dont jump into uvxy trying to call the bottom, but do stay cautious!
this can still go both ways and tuesday is going to be critical.

nq1! over night will shape the week (tqqq)nasdaq futures are looking pretty troubled right now, and if we see a large enough gap down and break last weeks low this could spell out further weakness in the index which could last into march
volume has refused to drop off, and if we see another spike it will probably be selling
taking out fridays high probably opens the gate to $76, and additional volatility likely will take us on another trip back to $66
somewhere ina that range is the perfect hourly oversold condition to dip buy, and touch of aavwap/vwma without follow through is usually pretty good resistance to topfish

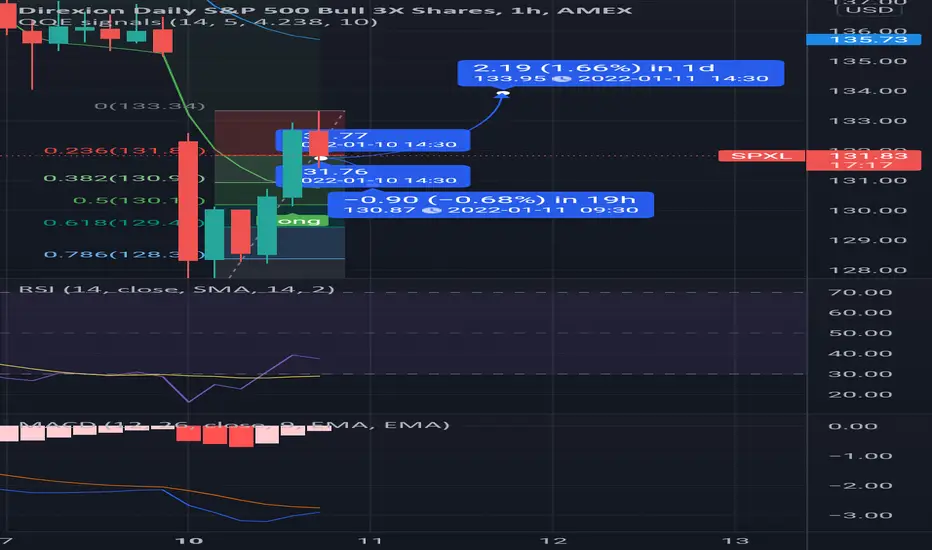
spx run up at gap close may fail (spxl)if we dont break 133.33 confidently, and confirm 15 min reversal pattern with a lower low 131.85 this may signal overheated conditions in spx
should we keep the uptrend holding 130.69 and continuing higher i imagine we have a go at 135, although id still be wary of buying borader markets right now except for a quick flip
if we dont hold 130 and cant get back over 130.66 we will probably see 127.66 again soon
volatility comes in waves
the odds we close up at the highs are low but if we do theres a good long in it