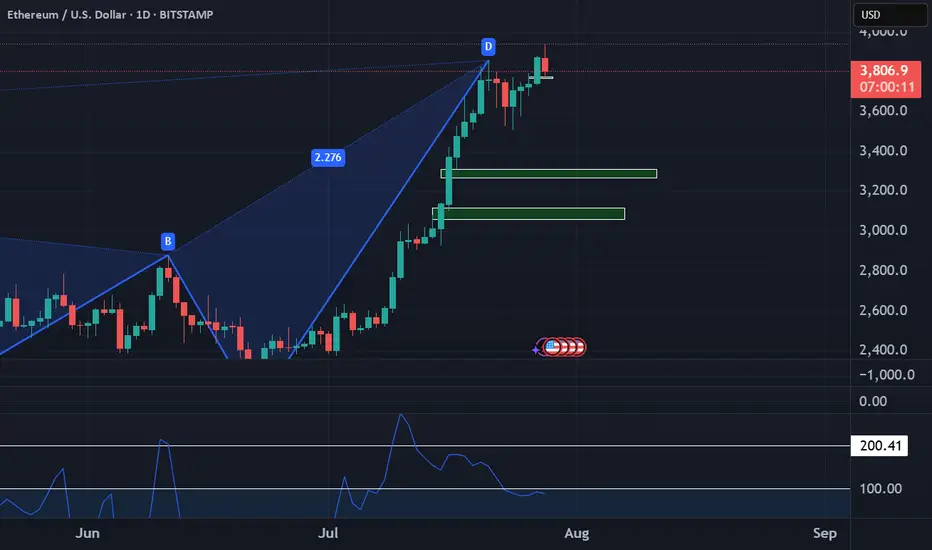
Ethereum bigger pictureToday we are measuring the difference between Ethereum's current price and its average price over a specific period. We see how far the current price deviates from its statistical average. This helps traders identify potential overbought and oversold conditions. Even though institutions and etfs have bought up over 32x the supply of Ether since May, it has showed in the past 36 Days with ether running over 80%, we look at reducing exposure as the risk remains for a correction in the short term.
Ethereum-bitcoin
Ethereum Bitcoin pair bottom confirmed!As confirmed by CRYPTOCAP:ETH \ CRYPTOCAP:BTC momentum, we can say that a local bottom was seen at 2019 accumulation levels. With a major reversal from the current region, we can see major movements across Altcoins, with Ethereum being an undeniable leading force and leader for altcoins.

ETH/BTC vs btc dominanceethereum received a reaction as we expected from the current demand zone in the bitcoin pair, and it seems inevitable that the upward momentum from the current area will continue. on the bitcoin dominance side, the same situation exists, but I think we will witness a bearish absolute process.

Ethereum is Trending HigherSince April trough, Ethereum has risen by 179%, delivering a higher rate of return than Bitcoin at 66%. But most of our attention is on Bitcoin, breaking above the 120,000 level.
Why is Ethereum quietly gaining ground —and what does the future hold for Ethereum?
Mirco Bitcoin Futures and Options
Ticker: MET
Minimum fluctuation:
$0.50 per ether = $0.05 per contract
Disclaimer:
• What presented here is not a recommendation, please consult your licensed broker.
• Our mission is to create lateral thinking skills for every investor and trader, knowing when to take a calculated risk with market uncertainty and a bolder risk when opportunity arises.
CME Real-time Market Data help identify trading set-ups in real-time and express my market views. If you have futures in your trading portfolio, you can check out on CME Group data plans available that suit your trading needs www.tradingview.com

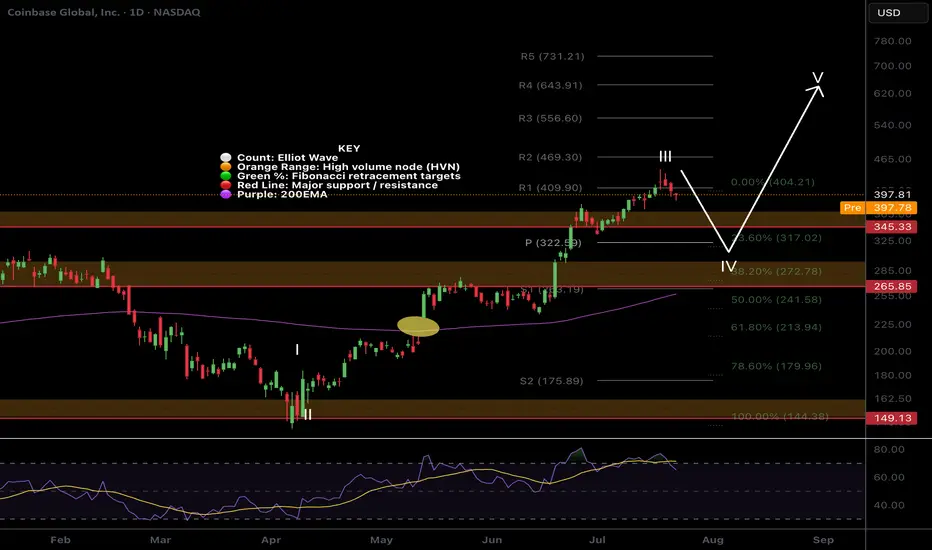
$COIN Wave 4 pullback?NASDAQ:COIN had a tremendous run, a text book Elliot wave 3 but has confirmed bearish divergence on the daily RSI.
The trend is strong so wave 4 could be shallow, only reaching the previous all time high, High Volume Node and 0.236 Fibonacci retracement and daily pivot point between $322-345
Further decline brings up the High Volume Node support at 0.382 Fib retracement and ascending daily 200EMA! Also a highly probable scenario!
Long term outlook remains around $600 target
Safe trading.
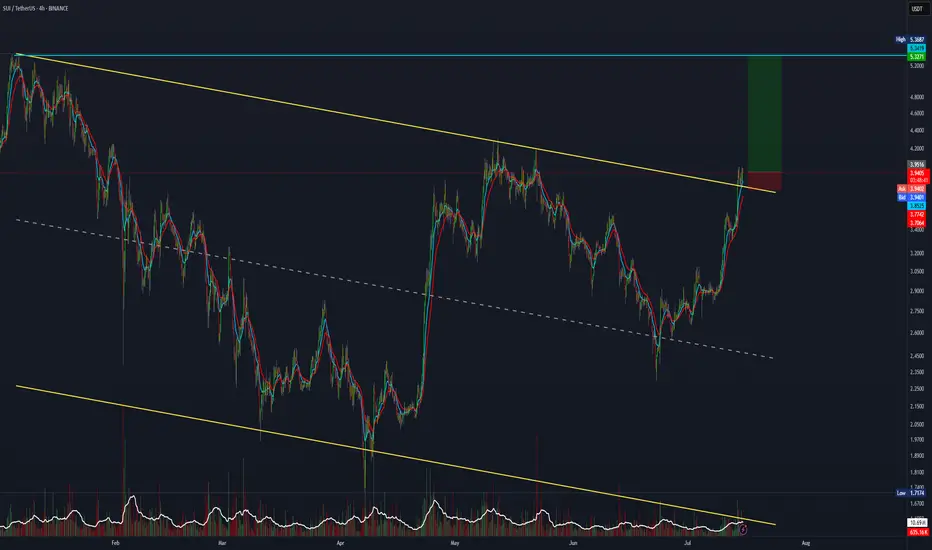
12R setup forming on SUITime to send it after that big channel retest? Clean 12R setup
Entry: 4.0
SL: 3.9
Target: 5.2

SUI trade setup with a 7:1 risk-to-reward ratio.SUI has broken out and retested the major channel. If you're bullish, this 7:1 R:R setup is worth considering.
Entry: 3.94
Stop Loss: 3.77
Target: 5.30.
20:1 R:R for SolanaTaking a chance on this super high-risk setup with a 20:1 R:R before it takes off.
Entry: 177.78
Stop Loss: 173
Target: 260

ETH/BTC 25-7-20I think there’s some clear headroom for more movement to 0.40 Ethereum per Bitcoin. Let’s see but right now is hot. Then the support after the 0.400 resistance is hit is back at 0.22, but who know what the price of Bitcoin would be at that point.
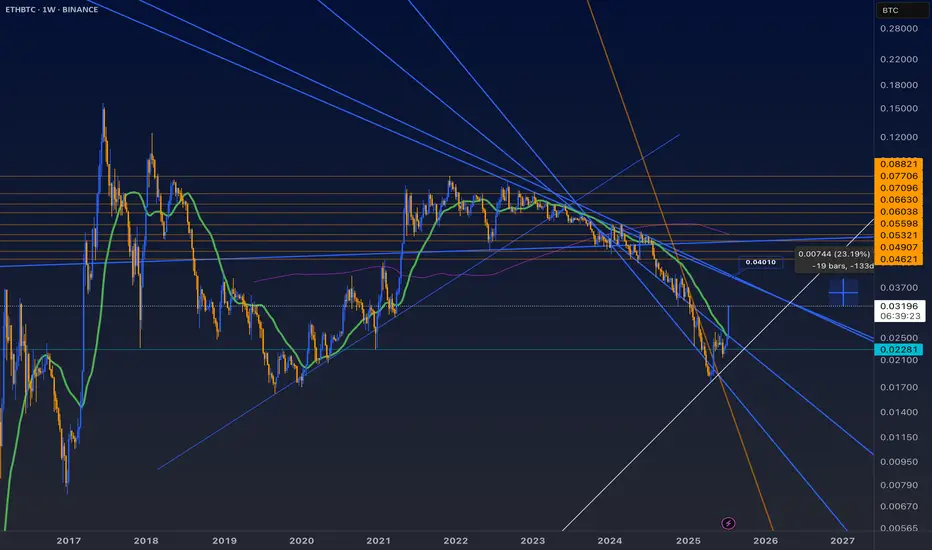
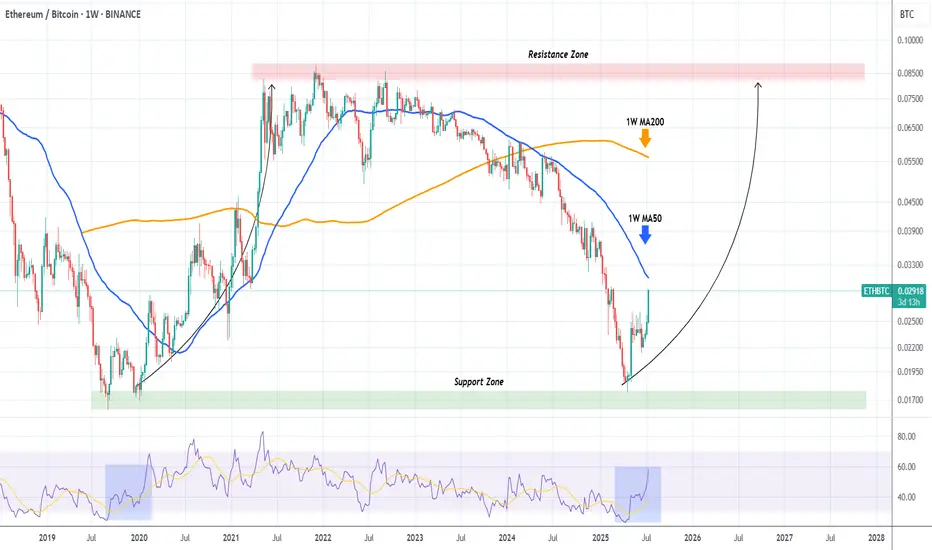
ETHBTC shows that Ethereum will outperform Bitcoin MASSIVELY!The ETHBTC pair has been rebounding hyper aggressively after the April 21 2025 Low on the 6-year Support Zone, and is now facing it's most important test, the 1W MA50 (blue trend-line).
This trend-line has been its Resistance since basically March 13 2023, so if broken, it will be a massive bullish break-out signal.
In fact during the 2020 - 2021 Bullish Leg, once the price broke above the 1W MA50, the market got the final confirmation of the upcoming long-term rally.
We expect Ethereum to outperform Bitcoin for the rest of the year at least.
-------------------------------------------------------------------------------
** Please LIKE 👍, FOLLOW ✅, SHARE 🙌 and COMMENT ✍ if you enjoy this idea! Also share your ideas and charts in the comments section below! This is best way to keep it relevant, support us, keep the content here free and allow the idea to reach as many people as possible. **
-------------------------------------------------------------------------------
💸💸💸💸💸💸
👇 👇 👇 👇 👇 👇
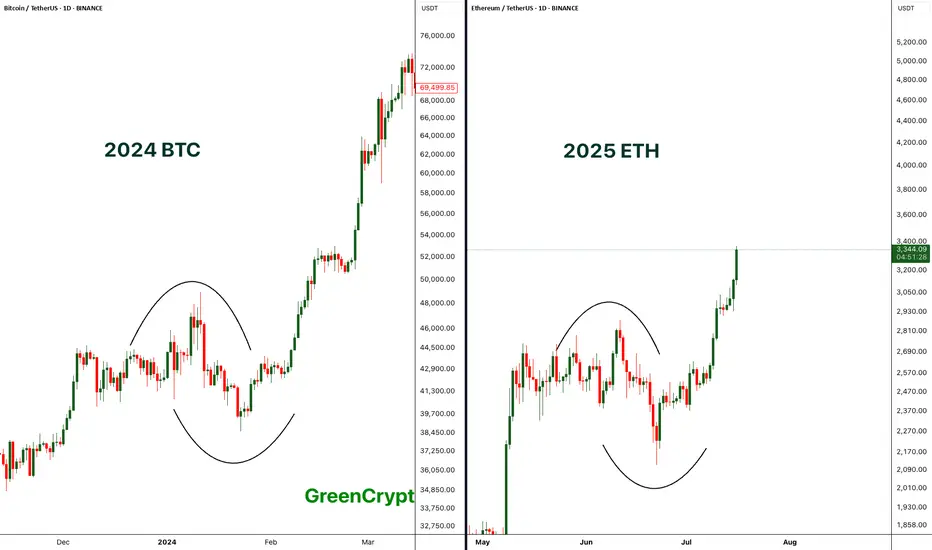
Comparing BTC 2024 with ETH 2025 - Perfect Match- If compare the chart pattern of BTC from 2024 with the current 2025 ETH pattern, wee see exactly similar chart patterns being formed here.
- Price started consolidating then it had fake breakout towards both the sides and finally the real breakout.
- BTC breakout push the price towards the new all time high above 69K, if we ETH follows similar trend then we can expect new all time high on ETH.
Let's see how it plays out.
Stay tuned for more updates.
Cheers
GreenCrypto
ETHBTC: Ethereum to outperform massively Bitcoin.ETHBTC turned neutral again on its 1D technical outlook (RSI = 41.566, MACD = -0.00033, ADX = 21.423) as in the past 4 weeks it failed to extend the rebound of the April 14th bottom. Ahead of a MACD Bullish Cross, a little further correction to make a Double Bottom (DB) would make the pattern more bullish, much like the December 9th 2019 DB. That was the start of Ethereum's bull season. Similarly, we expect it to start outperforming Bitcoin massively and approach the R1 level (TP = 0.0800).
## If you like our free content follow our profile to get more daily ideas. ##
## Comments and likes are greatly appreciated. ##

ETH - Trading at crucial resistance levelBINANCE:ETHUSDT (1W CHART) Technical Analysis Update
ETH is currently trading at $2500 range and the price is at crucial resistance zone, previously ETH had one if its largest crash after this support line was broken, now the same support line is acting as resistance.
50 EMA is also acting as a strong resistance in this are.
ETH needs to breaks this resistance to reach the next resistance around 4k USDT. if ETH cross 3K then 4k is an easy target.
Im expecting this resistance to break in next couple of weeks.
Short term target 3100
Mid Term Target 4000
Long Term Target 7000-9000a
a
aRemember to set your stop loss.
Follow our TradingView account for more technical analysis updates. | Like, share, and comment your thoughts.
Cheers
GreenCrypto

$ETH / $BTC Inverse Head and Shoulders Confirmed! NGL pretty much every chart i'm looking at rn looks crazy bullish 🐂
Inverse Head and Shoulder confirmed on ETH / BTC 🤯
The real test comes at the 200DMA as CRYPTOCAP:ETH has not traded above it in the past 307 days.

ETHBTC: Ethereum to gain massively against Bitcoin.Ethereum is overbought on its 1D technical outlook (RSI = 72.854, MACD = 228.230, ADX = 38.542) due to the rebound it initiated last week. Even though it is still on its very early stages, this rebound and statement of its strength is better viewed on the ETHBTC pair against Bitcoin. As you can see, ETHBTC bottomed on a level that it hasn't seen since January 6th 2020. The massive downtrend since 2023 is comparable to the one that started in 2018. Similar bottoms, similar 1W RSI sequences. We expect this rebound to be the main driver all the way to the 7 year Resistance level (R1). Traders of this pair can target 0.0800 on the long term.
## If you like our free content follow our profile to get more daily ideas. ##
## Comments and likes are greatly appreciated. ##

Welcome to ALT SEASON (Real) | BTC.D & ETH/BTCCRYPTOCAP:BTC.D is rejecting off 2021 POI and deviating this cycle's high having just closed the weekly under 64%. Coupled with CRYPTOCAP:ETH strength showing signs of a trend reversal after downtrending for 4-year against $BTC. Likely see CRYPTOCAP:ETH trade upwards of US$5000 this year as ETH outperforms BTC.

ALERT: ALT SEASON INCOMING? 🚨 ALERT: ALT SEASON INCOMING? 🚨
Take a close look at the BTC/ETH chart — we’re seeing early signs of a major rotation out of Bitcoin and into Ethereum and altcoins. Historically, when the BTC/ETH ratio starts to fall, it's a clear signal that capital is flowing into altcoins, marking the beginning of alt season.
🔍 The ratio is showing bearish divergence and approaching a key support zone. If this level breaks, ETH is likely to outperform BTC significantly — and we all know what follows: altcoins explode.
📉 BTC dominance is stalling, ETH gaining strength, and altcoins are waking up. The market is shifting. Don't get caught late.
🚀 Get ready. The alt season might just be starting now.
#AltSeason #Crypto #BTC #ETH #TradingView #CryptoTrends

Alt season is here ! I have done an analysis on ETHBTC vs BTCUSD which has consistently predicted the phases when altcoins do well. This is only when there's liquidity in the system and thus, even the broader stock market does very well.

ETHEREUM BITCOIN (BEST-CASE)CRYPTOCAP:ETH is the main platform for thousands of apps and blockchains, all powered by the Ethereum protocol.
This vibrant ecosystem fuels innovation and a wide range of decentralized apps and services.
Free and global Ethereum accounts
Pseudo-private, no personal information needed
Without restrictions anyone can participate
No company owns Ethereum or decides its future

ETHUSDFrankly, it has a very bad chart... The purple support area, $1,500, is the last stronghold for the bulls, and if it doesn't hold, we've officially entered a bear market and are headed towards $800-$1,000.

SHIRO is Ready to Explode – The Rally Hasn’t Even Started YetWe’re watching SHIRO real close — and I gotta say, the pump potential is very real! After that correction that shook out all the paper hands, the lane’s open for new entries. Any fresh cash flow could send it flying 📈. SHIRO could easily smash through the SEED_TVCODER77_ETHBTCDATA:2B market cap in no time. And if they drop staking, get that Binance integration, and the Shiba profiles come back hyping it… it’s moon time for real 🌕✨
Let’s not forget: SHIRO NEKO comes from the same crew behind Shiba Inu, with the same team running it. Just look at where Shiba went, right?
That first billion? Just the beginning... SHIRO hasn’t even started its real pump yet.
Keep your eyes on it. 💅🚀 #SHIRO #CryptoGems BINANCE:BTCUSDT BINANCE:ETHUSD

ETH - is the worst over ? Can we expect reversal ?As shown in the chart, ETH has reached the trendline support and is currently trading near a key support zone. This critical level will determine whether ETH initiates a reversal from its long-term downtrend that began last December.
I anticipate this support to hold, leading to a strong rebound in ETH's price. If the reversal occurs from this zone, ETH could reach its peak around Q4 2025.
Let’s see how it unfolds!
Cheers,
GreenCrypto

Ethereum’s Rebound: V-Shaped Surge to an October 2025 PeakI have come today with a new ETH perspective, one that I think is more accurate than my last ETH TA.
Take a look here at how I got this one wrong, mainly because I was counting too much on this diagonal support to hold. Why didn’t it hold? Because there were too many traders looking at it, and when too many people are watching, the opposite happens, and it breaks.
I would advise looking at this TA first before you carry on with this one because the two tie together neatly.
My view is that from here, we will start a V-shaped recovery that will send ETH to $15,000–$18,000 by mid-October 2025. There is a very interesting fractal playing out that I discovered.
So, my alarm went off with this "Wyckoff Spring" indicator. It has only fired off two other times in history: once at the bottom of the COVID crash and the other time at the December 2016 bottom when ETH was just $8. So, I thought, well, let’s take a look to see if the first cycle has anything interesting.
As soon as I flipped to the daily chart, I immediately saw similarities. What if ETH is forming the fractal from the first cycle before the massive run-up? The timeframe and the drawdown percentages are nearly the same, the fractal is nearly identical, and the fact is, the Wyckoff Spring has fired off now, forming this fractal like in 2016. What are the chances…?
When you overlay the fractal, it lines up with mid-October 2025.
I have scanned the entire history of ETH, and I cannot find a fractal closer to this one. This could very well be the pico bottom for ETH this year.
