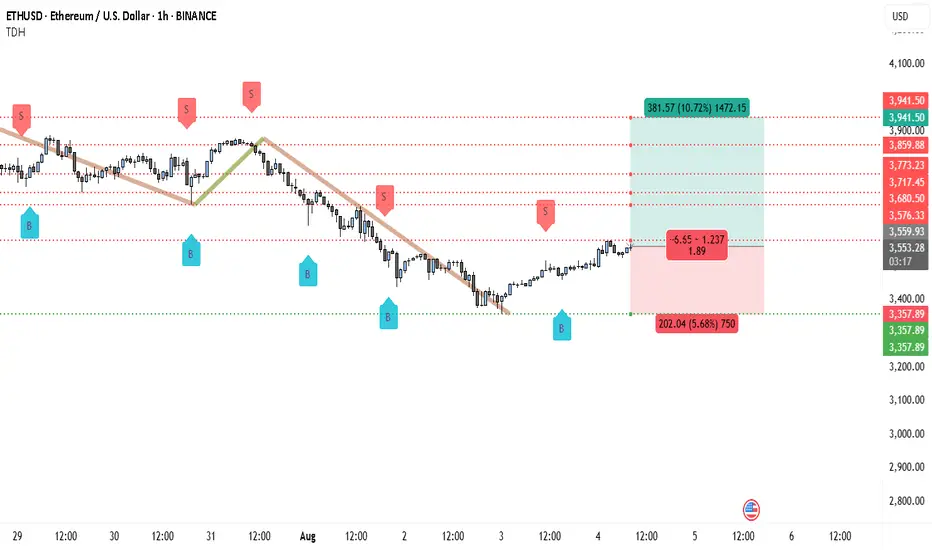
Ethereum’s 1H Chart Screams Breakout — Next Stop $3,941?Ethereum has recently broken above a short-term descending trendline that had been guiding the market lower over the past sessions. This breakout occurred after price formed a strong base around the $3,357 support zone, indicating that sellers were losing momentum. The “B” buy signals printed near these lows further strengthen the bullish outlook.
The immediate resistance lies around $3,559, which is the level price is currently approaching. If buyers can maintain momentum above this area, the n
Ethlongs
ETH - LONGEthereum has dropped more than 40%, it was hacked, people sold, and it's also a bit lower than before the election results. The Fear & Greed Index is at 10, something that hasn't happened since 2022. It's time to give it a chance. I think it's a good buying opportunity. There is support at 2000 and then around 1700. So it could keep falling, but I think it's a good time to start preparing anyway.
Why ETH offer double return over BTC in the last year? I hope you're doing great! I wanted to share some exciting news with you about the performance of Ethereum (ETH) over the last year.
As you may know, Bitcoin (BTC) has been the talk of the town for quite some time now. However, ETH has been silently outperforming BTC over the last year. ETH has grown over 5.7% in value in the previous 12 months, while BTC has last only 6.06%. That's right, and ETH has nearly doubled the growth of BTC!
This clearly indicates that ETH is becoming a more valuab
ETH : $4303$ETH
If $881 was the bottom for #ETH, everyone who are looking for $500 to long ETH will be buying $ETH much higher.
Mid Term scenario:
Provided $ETH stays above $1248, we will surely see a move towards $1788. If we claim $1788 and flip it to support,
$ETH charts extended fib indicate a move towards:
$1838, $1976, $2171, $2420, $3139 and $4303.
This move will be surprisingly fast.
If DEC Interest rates increment slows down to 50bps and shows signs of further narrowing, we could see thes
Ethereum double bottom & Ascending triangle breakout? I'm looking at Ethereum chart in multi- timeframe. Using trend based fib extension, I showed you that 100 % projection of A wave / from November top/ATH/ to January low has been completed. In daily timeframe there is a nice Adam & Eva double bottom pattern with ascending triangle/. Such kind of pattern there are on total market cap and BTC charts as well. At 4h timeframe there is ascending triangle too. Its resistance has been tested 4 times. To get confirmation of the breakout we need BTC 4h a
ETH - Daily chart - Long scenarioLooking if Price will move as marked. (Orange arrow). Where i would enter the long at the cross between the two trendlines and a by then Support area.
Target is based on the next big Resistance area.
Dont forget:
- Watch your Risk management
- Bitcoin has an influence on all Altcoins, be aware of movements there
- DYOR (Do-Your-Own-Research)
- This information / article is only for educational purporses and not a recommendation to buy or sell.
I'm not a Financial Advisor.
Thanks for reading