use stopless but... "ENERGY WEB NEXT LEG UP?!?!" Already has pumped 76% in 7 days but whos counting :P. I feel like there is some driving force of adoption or partnership I'm not seeing but with the way this baby skips across the 50 EMA all the time. I can't help but wonder if this graph shows this WOUND UP yet again. I am going to place a small wager with stop loss because I believe its ready to fire one more time before pull back. BE CAREFUL AND DYOR!!!
EWT

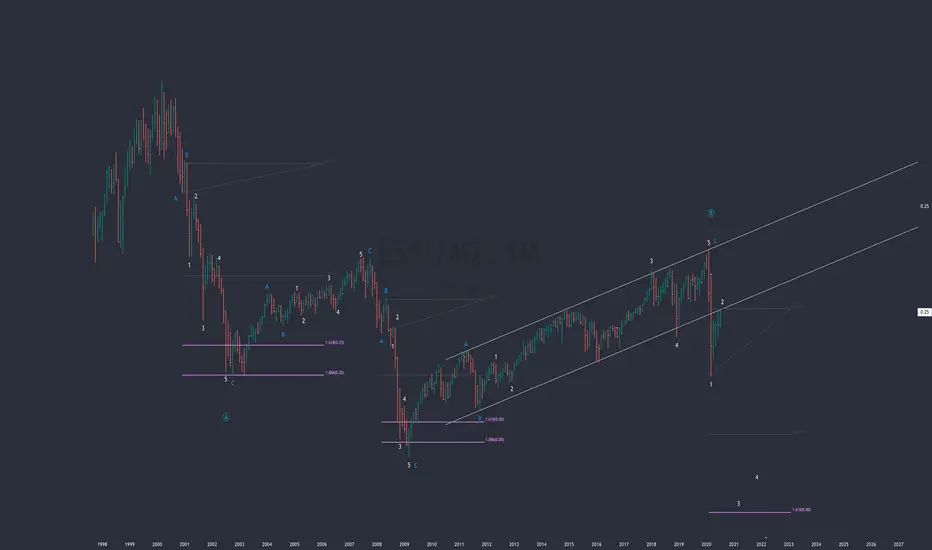
$ES/M2 - Correction Still in Play? Inspired by @HRXOLABS post LINK
i decided to apply EWT and I think we may have one more pullback before the monster rally.

✳️ Energy Web Token [EWT/BTC] on July 21 #EWT $EWT #EWTBTCEWT is moving in some pretty good patterns and preparing to breakout and rising to the 80000sts zone
In case EWT falls out of the support zone of 57000sts, you can considier buying when it returns to the 40000sts zone

$SLV SILVER LONG TERM VIEW ~5-10 years Elliot Wave Theory EWTconsidering how long the initial move down took, i'd think the last wave down before we complete the correction that began in 2011 may take just as long or longer? still think pivot at median line of channel and those fibs though.

XRP's EWT Count until EOY --> $0.8 TargetI believe XRP has bottomed in March 2020 capitulation and has begun its 1st wave out of 5 long-term bull market waves going into 2021-2022.
Wave 1 began in March and completes around EOY at around 80 cents.
Fibonacci extensions and Elliot Wave theory is used to predict levels and targets.
I present the subwaves of each of the 5 waves that comprise the macro Wave 1 ending EOY.
Cheers,
Leb Crypto

WMT - Likely Breakout to new ATHWMT has seen some serious bullish price action sparked by their recent announcement o a subscription service that puts them in somewhat direct competition with AMZN. This appears to have started a whole new wave of impulsive price action. It faced rejection today after reaching the previous all-time-high and barely breaking past it.
Price Point of Invalidation: $128-127 zone
Price target: $137.50

GSX - Impulse Almost CompleteGSX has had a run that has seemingly defied logic to some bearish investors, but the overall move it made after clearing the previous ATH was relatively healthy. Despite a massive bear campaign a few months back the stock has churned to massive new highs. However, all good (or bad if you're a bear) things come to an end. It is now due for a correction, and will likely find a topping point around the 71.21 level. This leaves the ideal opportunity for shorting.
Impulse price point (top): $70-$71.21
Overall corrective target: $49.14

NKLA - Corrective Wave Finished - New Impulse?NKLA has been coming down for sometime now, but the appropriate corrective wave has finished. We're now awaiting a new set of corrective waves before we can make new price target predictions. Very likely a quick scalp opportunity is here.
Price point of Invalidation: $40-$42 range
Quick Scalp Take Profit: $50-$52 Range


S&P500 Primary Elliot Wave count.Y wave went 0.618 to the tick.. w/ the hidden bullish divergence im leaning more bullish combined with the fact we didn't go 90%+ to meet the strong guideline for an X wave which would likely make this an expanded flat to complete 4 of the impulse that began in 2009.
still holding my $SNAP puts waiting to see how Monday plays out.

Part 2: GBPUSD, EWT Sell at Top at 3rd Wave. High Probability Trade Setup:
Sell at the Top 1.27989/1.28419 for targets 1.27048/1.26149/1.25842
Kindly, share your LOVE , by giving LIKES and Comments .


SP500 - Alternative path to 4100Earlier this week I posted how the SP500 will likely move sideways in a triangle for about a year before it starts the 5th and final wave of this historic bull market towards 4100+.
Today I'm posting my alternative wave count where the 5th and final wave is an Ending Diagonal. In both scenarios, I think we have a final wave up towards 4100 and both scenarios have choppy up and down action ahead. This scenario isn't my preferred scenario but it is another possibility.

SP500 to 4100+ after a year of sideways movementAlthough my 2019/2020 target of 3200 was met, I do not like any impulsive interpretations of the rally in 2019. Therefore, I believe we are still in a major correction that started in 2018. According to the way the structure is playing out, my bet for 2020 is sideways movement through that large triangle that will eventually give way to a 5th wave rally to 4100+.
Of course, it is possible that we have perhaps completed the bull market and are starting a new bear market. However, the weight of the evidence at this point suggests the probability that we have started a new bear market is very low.


THE MONTH AHEAD (IRA): EX. CANADA/U.S. ETF'S FOR DIVIDENDSIt shouldn't come as a massive shocker to anyone that the U.S. market has been and has gotten even more expensive. For an investor that is just starting out, it is enormously frustrating, since virtually everything is at the top of a very long term trajectory with the broad market yet again knocking at the door of all-time-highs.
Here are a few acquisition ideas for ex. U.S./Canada exchange-traded funds that pay in excess of SPY (1.90%), IWM (1.33%), QQQ (.84%), and DIA (2.21%) and TLT (average 20-year maturity treasuries) (2.22%). To put things in some additional context: HYG (High Yield Corporate Bonds) is paying 5.29% (paid monthly), EMB (Emerging Market Bonds) -- 5.45%, XLU (Utilities) -- 2.93% (paid quarterly), and IYR (REIT) -- 2.63%.*
EEM: Emerging Market. It gets huge volume (79 million 90-day) and is extremely liquid on the options side of things. The downside is that you get about TLT is currently paying in yield -- 2.22%, paid out quarterly, and fund managers had to muck it up by sticking a whole bunch of China in there. If I wanted to play a Chinese exchange-traded fund, I'd play one (e.g., FXI).
EFA: Behind the funky acronym (MSCI EAFE), this is basically a world excluding the U.S. and Canada exchange-traded fund. Sporting a 3.18% yield, it pays dividends every six months, trades healthy share volume (90-day average 18.3 million), and has good options expiry availability and liquidity, a must for investors looking to go short put/acquire/cover.
EWA: Australia. Granted, the share volume isn't great (1.7 million 90-day), but the yield is 5.54%. Expiry availability isn't fantastic and neither is option liquidity. Dividends pay out twice a year. 21.82/share as of Friday close.
EWG: Germany. 90-day 1.98 million shares average. 2.83% paid once a year. Decent expiry availability/liquidity. 26.44/share as of Friday close.
EWI: Italy. 90-day 1.90 million shares on average. 4.63% paid out once every six months. Expiry availability/liquidity isn't great, with the general solution being to be "fill picky." 26.95 as of Friday close.
EWW: Mexico. 90-day 3.20 million shares traded on average. 4.17% paid out twice a year. Good expiry availability and option liquidity. 43.64 as of Friday close.
EWT: Taiwan. 90-day 5.80 million shares traded. 2.74% paid out once a year. Expiry availability isn't great and neither is options liquidity. 36.71 as of Friday close.
EWZ: Brazil. 90-day 21.58 million shares traded. 2.71% paid out every six months. Excellent expiry availability/options liquidity. 42.11 as of Friday close.
RSX: Russia. 90-day 5.58 million shares traded. 4.31% yield paid out once a year. Expiry availability/options liquidity decent and decent. 22.51 as of Friday close.
The general play on these would be short put, acquire, then cover. Naturally, you'll probably want to drill into the charts on each of these to determine which ones might be trading at a discount.
* -- IYR, XLU, and EMB have ripped higher recently, so are kind of out of range of prices at which I'd like to acquire. Forever the optimist, however, I've got a couple "not a penny more" short puts hanging out there in XLU and HYG. (See Posts Below).

ELLIOTT WAVE: BTCUSD to retrace to golden zone before reversalI'm looking for BTCUSD to retrace to the golden zone of 0.618 ($7231.73) to end wave (2) at which point. If that occurs, target for wave (3) should be ~$80,830

Elliott wave analysis of EOS/USD.Presumably, the initials are forming in the wave , but if you look at the smaller TFs, the ascending structure looks more like a zigzag. Therefore, in the forecast and calculation I’m not sure, I can only say that below 3.06 it is extremely unlikely.

XAUUSD Ending Diagonal at Fibonacci ResistanceEnding Diagonal
An ending diagonal is a special type of wave that occurs primarily in the fifth wave position at times when the preceding move has gone "too far too fast," as Elliott put it. A very small percentage of ending diagonals appear in the C wave position of A-B- C formations. In double or triple threes , they appear only as the final "C" wave. In all cases, they are found at the termination points of larger patterns, indicating exhaustion of the larger movement.
Ending diagonals take a wedge shape within two converging lines, with each subwave, including waves 1, 3 and 5, subdividing into a "three," which is otherwise a corrective wave phenomenon.

NIO bullish forecast/guess for Thur/FridayWave 5 of 5 ends in an ending diagonal. bullish prediction for Thursday & Friday this week.

BTC Bearish case: Going to 1000 USD next yearBased on EWT the correction phase started in beginning of 2018 is not finished yet until it touches the highest levels from the 2013-2014 bull market.

ALTS TOTAL2 in longterm bearish territoryALTS seem to be in a bearish longterm territory:
Elliott Wave is missing wave number 5.
The correction of wave 2 and 4 are perfect, one steep, one flat. Wave 3 needs to be the longest.
A massive bear flag is being built.
Weekly perfected 9 on the TD sequential.
Target:
25 to 35 billions of ALTS market cap.
