Falling Wedge

Bullish potential detected for KLREntry conditions:
(i) higher share price for ASX:KLR along with swing up of indicators such as DMI/RSI, and
(ii) observing market reaction around the $0.19 resistance area from 21st November.
Depending on risk tolerance, the stop loss for the trade would be:
(i) below the potentially rising 30 day MA (currently $0.161), or
(ii) below the recent swing low of $0.15 of 29th December, or
(iii) below the ultimate swing low of $0.125 of 15th December.

EJ Falls Into A WedgeOANDA:EURJPY has formed a Falling Wedge with Lower Highs into Lower Lows!
Price has tested the Falling Support three times with the Falling Resistance, so far, only tested twice.
Typically a Falling Wedge delivers a Bearish Breakout with price falling to the downside!
If price does make a rise, we should look for it to make a third test of the Falling Resistance and if successfully rejected, we could see price drop back to the Falling Support.
Regardless, once price makes a valid Breakout of either leg and Retests, this will generate trade opportunities to take to either the Overhead Resistance or Underlying Support levels!

BITF - when structure starts to matter more than headlinesBitfarms Ltd. is a publicly traded Bitcoin mining company operating large scale mining facilities across North and South America. The core business is cryptocurrency mining with a strong focus on energy efficiency, infrastructure ownership, and geographic diversification across Canada, the United States, Argentina, and Paraguay.
From a fundamental perspective as of late 2025, Bitfarms remains a growth focused company still in its investment phase. The upcoming Q4 2025 report is expected to show EPS around −0.04 USD with projected revenue near 66.45M USD. Throughout 2025, quarterly revenue has remained relatively stable in the 69–78M USD range, driven primarily by the cryptocurrency mining segment. Cash flows remain volatile and free cash flow is still negative, which is typical for miners actively expanding capacity and upgrading infrastructure. This is not a dividend or value story, but a leveraged bet on scale, efficiency, and the broader crypto market cycle.
Technically, the structure is clean and well defined. On the 4 hour chart, price formed a falling wedge that has already broken to the upside with a clear and confirmed retest. The breakout held, sellers failed to push price back inside the pattern, and momentum stabilized. All previously existing gaps have now been fully closed, reducing downside risk from unfinished price imbalances. Price is currently sitting on a strong daily support zone, while the working timeframe remains the 4 hour chart. Higher timeframe structure confirms support validity, and price action shows early accumulation behavior.
From a tactical standpoint, Bitfarms is transitioning from a corrective phase into a potential new impulse. As long as price holds the current support zone, the path opens toward the 3.91 area. If the broader structure remains intact and crypto sentiment stays constructive, continuation toward the 6.60 zone becomes technically justified. This is not a short term hype trade, but a structured continuation setup after a confirmed breakout and retest.
Sometimes the market clears all unfinished business first, and only then starts the real move. .

Ripple road map (6h) !After the drop, the price can slightly bounce back up if buyers support it and we have a price correction. If the red trendline is broken, the price can move to the ranges we have specified.

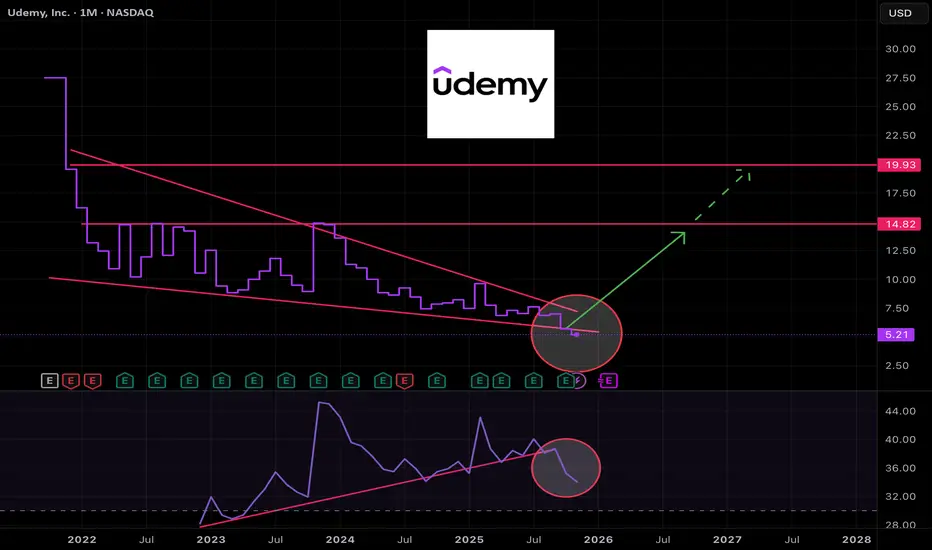
UDMY turning profitable and in deep value territoryNASDAQ:UDMY stock has been left for dead. It's formed a massive falling wedge on the monthly chart and until late has done so with improving momentum.
While not strictly aligned to disciplined charting techniques I view the recent meltdown in momentum as capitulation and a good time to start a small position.
Looking at the annual and quarterly profit figures we can see the company has been bleeding cash for years, but in recent quarters is starting to make a small profit.
It's a speculative buy, so keep the position sizing small, but I think there's room to double or even triple with sufficient time.
Another wedge?Price is landing on a string demand area and at the same time is forming a falling wedge. Looks very expulsive like the shown on the chart. Risk-reward is good. I opened a long position, SL triggers if a daily candles closes below the demand zone.

ALCHUSDT – 4H trade ideaPrice is currently forming a bullish falling wedge, with liquidity resting at the 4H FVG below.
Based on the Total Market Cap context, I’m expecting a potential AMD scenario:
Possible wick down into the 4H FVG
Followed by a bullish breakout from the falling wedge
Price is consolidating above the Monthly VWAP, which supports the bullish bias.
If we see confirmation after the sweep, continuation towards higher levels becomes likely.
➡️ Check the weekly analysis for higher timeframe context.

Ascending Channel | Golden Zone Retracement SetupAfter analyzing the chart on the 2-hour timeframe, price action has been moving within a well-defined ascending channel since Tuesday, 25 November 2025. The upper boundary of the channel has been consistently respected, confirming the strength and validity of this bullish structure.
Following a rejection from the upper boundary, price is currently trading around 1.17403. At this stage, the market appears to be developing a bearish corrective structure, resembling either an upper flag formation or a falling broadening wedge, which is still in progress and not yet completed.
Based on this structure and overall market behavior, we anticipate a potential retracement toward the Fibonacci Golden Zone, which aligns with our projected price target. This area may act as a key decision zone for the next directional move, especially if supported by price action confirmation and volume reaction.
Traders should monitor price behavior closely around the channel boundaries and Fibonacci levels for high-probability setups.
Happy Trading
SpicyPips

DOGEUSDT → Lack of bullish potential BINANCE:DOGEUSDT.P failed to break the trend. Under pressure from resistance and a global downtrend, the coin is reversing and may decline...
Bitcoin is pausing after a news rally based on rumors. The trend remains bearish. Pressure on the crypto market is present...
DOGE faced pressure in the 0.1477 - 0.155 zone. A rebound from 0.1533 is forming and the price is closing below 0.1477, forming a pre-breakout base of 0.1464. The reaction to support is weakening, confirming the weakness of the buyer. A close below 0.1464 could trigger a further decline within the range.
Resistance levels: 0.1477, 0.15337
Support levels: 0.1464, 0.1366
A breakdown of support, closing below the level, and consolidation in the short zone will once again confirm buyer weakness, which in turn may trigger a further decline.
Best regards, R. Linda!

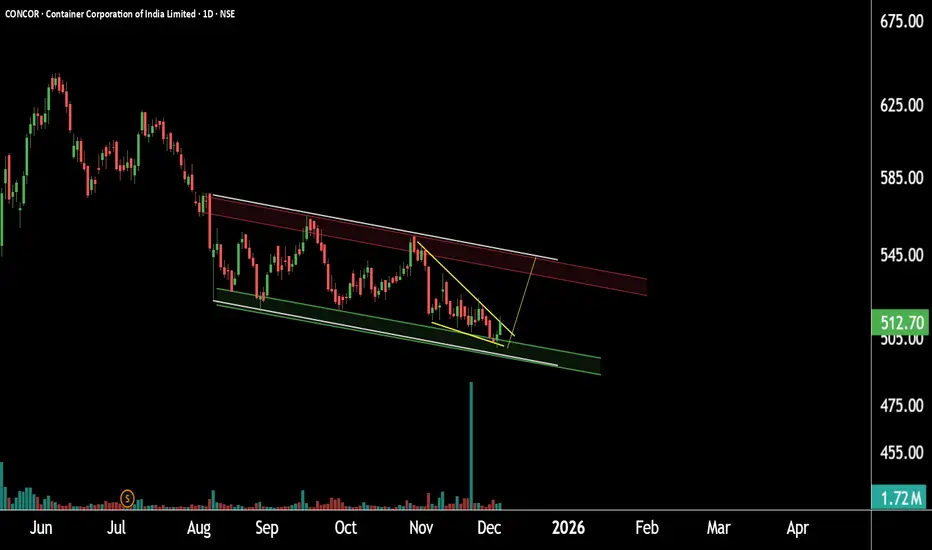
Concor Ready for Support Reversal ?This is the daily timeframe chart of Concor.
The stock is trading within a falling channel pattern, with a strong support zone around 490–510.
On the shorter timeframe, the structure is forming a falling wedge near the 500–510 area. If this support zone holds,
the stock may witness a potential upside toward 540.
Thank you.
Wipro: Breakout & Boom!This is the daily timeframe chart of Wipro.
Wipro has been forming a falling wedge pattern, and the stock has given a breakout near the ₹250 level.
The breakout has also occurred above the long-term support zone of ₹225–₹240, which strengthens the bullish structure.
If this momentum continues, then any dips from the current levels may offer strong risk-reward opportunities and potentially lead to a bigger rally.
In the shorter timeframe, the potential upside target for Wipro stands near the ₹280 level..
Thank you.

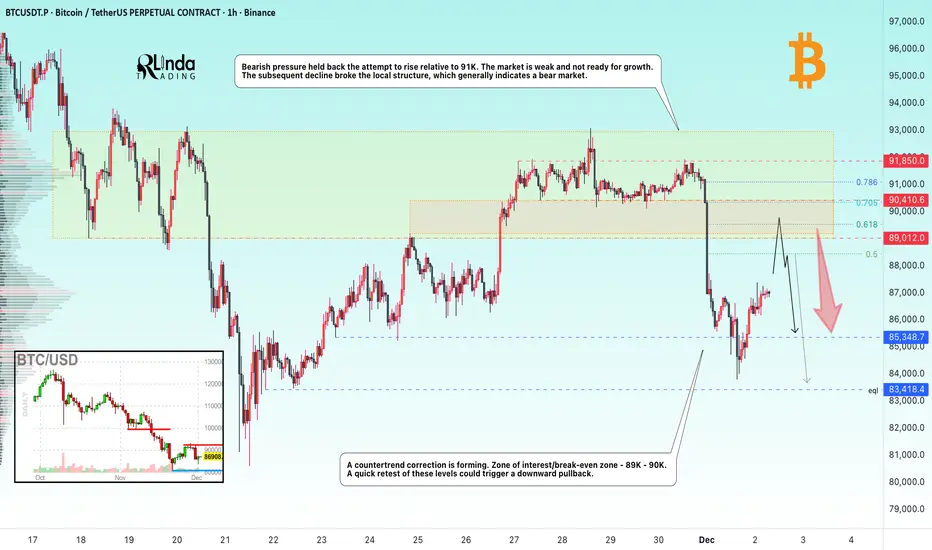
BITCOIN → The hunt for liquidity before the fallBINANCE:BTCUSDT.P continues to update lows within the global downtrend. The retest of 91K confirmed the dominance of bears...
The downtrend continues. The technical and fundamental situation for the crypto market is neutral to weak.
Bearish pressure held back the attempt to rise relative to 91K. The market is weak and not ready for growth. The subsequent decline broke the local structure, which generally indicates a bear market, but after updating the local minimum to 83700, a countertrend correction is forming. Zone of interest/break-even zone - 89K - 90K. A quick retest of these levels could trigger a downward pullback.
Resistance levels: 89K, 90K
Support levels: 85,400, 83,400
A retest of the range boundary and zone of interest could trigger a liquidity squeeze and a further decline if the bears keep the price below these boundaries.
Best regards, R. Linda!
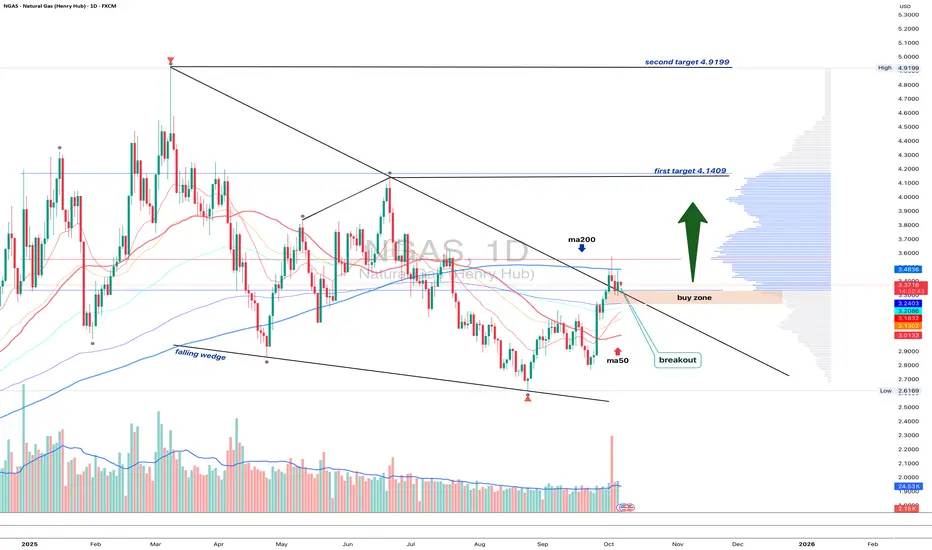
NGAS 1D - bulls waiting for the green lightOn the daily chart, Natural Gas has broken out of a falling wedge, but price remains below the MA200, while EMA still hovers above it - a mixed signal showing short-term hesitation within a longer-term downtrend.
The 3.10–3.20 buy zone remains key - that’s where the retest area aligns with short-term support. If buyers can reclaim the EMA and push above the MA200, the next upside targets are 4.14 and then 4.92.
Volume on the breakout supports growing bullish interest, while fundamentals - like rising seasonal demand - may soon add more fuel to the move.
Tactically , watch how price behaves near MA200. Once EMA flips back on top, momentum could accelerate fast. Until then, the market’s like a gas burner waiting for that click - ignition pending
It's BLACK FRIDAY on Altcoins (ENA/USDT)Global multi-billion dollar altcoin market currently on support.
Many altcoins showing life after OVERSOLD for a while.
Grab some ENA and let it ride including TP prices such as 0.3450 - 0.5125 and 0.8100 as FINAL target.

Crypto might still have gas in the tankAn equal-weight basket of popular cryptos is forming a descending wedge (bullish) on the 4 hour chart.
There's also a very mild uptick in momentum.
I wouldn't take excessive risk here, potentially add on dips to cryptos you have strong conviction on, and don't be surprised if we really are at the end of the cycle.

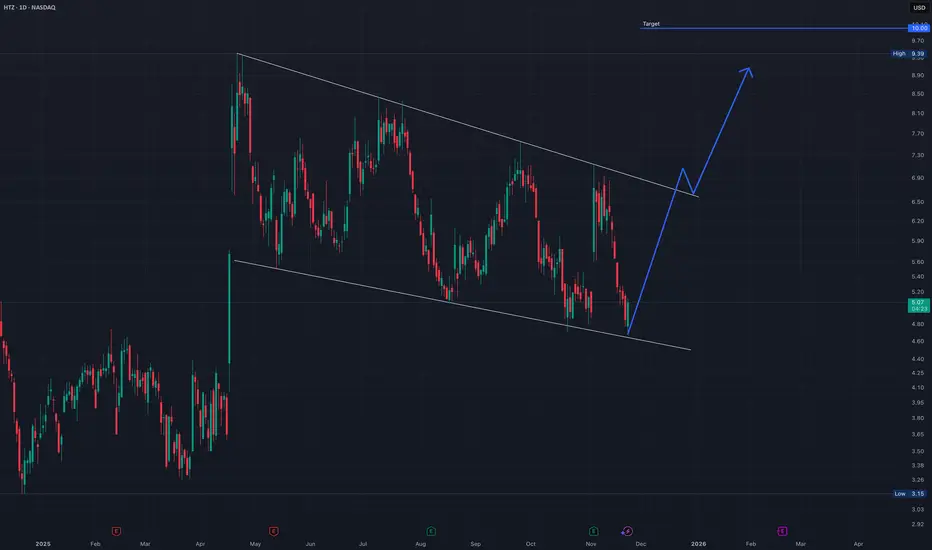
HTZ | Falling Wedge Reversal Setup - Breakout Toward $10Hertz Global Holdings (HTZ) is currently trading at the lower boundary of a well-defined falling wedge pattern, a structure that often signals a potential bullish reversal. The price has once again touched the wedge’s support line, showing early signs of reacting from this level. This repeated defense of support suggests that sellers may be losing momentum as the range continues to narrow.
If HTZ maintains support at this lower trendline and begins to push higher, the next key level to monitor is the upper wedge resistance. A confirmed breakout above that level may trigger a shift in trend, opening room for a measured move toward the $10 target area, which aligns with previous highs and the projected wedge breakout objective.
While the trend is still technically down, the structure of the wedge combined with the current bounce setup provides a constructive environment for a possible reversal. Confirmation and healthy volume on the breakout will be essential to validate the move.
(This idea is for educational purposes only, not financial advice.)
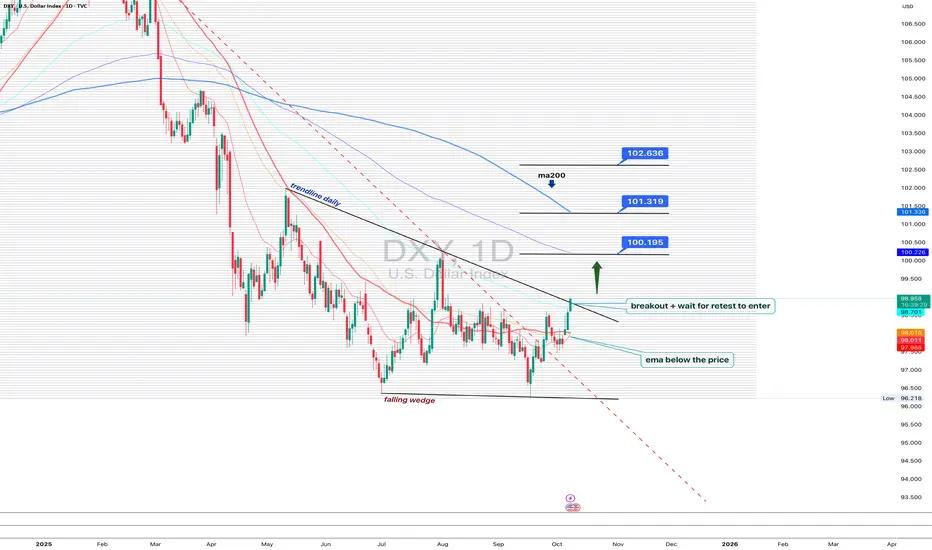
DXY 1D - dollar waking up, but patience is keyOn the daily chart, the US Dollar Index is showing the first signs of recovery: a falling wedge breakout and trendline breach hint that bulls are slowly reclaiming control. Price has moved above the EMA, a short-term bullish signal.
Still, MA200 remains above, reminding us that the broader trend is not yet flipped. The ideal play here - wait for a retest of the breakout trendline to confirm buyers’ strength before jumping in.
If price holds above 99.70, the next upside targets sit around 100.19, 101.31, and 102.63.
But keep in mind - DXY loves to test patience. False breakouts are its favorite sport.
Right now, the dollar looks ready to wake up, but maybe hit the snooze button one last time before the real move begins.
A High-Impact Support Zone Meets a Breakout StructureIntroduction
Markets occasionally compress into areas where structure, momentum, and historical buying pressure align with surprising precision. When that compression occurs at a major higher-timeframe floor, traders often pay closer attention—not because the future is predictable, but because the chart reveals a location where price behavior typically becomes informative.
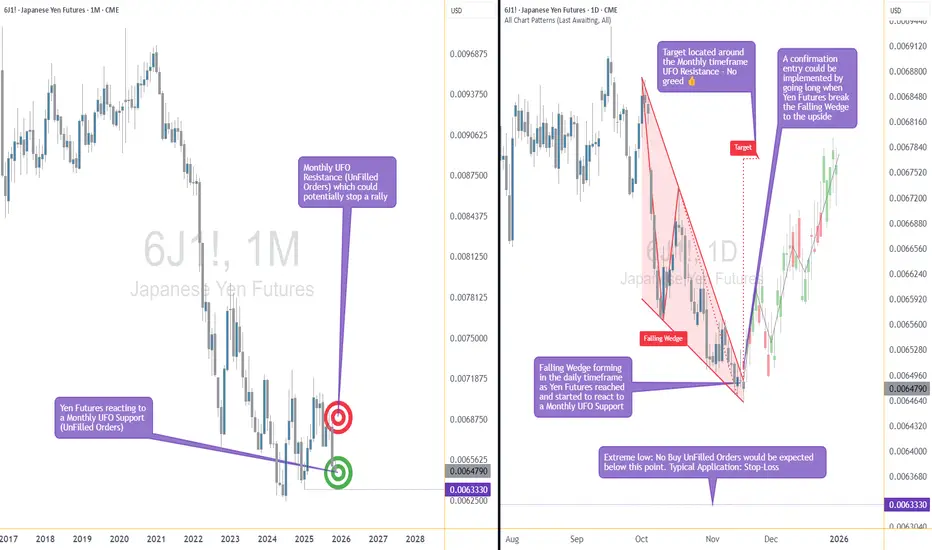
The current case study centers on a market pressing into a high-impact support zone visible on the monthly chart, while the daily chart displays a falling wedge pattern that has gradually narrowed the range of movement. This combination often highlights moments where the auction process is nearing a decision point. The purpose here is to dissect that confluence using multi-timeframe structure, pattern logic, and broad order-flow principles—strictly for educational exploration.
Higher-Timeframe Structure (Monthly)
The monthly chart shows price approaching a well-defined support area between 0.0065425 and 0.0063330, a region that has acted in the past as a base for significant reactions. These areas often develop because markets rarely absorb all buy interest in a single pass; pockets of unfilled orders may remain, leading to renewed reactions when price returns.
This type of zone does not guarantee a reversal. However, historically, when price reaches such levels, traders tend to monitor whether selling pressure slows or becomes less efficient. In this case, the structure suggests a recurring willingness from buyers to engage at these prices, forming a foundation that has held multiple swings.
The presence of a clear, higher-frame resistance at 0.0067530 anchors the broader range. When price rotates between such boundaries, the monthly context often acts as a roadmap: major support below, major resistance above, and room in between for tactical case-study exploration.
Lower-Timeframe Structure (Daily)
Shifting to the daily chart, price action has carved a falling wedge, a pattern often associated with decelerating downside movement. In wedges, sellers continue to push price lower, but with diminishing strength, as each successive low becomes less effective.
This type of compression structure can provide early evidence that the auction is maturing. Traders studying such patterns often watch for:
tightening of the range,
shorter waves into new lows,
initial signs that buyers are defending intraday attempts to drive price lower.
The daily wedge in this case sits directly on top of the monthly support zone—an alignment that strengthens its analytical relevance. The upper boundary of the wedge sits near 0.0065030, and a break above that line is often interpreted as price escaping the compression phase.
Multi-Timeframe Confluence
Multi-timeframe confluence arises when higher-frame structure provides the background bias and lower-frame patterns offer the tactical trigger. In this case:
The monthly chart signals a historically responsive support zone.
The daily chart shows structural compression and slowing downside momentum.
The interaction between them creates a scenario where educational case studies tend to focus on breakout behavior, as the daily timeframe may provide the first evidence that higher-frame buyers are engaging.
This confluence does not imply certainty. It simply highlights a location where structure tends to become more informative, and where traders often study the transition from absorption to response.
Order-Flow Logic (Non-Tool-Specific)
From an order-flow perspective, strong support zones typically develop where prior buying activity left behind unfilled interest. When price returns to that region, two things often happen:
Sellers begin to encounter difficulty driving price lower, as remaining buy orders absorb their activity.
Compression patterns form, as the market oscillates in a tightening range while participants test whether enough liquidity remains to cause a directional shift.
A breakout of the daily wedge represents a potential change in the auction dynamic. While sellers are still active inside the wedge, a breakout suggests their pressure may have become insufficient to continue the sequence of lower highs and lower lows. Traders studying market transitions often use such moments as part of hypothetical scenarios to understand how imbalances evolve.
Forward-Looking Trade Idea (Illustrative Only)
For educational purposes, here is how a structured case study could frame a potential opportunity using the discussed charts:
Entry: A hypothetical entry could be placed above the falling wedge, around 0.0065030, once buyers demonstrate the ability to break outside the compression structure.
Stop-Loss: A logical invalidation area in this case study would be at or below the monthly support, around 0.0063330, where failure would indicate the higher-timeframe zone did not hold.
Target: A purely structural wedge projection would suggest a target near 0.0067695, aligning closely with the broader resistance region on the monthly chart.
These price points yield a reward-to-risk profile that is measurable and logically linked to structure, though not guaranteed. This case study exists solely to illustrate how support-resistance relationships and pattern logic can be combined into a coherent, rules-based plan, not as an actionable idea for trading.
Yen Futures Contract Context
The larger (6J) and micro-sized (MJY) versions of this futures market follow the same underlying price but differ in exposure and margin scale. The standard contract generally carries a greater notional value and therefore translates each price movement into a larger monetary change. The micro contract mirrors the same structure at a reduced size, allowing traders to adjust position scaling more precisely when navigating major zones or breakout structures such as the one discussed in this case study:
6J equals 12,500,000 Japanese Yen per contract, making it suitable for larger, institutional players. (1 Tick = 0.0000005 per JPY increment = $6.25. Required Margin = $2,800)
MJY equals 1,250,000 Japanese Yen per contract, making it suitable for larger, institutional players. (1 Tick = 0.000001 per JPY increment = $1.25. Required Margin = $280)
Understanding margin requirements is essential—these products are leveraged instruments, and small price changes can result in large percentage gains or losses.
Risk Management Considerations
Strong support zones can attract interest, but risk management remains the foundation of any structured approach. Traders studying these transitions typically:
size positions relative to the distance between entry and invalidation,
maintain clear exit criteria when structure fails,
avoid adjusting stops unless the market has invalidated the original reasons for the plan,
adapt to new information without anchoring to prior expectations.
These principles emphasize the importance of accepting uncertainty. Even at major support zones, markets can remain volatile, and scenarios may unfold differently than anticipated.
When charting futures, the data provided could be delayed. Traders working with the ticker symbols discussed in this idea may prefer to use CME Group real-time data plan on TradingView: www.tradingview.com - This consideration is particularly important for shorter-term traders, whereas it may be less critical for those focused on longer-term trading strategies.
General Disclaimer:
The trade ideas presented herein are solely for illustrative purposes forming a part of a case study intended to demonstrate key principles in risk management within the context of the specific market scenarios discussed. These ideas are not to be interpreted as investment recommendations or financial advice. They do not endorse or promote any specific trading strategies, financial products, or services. The information provided is based on data believed to be reliable; however, its accuracy or completeness cannot be guaranteed. Trading in financial markets involves risks, including the potential loss of principal. Each individual should conduct their own research and consult with professional financial advisors before making any investment decisions. The author or publisher of this content bears no responsibility for any actions taken based on the information provided or for any resultant financial or other losses.
AUDNZD Rally Losing Steam – Watch This Reversal Zone!As we’ve seen, AUDNZD ( OANDA:AUDNZD ) recently began an upward move after forming a Falling Wedge Pattern , and it’s been in an Ascending Channel for about the past 16 days.
Currently, AUDNZD is moving into a Heavy Resistance zone(1.1662 NZD-1.1340 NZD) and a Potential Reversal Zone(PRZ) .
From an Elliott Wave perspective, it seems like AUDNZD is completing the microwave 5 of the main wave 3 . Once it breaks below the lower line of the ascending channel, we can somewhat confirm the end of the main wave 3.
Additionally, we can see a Negative Regular Divergence(RD-) forming between two consecutive peaks.
I expect that in the coming hours, AUDNZD might decline at least to the Support zone(1.1480 NZD-1.1444 NZD) . If it breaks that Support zone, we could see it dropping toward around 1.1353 NZD(Second Target) .
Stop Loss(SL): 1.16403 NZD
Please respect each other's ideas and express them politely if you agree or disagree.
Australian Dollar/New Zealand Dollar Analyze (AUDNZD), 4-hour time frame.
Be sure to follow the updated ideas.
Do not forget to put a Stop loss for your positions (For every position you want to open).
Please follow your strategy and updates; this is just my Idea, and I will gladly see your ideas in this post.
Please do not forget the ✅' like '✅ button 🙏😊 & Share it with your friends; thanks, and Trade safe.

FILUSDT — the formation is repeating, the structure is familiar.Filecoin(FIL) - is a decentralized storage system with the goal of "storing humanity's most important information." During its initial coin offering (ICO) in 2017, the project raised $205 million. The launch was initially planned for mid-2019, but the mainnet launch date was postponed until block 148,888, which occurred on October 15, 2020.
📍 CoinMarketCap : #50
📍 Twitter(X) : 667.3K
🔍 What I observe:
I’ve added the full trading history to the chart for better understanding (the chart on exchanges is cut off). The coin is liquid. I also added the prices for the public and private offerings.
There’s a large horizontal channel, or more specifically, a channel within a channel, which has been active for about 1111 days.
After another drop, a descending wedge formed, and now we are witnessing a breakout of its resistance (a retest is possible).
These patterns are ones I regularly track and trade, based on personal experience accumulated over the years and my strategy.
📊 I’ve plotted the nearest resistances and target prices with movement percentage calculations.
💭 It’s quite possible that this formation in the lower part of the wedge, coinciding with the area of lows on the support of the outer channel, was used to gather liquidity and shake out weak hands.
I also want to point out the large wicks in this zone - a characteristic pattern for accumulation points and subsequent reversals.
______
📌 Not financial advice. Observing structure and recurring phases.
Operate within your strategy and with an awareness of risks.

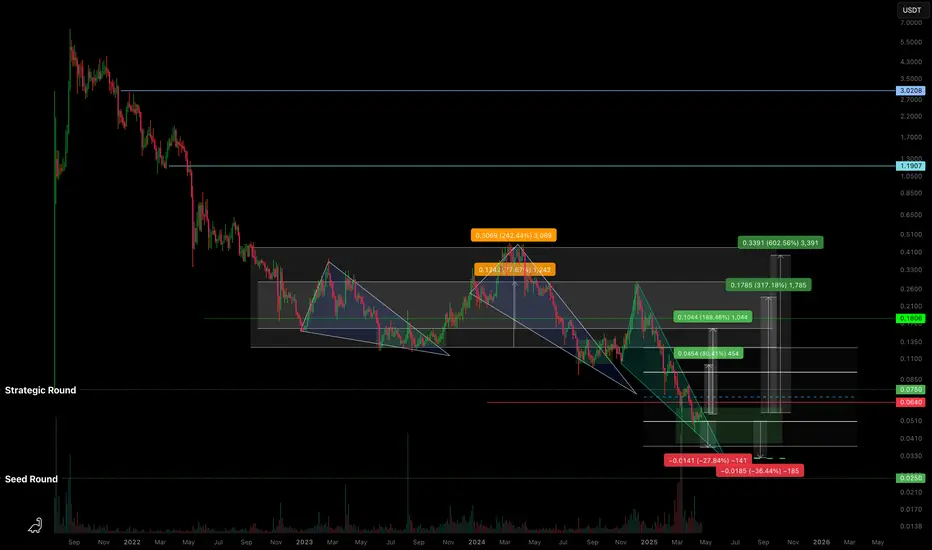
C98USDT — Descending Wedge & High R/R ZoneBased on the current structure, BINANCE:C98USDT is moving within a descending wedge , approaching zones that align with early investor positions.
🔍 What I’m seeing:
Potential drop into the range of a previous horizontal channel - marked on the chart.
We've already reached the Strategic Round level; below that is the Seed Round .
Assuming the project isn’t abandoned, it makes sense to expect investor defense in this zone.
From what I observe, there's likely accumulation happening from weak hands - at a discount .
🛡️ Approach:
As I’ve said before - you can’t treat coins like this in isolation .
They should be traded as part of a group of low-liquidity tokens , with proper risk management .
You can’t know in advance which one will “survive” without insider info from the team.
So the key is having a solid strategy and managing your portfolio and risk wisely .
📈 Targets:
Potential breakout targets from the wedge are marked on the chart.
If the market remains weak, I’ve noted a lower zone where consolidation might occur (sideways chop within a horizontal channel).
💭 Opinion:
The market is “paused” and waiting for a catalyst. You can’t rush it.
But zones like the current one on BINANCE:C98USDT seem attractive in terms of risk/reward .
The goal isn’t to guess - it’s to follow a pre-built strategy and stay focused .
📌 As always, this is not financial advice. Just my personal take and observations on the structure.
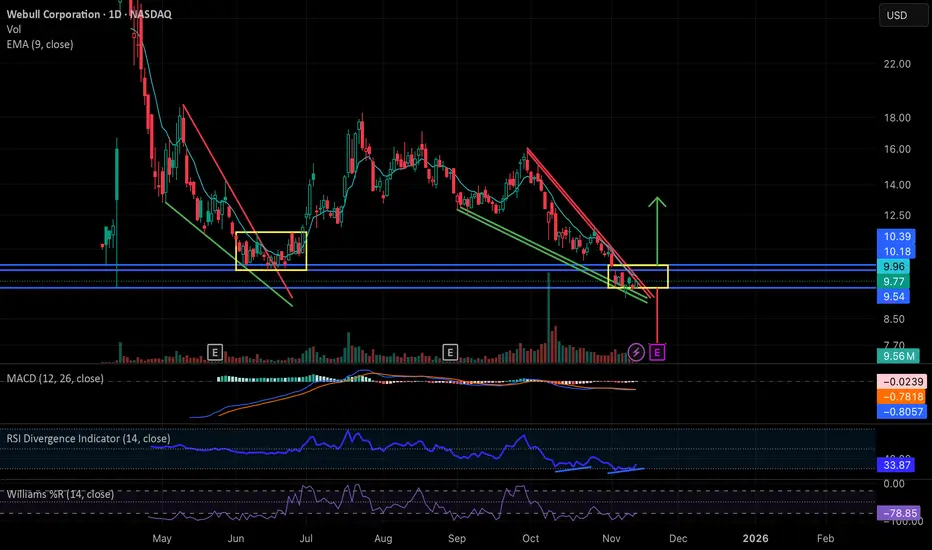
Webull: Falling Wedge Breakout ImminentNASDAQ:BULL has been in a steady decline essentially since the start of the government shutdown, forming a clean falling wedge structure very similar to the setup we saw in May and June. Back then, the wedge resolved with a brief breakout but ultimately moved into a sideways consolidation inside the yellow range before finally lifting in late June/early July.
Price is now sitting at the apex of a new wedge right as the government has officially reopened, almost to the day. With the president signing the bill, this may act as a macro green light for liquidity into year end, and BULL is positioned to potentially benefit from that.
Technically, the stock is deeply beaten down (roughly 40 percent from pre-shutdown levels), the MACD is starting to curl up, and there’s a clear daily RSI divergence. Together, these conditions make a relief move or breakout increasingly plausible.
If we don’t get a meaningful directional move between now and earnings on 11/20, then the most likely scenario is a replay of the May/June pattern: a period of sideways chop inside its current established support and resistance band zone around 9.54-10.18/10.39 while the market waits for the earnings catalyst. That report would then determine the next substantial move up or down.
In short: BULL is at a technical decision point, with momentum indicators improving, macro pressure easing, and earnings close enough that either a near-term wedge break or a consolidation-before-catalyst are both reasonable outcomes from here.