PIPPIN/USDT: LONG TRADE SETUP!!🚀 Hey Traders! PIPPIN Breakout Alert – Big Move Incoming? 👀🔥
If you’re excited for this setup, smash that 👍 and hit Follow for high-quality trade ideas that actually deliver! 💹🔥
🔥 PIPPIN Breakout & Retest – Time to Pump?
PIPPIN has broken out of a falling wedge on the 2H timeframe and is now retesting the breakout level. If this retest holds, we could see a strong rally ahead! 🚀
💰 Trade Setup:
📍 Entry: CMP, add more up to $0.019
🎯 Targets: $0.0225 / $0.0252 / $0.0294 / $0.0334
🛑 Stop-Loss: $0.018
⚡ Leverage: Low (Max 5x)
🔎 Strategy: Enter with low leverage now, scale in on dips, and ride the momentum to key targets!
💬 What’s Your Take?
Are you bullish on PIPPIN’s breakout? Drop your thoughts, analysis, and predictions in the comments! Let’s secure those gains and ride this wave together! 💰🚀🔥
Falling Wedge

BITCOIN → Short-squeeze 86-89K before falling further to 75KBINANCE:BTCUSD continues to form a downtrend after breaking the bullish structure on the weekly timeframe. There is no bullish driver yet, and technically, the price is heading to the global imbalance zone of 75-73K
The past crypto summit and any other talk of cryptovalt support cannot support the market. Such events end with further market decline.
Technically, the market continues to form a downtrend (global counter-trend), based on this alone, we can say that the price is now going against the crowd and this is generally logical behavior. Globally, the zone of interest is located in the following zones - 75K, 73K and order block 69-66K
Locally, I would emphasize the nearest liquidity zones, located at the top, which can be tested before the further fall: 86697, 89.397
Resistance levels: 85135, 86678, 89397
Support levels: 79987, 78173, 73512
After the false break of 78K support there is no strong reaction, the market is forming a struggle for 84-85K zone, which generally indicates buying weakness. Before the further fall there may be a short-squeeze relative to the above mentioned zones of liquidity, which may lead to a further fall
Regards R. Linda!

$PENGU Falling Wedge Bullish Daily CSECY:PENGU forming a falling wedge this will explote soon guaranteed I’m loading hard already! See you at the top!

QUICKUSDT → Pending a false breakout of resistanceBINANCE:QUICKUSDT is forming counter-trend movement to the resistance of the range - 0.02957. A false breakdown of the key level is formed against the background of the downtrend
The cryptocurrency market is experiencing bad times. While bitcoin is testing new lows - 76K, altcoins are cutting through to find another bottom.
QUICK stands out in this picture, testing a strong resistance (liquidity) zone 0.02845 - 0.02957 and forming a false breakout.
BUT! in the morning session bitcoin strengthens after a strong fall and can pull the whole market up with it. Thus, before the further fall another attempt to retest 0.02953 or update the tail of the false breakout at 0.03000 (0.7fibo) is possible.
Resistance levels: 0.0285, 0.02953, 0.0300.
Support levels: 0.0243, 0.02118
If the next resistance retest ends in a false breakdown and price consolidation under 0.02957, QUICK coin may continue its decline in the short and medium term.
Regards R. Linda!

Bitcoin in a falling wedge / bull pennant It’s hard to say where it will. Break up from ths pennant, I put the dotted measured line in an arbitrary spot which will almost certainly have to be readjusted and most likely further down than where I placed it but if it were to somehow break up from the wedge by then and confirm that breakout the target would be in the 145k zone. *not financial advice*

Falling Wedge Breakout in Play? Key Levels to Watch!After analyzing the chart across multiple timeframes, we have identified a Falling Wedge pattern, signaling a potential bullish breakout. Additionally, bullish divergence is visible on most timeframes, reinforcing the likelihood of upward momentum.
Currently, the price is trading above a strong support level at 146.213, indicating a solid base. Our nearest resistance stands at 147.807—a breakout above this level could pave the way for further gains. The next key targets align with the 38.2% and 50% Fibonacci retracement levels, offering potential profit opportunities.
As always, stick to your risk management strategy to protect your capital. Stay disciplined and trade wisely!

BITCOIN → The fall continues... 82K → 76K → 73KBINANCE:BTCUSD is in a sell zone. Trump's comments on the federal reserve, crypto summit failed to impact the crypto market other than a global shakeup and liquidation...
The market has failed to see a proper bullish driver, so far. Trump's comments on the Fed ended in a global shakeup (liquidation). Yesterday's summit went so far as to prevent the cryptovalt market from turning green.
Technically. Global growth is temporarily halted, the flagship is moving into a deep correction phase, with 73K still the primary target. The market needs liquidity, as it will not be possible to grow at the expense of buyers and only bullish leverage all the time.
Price is forming a 90K - 82K range in the short zone after exiting the global consolidation. False break of 91K resistance ( global consolidation support ) ended with a fall, which may continue to both 82K and 73.5K.
Resistance levels: 89400, 91K, 93K
Support levels: 82K, 78K, 73K
The key zone of interest and liquidity is 73-66K. The price is working on a false break of resistance, the imbalance of forces in favor of bears, thus the first stop may happen in the zone of 82K ( lower boundary of the range ). Further it is necessary to observe the reaction to the support. Consolidation, breakdown and consolidation below 82K will provoke a fall to lower targets.
Regards R. Linda!

60% Upside - H5 Trade of the Week!H5 Trade of the Week!
In this video, we are talking about a phenomenal potential trade that allows us to take action if we get some key items.
Everything is lining up for this one. We just need a few more items, and it will be time to enter!
NYSE:OSCR Breakout = $24/ $28
Not financial advice

USDJPY → Readiness to break the daily support levelFX:USDJPY is testing strong key support at 148.64 for a breakdown. A falling dollar could affect further movement
The falling dollar is supporting the Japanese Yen, thus we may see the currency pair falling.
The price is trying to break the support of the daily level. A pre-breakdown consolidation of 150.3 - 148.64 is formed relative to this support. The last retest of the level ended with a small false breakdown, indicating that there is no one to defend the support anymore, there was no reaction except for another local consolidation, the purpose of which is to accumulate the potential to break the support.
Resistance levels: 150.3, 150.95
Support levels: 148.64, 147.17
The focus is on the level of 148.64 concerning which the market is struggling. The bulls have little chance to hold this level, as the dollar's fall exerts quite a lot of pressure.
The breakdown and fixing of the price below 148.64 may provoke a fall to 147 - 144.
Regards R. Linda!

$HOSKY Poised for a 500% Surge Amidst Falling Wedge BreakoutHOSKY Token ($HOSKY) the first dog-themed token built on the Cardano blockchain is poised for a breakout amidst a prolonged steeped falling wedge pattern that has kept the token in suspends for almost 3 months since consolidating on the first week of December last year.
so many patterns hints at a potential bullish reversal one of which is the growing ecosystem of the cardano blockchain. Data from DefiLlama shows a growing volume in the Total Value Locked (TVL) on the Cardano ecosystem with about $442.41 Million locked so far in TVL.
Further validating the bullish thesis is the RSI which is currently at 52 giving $HOSKY more space to capitalize on the 500%. The daily chart pattern shows $HOSKY is trading below key Moving Averages (MA).
HOSKY Token Price Live Data
The live HOSKY Token price today is $1.06e-7 USD with a 24-hour trading volume of $467,937 USD. We update our HOSKY to USD price in real-time. HOSKY Token is up 5.30% in the last 24 hours, with a live market cap of $24,229,480 USD. It has a circulating supply of 227,999,999,999,931 HOSKY coins and a max. supply of 1,000,000,000,000,001 HOSKY coins.

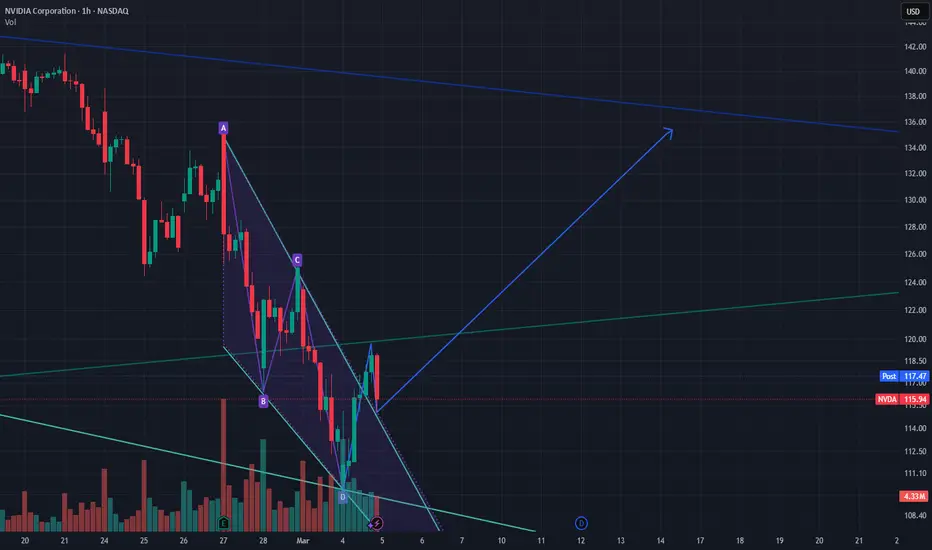
NVDA Falling Wedge Pattern Setup after retestAnother falling wedge pattern has formed on NVDA's hourly chart, with price action contained between two converging downward trendlines. The stock shows a potential bullish reversal setup after testing major support at 109. Volume has been declining during the pattern formation, which is why a falling wedge. Pull back to retest upper trendline.
SL at 108 1st target 131
BITCOIN → Testing $88K - $90K. False or true breakdown?BINANCE:BTCUSD enters the risk zone and forms a false breakdown of the key support zone. All eyes are on the bulls, whether they can keep their defense on the market or not....
On D1 - W1 price in global consolidation after strong growth. The focus is on 90-91K, a zone that is a strong support for the global trend. A false breakout is forming at the moment.
On the Local timeframe H1 - H4 the price is testing the local channel support, as well as the risk zone 89400.
If the bulls can keep the defense above 89400 - 90K, bitcoin may strengthen. The primary target in this case could be 94K
Support levels: 91280, 89400
Resistance levels: 94800, 99200
Statistically, the strongest dvjeniyas are formed after a false breakdown. But there is another question here, what kind of breakout will be - true or false.
In our case, we need to wait for confirmation, namely, for the price to consolidate above the key zones and levels. Emphasis on 89400, 90000, 91300
Regards R. Linda!

Be careful with DOGE !!!The price drops to around 0.21 and then pumps to 0.29 cents.
and if this wedge is broken, you will no longer see cardano below 23 cents.
Give me some energy !!
✨We spend hours finding potential opportunities and writing useful ideas, we would be happy if you support us.
Best regards CobraVanguard.💚
_ _ _ _ __ _ _ _ _ _ _ _ _ _ _ _ _ _ _ _ _ _ _ _ _ _ _ _ _ _ _ _
✅Thank you, and for more ideas, hit ❤️Like❤️ and 🌟Follow🌟!
❗Disclaimer
⚠️Things can change...
The markets are always changing and even with all these signals, the market changes tend to be strong and fast!!

Nifty formed falling wedge on daily time frame - Towards 20,300On daily time frame, Nifty has falling wedge breakdown.
It has good support at 20,550 on weekly closing base.
Below 20,550 it will have following targets possible,
22,000 / 21,680 / 21,300 / 20,900 / 20,600 / 20,300
Technically 20,300 possible to fill gap on day time frame.

Ethereum (ETH/USD) - Falling Wedge Breakout Setup!Overview:
A potential bullish breakout from a falling wedge pattern, signaling a trend reversal.
Key Technical Insights:
🔹 Falling Wedge Formation:
Ethereum price has been trending downward inside a falling wedge, a common bullish reversal pattern.
The price is now testing the upper wedge resistance, indicating a possible breakout.
🔹 Support & Resistance Levels:
Support: Near 2,665 - 2,663 USD, acting as a strong downside cushion.
Resistance: The price needs to break above 2,694 USD to confirm the breakout.
🔹 Target Projection:
A breakout above the wedge could push the price up by 5.35% (144 USD) towards the 2,839 USD take-profit level.
Trade Plan:
📌 Entry Strategy:
Enter after confirmation of a breakout above 2,694 USD with volume.
A retest of the wedge breakout zone could provide a better risk-to-reward entry.
📌 Stop Loss:
Placed below 2,663 USD, invalidating the breakout if breached.
📌 Take Profit Target:
Around 2,839 USD, aligning with the measured move of the pattern.
Final Thoughts:
✅ Breakout potential is strong – wait for confirmation!
✅ Bullish momentum could drive ETH towards the 2,839 USD target.
✅ If price drops below 2,663 USD, consider exiting as the setup is invalidated.
📈 Watch for volume increase to confirm the breakout. 🚀

XRP Update | $2A deeper look on price action with the 4 Market Cycles, price is at the Contraction Phase and is looking to head back to Accumulation.
Also looks like we got a falling wedge pattern to add more confluence to a bearish direction.

Oscar Health is gearing up for a BIG MOVE!NYSE:OSCR is gearing up for a BIG MOVE!
Falling wedge is forming while Wr% is climbing!
Breakout = $28 🎯
Sitting on a MASSIVE Volume shelf as well.
Not financial advice

BITCOIN → Price is in consolidation, but there are bullish signsBINANCE:BTCUSD broke resistance and gave a 4% momentum, it is not enough yet, but we have triggers and key zones. Price is still in consolidation, but it is likely that spring may be close.
You may ask - why are there two scenarios here? Up↑ and down↓ (before growth) ?
Well, the price is in consolidation and we have no clear assumptions in which direction the price will go. But we have key levels and zones, price behavior relative to them will tell us where the price will go.
So, let's get to the bottom of it!
Fundamentally , there is a small but important nuance: This week Trump said: “I am done with the war against cryptocurrencies”.
Followed by almost $ 1bn dollars flowing into binance. Is someone getting ready for something?)
1) Technically, we have a trigger for further growth: $99000 - $99300 zone. If the bulls hold the price above the previously broken descending line, the price will head to attack the trigger in the medium term. A breakdown and price consolidation above 99K could trigger a rally.
2) But, chances of reaching 90-91K before rising are still high. If the price continues to test 94.8 - 95K and gradually push through this zone, everything will become obvious. In this case we will wait for a retest of 90K and further growth.
Resistance levels: 99200, 102700
Support levels: 94800, 91280, 90К
On the daily and weekly timeframe we can see that the price is forming a strong consolidation after a strong growth. Globally, this is a positive sign for a continuation of growth, but locally, inside the range, set-ups can be both short and long.
Regards R. Linda!

FARTCOIN: Breakout Alert! 200-300% Move Incoming?🚀 Hey Traders! Ready to Catch the FARTCOIN Explosion? 👋💨
If you’re pumped for this setup, smash that 👍 and hit Follow for elite trade ideas that actually deliver! 💹🔥
💎 FARTCOIN is breaking out! It's blasting out of a falling wedge pattern on the 4H time frame, signaling a potential 200-300% surge! Now’s the time to grab some and ride the wave! 📈
📌 Entry Range: CMP – Add more up to $0.36
🎯 Target: 200-300% upside!
🛑 Stop Loss: $0.324
⚡ Leverage: Spot or low leverage (Max 5x)
💬 What’s Your Take?
Are you bullish on FARTCOIN’s breakout potential? Drop your analysis, predictions, or strategies in the comments! Let’s secure those gains together! 💰🔥

50% DISCOUNT BUY?As illustrated, Im trying to visualize a falling wedge pattern into the 50% retracement of Monday's impulsive push, for what could be a potential buy point to continue the uptrend.
Nothing to get fancy about. This is just a chart analysis based on a potential corrective pattern that could take place within the next 24 hours and into tomorrow's NY session.
It could be NY to make the strong bounce tomorrow THU with the unemployment news as catalyst.
Remember; news don't mean anything. They are just gas / power for the market to distribute and manipulate (find liquidity) ...
..
GOOD LUCK

$TSLA poised for an EASY rise to $400 and beyond.BUY NASDAQ:TSLA NOW
A falling wedge is a chart pattern suggesting a probable rise in a stock's price. This bullish pattern emerges during a downtrend, as the price range tightens and the trend lines converge.
RSI: 35.02 as of 02/10/2025
NASDAQ:TSLA 's price began 2025 at $403.84. As of today, it stands at $350.73, reflecting a -13% decrease since the start of the year. By the end of 2025, it's projected to reach $692 , a year-to-year increase of +71%. This marks a +97% rise from today’s price. Mid-2025 predictions place Tesla at $477 . In the first half of 2026, the price is expected to climb to $805, and by year-end, add another $163 to close at $968, which is +176% from the current price.
-Month Low $350.51
Low $350.51
Pivot Point 1st Support Point $346.59
Pivot Point 2nd Support Point $342.46
Price 1 Standard Deviation Support $334.84
Pivot Point 3rd Support Point $334.40
Thank you

BITCOIN → Consolidation. Shake-out before growth to 110KBINANCE:BTCUSD is consolidating both locally and globally. The market lacks drivers, but at the same time, big players continue to keep the coin from falling further
Bitcoin is in consolidation or in a localized correction due to Trump putting cryptocurrencies on the back burner. No supportive executive orders have been issued, except that there is a little noise around the federal reserve, but only from the states and that is in question what assets will fill this fund, confiscated or still politicians will start buying BTC. As for the global economy regarding bitcoin, a lull has been forming lately. Except for SOL and DOGE, for which the SEC has already started accepting applications to launch ETFs.
Technically, I'm keeping an eye on local consolidation: 94800 - 98400. A breakout of resistance could give hope to the market and in that case bitcoin could strengthen to 102 - 107K
Resistance levels: 98.4, 100.2, 102.7
Support levels: 94.8, 91.3
But, based on the general technical situation, there is a huge pool of liquidity in the 91-90K zone and before further growth the price may test this zone and form a false breakdown before the market returns to active buying.
Regards R. Linda!

Bitcoin’s Falling Wedge Pattern Breakout—Next Stop: $100K?Bitcoin ( BINANCE:BTCUSDT ) started to fall after US indices(Core CPI m/m_CPI m/m_CPI y/y) were announced but rose again. One of the reasons for the rise of Bitcoin in the previous minutes was Trump's speech , which talked about negotiations with Russia ." Trump: Putin and I agreed to have respective teams start negotiations immediately ."= The possibility of the end of wars , in general, can increase investment security.
After several attempts to break the Support zone($96,520-$95,720) , Bitcoin failed to break this zone and created a Fake Break .
Bitcoin is above the Support zone($96,150-$94,760) and near the upper lines of the Falling Wedge Pattern .
Regarding Elliott wave theory , Bitcoin seems to be completing the Double Three Correction(WXY) as the main wave X was completed minutes ago .
I expect Bitcoin to break the upper lines of the Falling Wedge Pattern soon and rise to the Targets I specified on the chart.
Note: If Bitcoin goes below $93,800, we have to wait for an attack on the Heavy Support zone($93,300-$90,500), and there is a possibility of a heavy fall in this situation.
Do you think the Falling Wedge Pattern will eventually increase Bitcoin?
Please respect each other's ideas and express them politely if you agree or disagree.
Bitcoin Analyze (BTCUSDT), 1-hour time frame.
Be sure to follow the updated ideas.
Do not forget to put Stop loss for your positions (For every position you want to open).
Please follow your strategy and updates; this is just my Idea, and I will gladly see your ideas in this post.
Please do not forget the ✅' like '✅ button 🙏😊 & Share it with your friends; thanks, and Trade safe.
