ENAUSDT → Attempting a trend change. Focus on 0.700BINANCE:ENAUSDT is forming an attempt to change the trend. The price breaks the descending resistance and forms a new trading range. The focus on the 0.7 support and the bulls' reaction...
Bitcoin looks quite positive after breaking the downside resistance, but there is a strong 112K zone ahead and news on Thursday / Friday. If the general backdrop maintains its bullishness, BTC's rise will support strong altcoins and the market could turn green, including the coin discussed in this publication...
ENAUSDT breaks through the downtrend resistance. Price is consolidating above the boundary and forming a trading range. The focus is on the 0.7 - 0.683 area. If the bulls keep the price above this area, it will confirm the fact of trend change, which could trigger a rally to 0.7745 - 0.853
Support levels: 0.7, 0.683, 0.668
Resistance levels: 0.736, 0.7745
Technically, there is a possible struggle between market participants for the area 0.7 - 0.668. In this case, I will not consider the return to the channel as a false breakout of the trend, as a strong upward impulse was formed earlier, which generally broke the local market structure. However, based on the technical situation, I will consider entering the position after clear signs of price holding above the key support zone.
Regards R. Linda!
Falling Wedge

BITCOIN → Sale on positive news? What to expect? 100K or 130K?BINANCE:BTCUSDT.P unsuccessfully ended another attempt to break through the 112K-113K zone. The positive background (NFP) did not affect the price, and a bearish setup formed on D1...
D1 is forming a pin-bar relative to the strong resistance zone of 112K - 113K, positive news is quickly sold off, and the price, rebounding from the resistance of the trading range, closes near the bearish trigger of 110500. Bitcoin looks quite uncertain as it faces selling pressure in the 112K-113K zone. The price cannot consolidate above this area despite the previously broken correction resistance. There is logic in this maneuver... The market is betting on a more than 90% chance of interest rate cuts, and by that point, the price of Bitcoin may fall to the maximum permissible limits before further growth. Areas of interest may be 107K - 105K - 100K
Resistance levels: 111.9K, 113.3K, 117K
Support levels: 110.5K, 107.4K, 105.0K
A breakdown of the 110.5K support could trigger further sell-offs towards the support of the key trading range. Within the current downward cycle, the price may well test 105,000, which is a fairly strong liquidity zone. The fundamental background is positive, and the current sell-off may be manipulative movement before the emergence of a bullish driver...
Best regards, R. Linda!

DOGE analysis.Give me some energy !!!So if you pay attention to the DOGE chart you can see that the price has formed a Ascending wedge or flag which means it is expected to price move as equal as the measured price movement.( AB=CD )
NOTE: wait for break of the WEDGE .
Best regards CobraVanguard

GBPNZD → Retest 2.276 before resuming the bullish trend FX:GBPNZD is testing a key support level as part of a correction after breaking through consolidation resistance. The trend is bullish, and liquidity capture could resume the upward movement.
GBPNZD is testing a strong support level within the uptrend during the correction phase. Against the backdrop of the long-term decline of the NZD, the currency pair has every chance of continuing to grow.
On the daily timeframe, we have a fairly strong upward structure, with the previously broken consolidation resistance and the 0.5f area playing a key role. This tandem hides a liquidity area that could become a driver for the market. A false breakdown of 2.276 could trigger a resumption of growth.
Support levels: 2.276, 2.2682
Resistance levels: 2.2983, 2.3215
The bullish trend may support the main trend. The current correction is a healthy movement within an uptrend that may continue after a pullback and consolidation.
Best regards, R. Linda!

SpotCrude Short Setup - 4h💎MJTrading
📸 Viewing Tip:
🛠️ Some layout elements may shift depending on your screen size.
🔗 View the fixed high-resolution chart here:
🛢️ PEPPERSTONE:SPOTCRUDE Short Setup – Third Tap of Falling Wedge Resistance
Pattern: Falling wedge
Context: Price is testing wedge resistance for the third time, with rejection signs
Bias: Bearish
🟢 Entry Point: 64.5
This aligns with upper boundary of the Falling Wedge (After Rejection).
❌ Stop Loss (SL): 65.5
🎯 Take Profit (TP) Levels
✅ TP1 (RR1) → 63.5
📈 TP2 → 62.5
💰 TP3 → 61.5
🧠 Trade Logic
Price is testing wedge resistance for the third time, with rejection signs
⚠️ Risk Management
Risk:Reward ratio ranges from 1:1 to 1:3, depending on TP level.
Psychology Always Matters:

Update & Technical Analysis — PEAQ🔄 Update: In the previous setup, price made a dead cat bounce with a fake breakout, and continued its downside move.
Now, the chart has formed a falling wedge, which is considered a strong bullish pattern.
A breakout above the wedge’s resistance could be a solid trigger.
✅ Confirmation of trend reversal will be at 0.0875 in MWC (Medium Wave Cycle) and at 0.1880 in HWC (High Wave Cycle).
⚠️ Please remember: using this analysis requires strict risk management and capital management.
What’s your view on $PEAQ? 👇

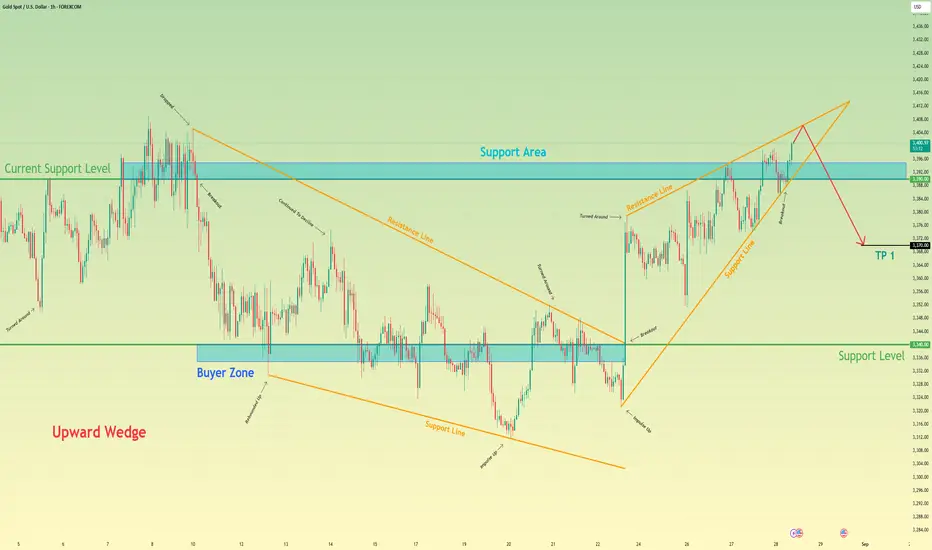
Gold will start to decline and then exit from wedgeHello traders, I want share with you my opinion about Gold. The market dynamic for XAUUSD has seen a significant evolution, transitioning from a corrective falling wedge into a new bullish phase after a powerful breakout from the lows. This upward trend has since matured and taken the shape of a large upward wedge, a pattern that has been guiding the price higher through a series of rebounds and corrections. This formation, while bullish in the short term, often signals potential trend exhaustion as it approaches its apex. Currently, the price action for XAU is at a critical juncture, pushing up against the upper resistance line of this wedge. The primary working hypothesis is a short scenario, which is predicated on the common bearish resolution of a rising wedge pattern. It is anticipated that the asset will be rejected from this resistance line, signalling that buying momentum is waning. A confirmed failure at this peak would likely trigger a sharp reversal, with enough selling pressure to cause a breakdown below the wedge's ascending support line and the current support level of 3390. This structural failure would validate the bearish thesis and initiate a new downward leg. Therefore, the TP is logically set at 3370 points, representing a prudent first objective for the price to achieve following the anticipated breakdown of the wedge structure. Please share this idea with your friends and click Boost 🚀
BITCOIN → Breakthrough of the downward trend resistance... 120K?BINANCE:BTCUSDT.P formed a false breakdown of key support at 110,000 - 112,000 and returned to the whales' zone of interest. The chart shows the prerequisites for a possible end to the countertrend correction...
A false breakdown of the daily support of 110K - 112K provokes a local bearish rally, within which the price breaks through the downward resistance of the correction and tests 113.300. The growth was supported by positive signals from institutional investors, technical stability and a decrease in selling pressure.
The fundamental background is positive, the market is trending. The chart shows prerequisites for the end of the correction. However, the further outlook depends on the 112.0 - 112.5K area. if the bulls hold the price above this zone, the flagship may return to the upward movement and head towards 117K - 120K.
Support levels: 112.5, 112.0, 110.9
Resistance levels: 113.6, 114.6, 117.0
After breaking through the resistance of the descending channel, the impulse stops and most likely a fight for the 112K zone may form. If the price returns to the channel and consolidates below 112K, then Bitcoin may return to the downward movement, however, while the price is trading above this line, the bulls have a chance...
Best regards, R. Linda!

NZDJPY → A false breakout of resistance will trigger a declineFX:NZDJPY entered a correction phase after a sharp decline. The main trend is downward, with a countertrend movement aimed at consolidating potential before further decline.
A countertrend correction is forming against the backdrop of the main downward trend. The current movement may be aimed at hunting for liquidity before continuing its movement. Focus on the resistance zone at 86.67
The currency pair is trading below key resistance within the global downtrend. As part of the correction, the price may test 86.67 - 87.10 before continuing the main trend.
Resistance levels: 86.67, 86.97, 97.11
Support levels: 85.97, 85.6
If a false breakout of the key zone of interest forms during the correction without the possibility of continuing growth, we will receive confirmation that the market is ready to move down. Consolidation below the level may trigger a downward impulse.
Best regards, R. Linda!

GBPAUD → The correction is nearing completion...FX:GBPAUD is set to end the correction formed within the global bullish trend. A false breakdown of the liquidity zone is forming...
GBPAUD on D1 is testing a strong support zone, which gives traders hope for a possible recovery. Locally, the chart shows signs of the correction ending...
After correcting to 1/2 of the range, GBPAUD is forming a false breakdown of the order block and breaking the bearish structure, confirming the end of the correction. Consolidation above 2.076 could trigger a recovery within the bullish trend.
Resistance levels: 2.086, 2.0978
Support levels: 2.076, 2.0715
Despite breaking through the resistance of the local correction, the market must confirm the bullish sentiment. Consolidation of the price above 2.076 will confirm this nuance, and consolidation above the key support may influence further growth.
Best regards, R. Linda!

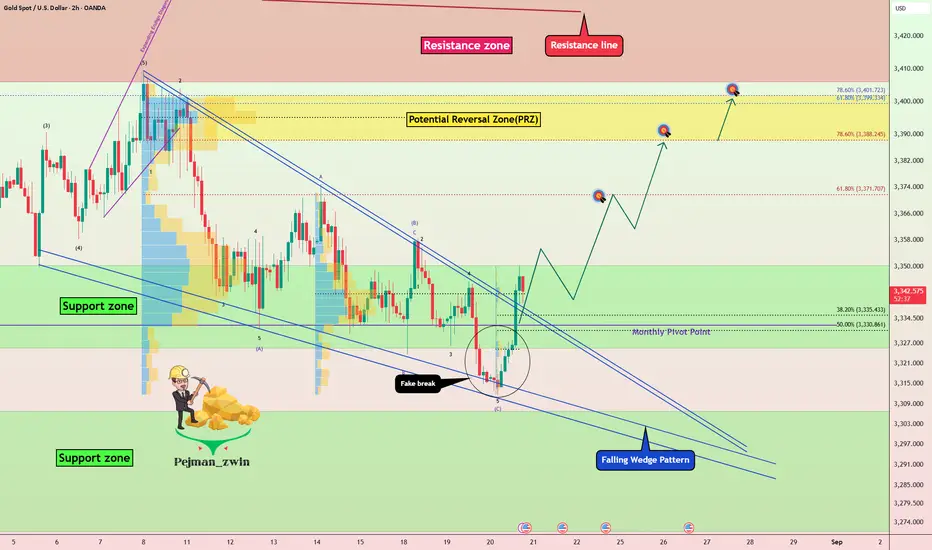
Gold Breaking Out of Falling Wedge Pattern – Rally Ahead?After creating a fake break below the Support zone($3,350-$3,326) , Gold ( OANDA:XAUUSD ) rose again above this zone and the Monthly Pivot Point .
If we look at the Gold chart on the 2-hour time frame from a Classic Technical Analysis perspective, we can see a falling reversal pattern , with Gold currently breaking the upper line of this pattern .
In terms of Elliott Wave theory, it seems that Gold is completing a corrective wave , and we should wait for the next impulse wave .
I expect Gold to start rising from the Support zone($3,350-$3,326) and rise to at least $3,369.
Second Target: Potential Reversal Zone(PRZ) = $3,402-$3,388
Note: Stop Loss (SL) = $3,320
Note: From today until Friday, important indexes will be released from the US, which can create excitement in financial markets, especially Gold, and even change the market trend when released.
FOMC Meeting Minutes = Today
Unemployment Claims = Tomorrow
Flash Manufacturing /Services PMI = Tomorrow
Fed Chair Powell Speaks = Friday
Gold Analyze (XAUUSD), 2-hour time frame.
Be sure to follow the updated ideas.
Do not forget to put a Stop loss for your positions (For every position you want to open).
Please follow your strategy; this is just my idea, and I will gladly see your ideas in this post.
Please do not forget the ✅ ' like ' ✅ button 🙏😊 & Share it with your friends; thanks, and Trade safe.
BITCOIN → Market potential change. Chance for growth to 125K...BINANCE:BTCUSDT , after a false breakdown of support, which we had been preparing for in my last idea, with the support of dovish hints from Powell, soared from 112K to 117K. What's next???
After Powell's speech and the shift in the fundamental background to positive, BTC broke the local bearish structure, forming a rally to 117K. The market exhausted its potential and, against the backdrop of the approaching weekend and a decline in liquidity, entered a correction phase. However, the relatively positive fundamental background should be taken into account when making further decisions. Lower interest rates could support the market...
Technically, after retesting the 112K zone and forming a false breakdown, Bitcoin changed market sentiment. The capture of liquidity and the breakdown of the local downward structure changes the technical situation in favor of buyers. Potential areas of interest could be 117.8, 120.27, and 125K
Resistance levels: 117K, 117.86K, 120.27K
Support levels: 114.6K, 111.9K
If, during the correction, the bulls manage to keep the price above the upper limit of the local trading range, i.e. above the downward channel and above the 114.600 zone, then interest in buying may increase. The market has the potential to test the resistance of the global trading range...
Best regards, R. Linda!

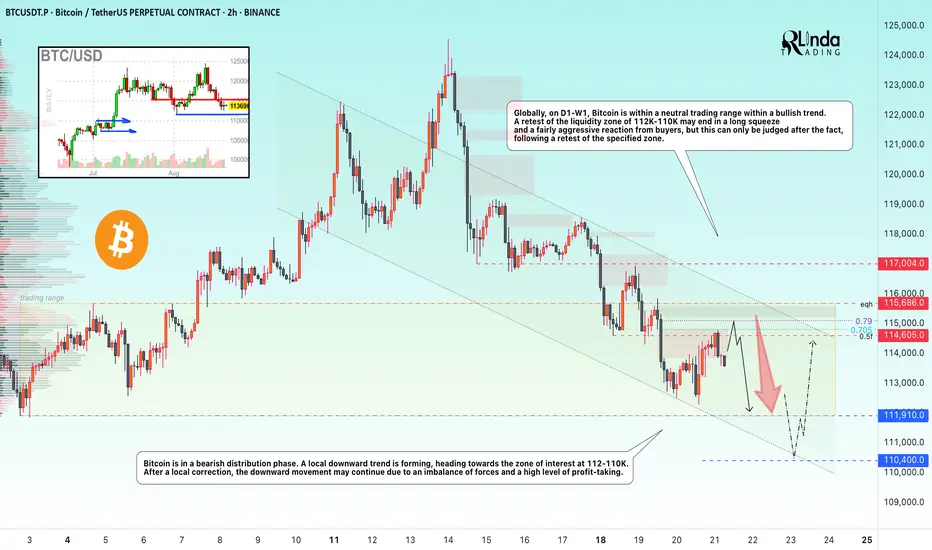
BITCOIN → Retest 112K - 110K before growthBINANCE:BTCUSDT.P is stuck within the trading range of 112K - 123K. The false breakout of the ATH ended with a reversal of the local trend and a bearish distribution phase, which may target the liquidity zone at 112 - 110K.
The market remains bullish, with no fundamental changes for the cryptocurrency market and the situation remaining positive. Technically, we are seeing a countertrend correction within the bullish trend. Bitcoin is in a distribution phase. A local downward trend is forming, directed towards the zone of interest 112 - 110K. After a local upward correction, the downward movement may continue due to an imbalance of forces and a high level of profit-taking.
Globally, on D1-W1, Bitcoin is within a neutral trading range within a bullish trend. A retest of the liquidity zone of 112K-110K may end with a long squeeze and a fairly aggressive reaction from buyers, but this can only be judged after the fact, following a retest of the specified zone.
Resistance levels: 114.600, 115680, 117000
Support levels: 111910, 110400
The downward movement is purposefully heading towards the zone of interest. Earlier, in early August, the market tested the specified level (previous ATH), but technically did not reach the liquidity zones. There is a fairly high chance of a retest of 112 - 110K before the market attempts to grow.
Best regards, R. Linda!
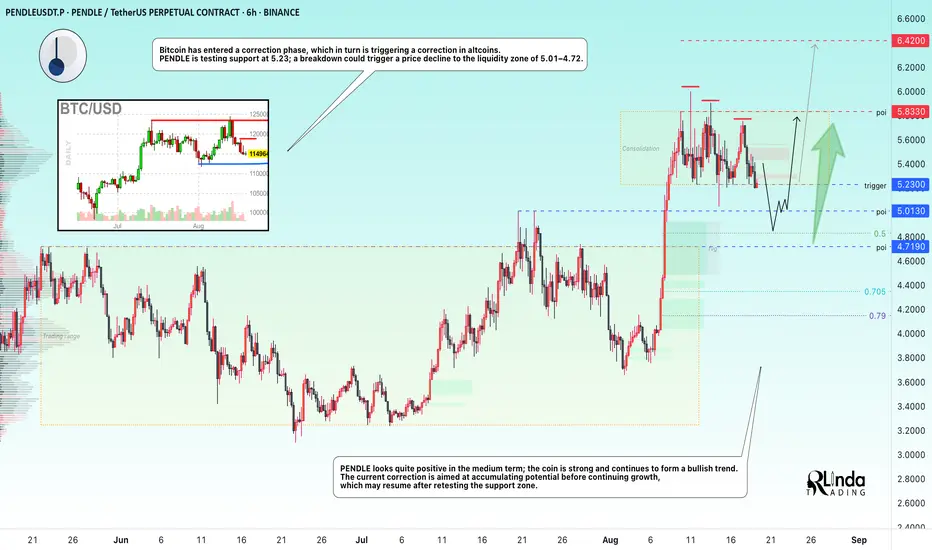
PENDLEUSDT → Retest of the 5.0 liquidity zone before rising to 7BINANCE:PENDLEUSDT is still consolidating, but is preparing to enter a correction phase, which could be triggered by a breakdown the 5.23 support level. Correction is a vital stage for further growth.
Bitcoin has entered a correction phase, which in turn is triggering a correction in altcoins. PENDLE is testing support at 5.23, and a break of this support level, which is already being tested for the sixth time, could trigger a price decline to the liquidity zone of 5.01 - 4.72
PENDLE looks quite positive in the medium term, the coin is strong and continues to form a bullish trend. The current correction is aimed at accumulating potential before continuing growth, which may resume after retesting the support zone.
Resistance levels: 5.833, 6.42
Support levels: 5.23, 5.013, 4.719
On the weekly chart, PENDLE is consolidating above the strong support level of 5.013. As part of the correction, the market may confirm this support and continue its growth towards the ATH from the mirror level.
Best regards, R. Linda!
GOLD - false breakdown of support before bullish runGold on the chart is forming a bullish pattern: consolidation in the form of a bearish wedge forming on an uptrend. There is a high probability of a breakout from the support level of 3320-3310. The market has a lot of upside potential, as the price has been consolidating for a long time.
Below is a fairly strong support zone that is capable of holding the price.
However, there is one caveat: in a few hours, Powell's speech and unpredictable data could destroy the structure, in which case gold could fall to 3300-3328.

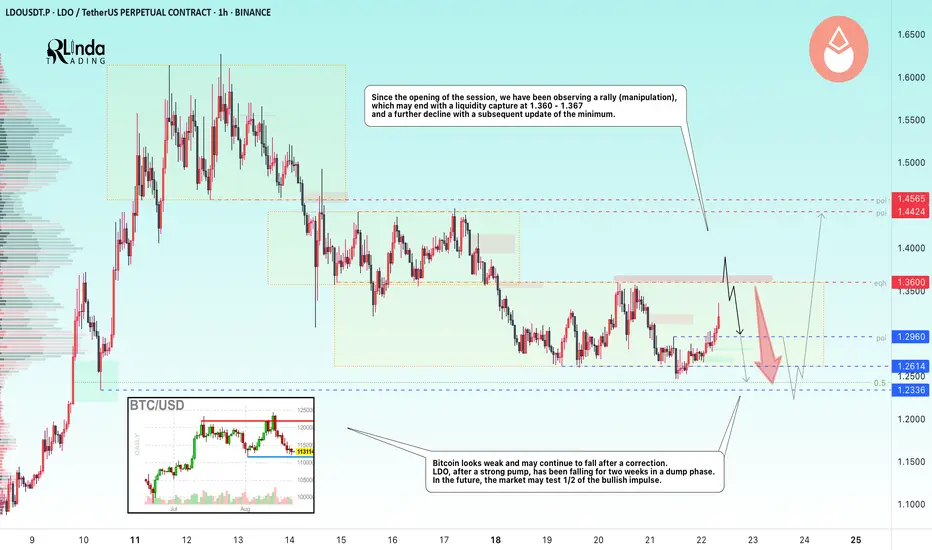
LDOUSDT → Hunting for liquidity ahead of a declineBINANCE:LDOUSDT.P , having failed to reach the zone of interest 1.250 - 1.233, has entered a phase of local rally or manipulation before a possible decline aimed at consolidating potential before long-term growth.
Bitcoin looks weak and, after a correction, may continue to fall to the coveted target of 112 - 110K. After a strong pump, LDO has been falling for two weeks in a dump phase. In the long term, the market may test 1/2 of the bullish momentum and the strong support level of 1.179 before resuming the pump to 1.62 - 1.97.
Since the opening of the session, we have been observing manipulation, the goal of which is most likely the liquidity zone of 1.36 - 1.36. The situation may end with a liquidity grab, a false breakout, and a further decline with a subsequent update of the low.
Resistance levels: 1.36, 1.37, 1.44
Support levels: 1.296, 1.2614, 1.2336
Technically, the price is still consolidating and intrarange trading is likely to continue. A false breakout of resistance could trigger a decline, in which case 1.26 - 1.23 could be considered a target, while a false break of 1.17 - 1.23 could trigger a global rise.
Best regards, R. Linda!
GOLD → Breakthrough of downward resistance, news ahead...FX:XAUUSD is recovering after a fairly prolonged decline, and there are signs of bullish sentiment on the chart, but caution is advised as important news is ahead...
Gold is in a holding pattern. Its short-term fate depends on today's US economic data and, to a greater extent, on tomorrow's speech by Powell, which will set the tone for the future. The price is recovering slightly after a recent decline, but is trading cautiously.
The market is awaiting the release of S&P Global's business activity indices (PMI), which will assess the strength of the US economy and influence Fed rate forecasts. Another key event of the week is the Fed chair's speech in Jackson Hole on Friday. His comments on future interest rates will determine the further movement of gold and the dollar.
Technically, we are seeing a rebound from the support of a global symmetrical triangle, with bulls still in the market but waiting for further signals. Locally, we are seeing positive dynamics — a breakout of downward resistance and consolidation in the buying zone...
Resistance levels: 3350, 3370
Support levels: 3331, 3315
The conditions for further growth should be a positive fundamental background and the bulls holding the price above key support. A retest of the trading range boundary (0.5f) is possible before growth.
Best regards, R. Linda!

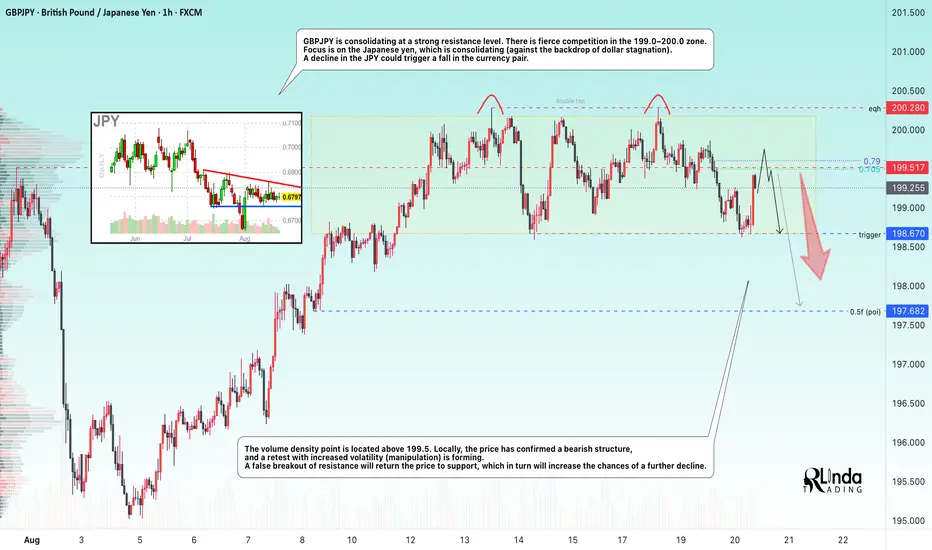
GBPJPY → False breakout and reversal patternFX:GBPJPY is forming a false breakout of strong resistance from D1. A trading range (consolidation) is forming, and market participants are fighting for the 199.0 - 200.0 zone.
GBPJPY is consolidating at strong resistance. A fierce battle is underway for the 199.0-200.0 zone. Focus is on the Japanese yen, which is consolidating (against a backdrop of dollar stagnation). A decline in the JPY could trigger a fall in the currency pair.
The volume density point is located above 199.5. Locally, the price has confirmed a bearish structure, and a retest is forming on increased volatility (manipulation). A false breakout of resistance will return the price to support, which in turn will increase the chances of a further decline
Resistance levels: 199.5, 200.28
Support levels: 198.67, 197.68
A double top reversal pattern is forming on the chart, indicating the presence of strong limit resistance, but the pattern has not yet been realized. The trigger is consolidation support. Locally, I expect a decline from 199.5 to retest the trigger, the breakout of which could trigger the reversal pattern.
Best regards, R. Linda!
Bitcoin dominance forming a falling wedgeIf we look closely at Bitcoin dominance, it has been sliding from 66% to around 59%, forming a textbook falling wedge. Normally, this is a bullish reversal pattern—and when it plays out, history shows it hurts altcoins the most.
Right now, there’s also a clear bullish divergence on RSI: while the dominance has been falling, momentum is actually climbing. This divergence often signals that a reversal is coming, and when Bitcoin dominance rises, it doesn’t hurt BTC much, but it usually triggers heavy selling pressure in altcoins.
At the same time, USDT dominance is showing signs of heading higher. When these two align—Bitcoin dominance moving up and USDT dominance ticking higher—it sets up a tough environment for alts. Money rotates into Bitcoin, stability is prioritized, and altcoins become the exit liquidity.
In short, the setup is hinting that Bitcoin dominance is preparing to move higher, which could trigger a rotation out of altcoins and potentially cause a sharp correction in the altcoin market. Traders should be cautious—what looks calm in the charts today may flip quickly once dominance breaks out of this structure.

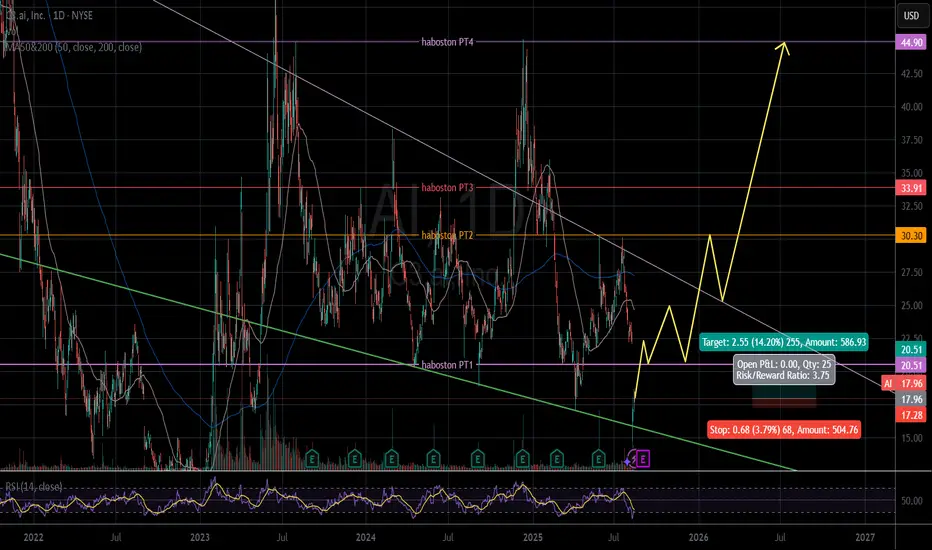
Ai - Falling wedgeThe chart pattern look likes Falling wedge.
After oversold, Ai starts rebounding with multiple targets until 06.2026 in 18 month cycle.
The price closed on Thursday is $17.96 (08.14.2025).
Entry $17.96.
PT1 is $20.51 (14.20%).
Stop loss $17.28 (-3.79%).
R/R: 3.75.
Other target $30.30/ $33.91/ $44.90.
IMO.
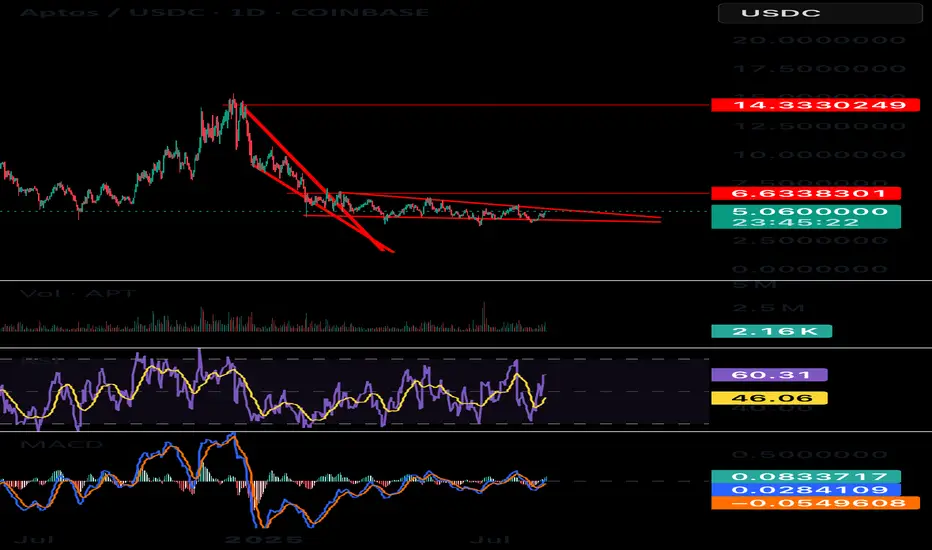
2 falling wedges on aptos Both wedges still valid gives you 2 targets, this is not short term this is long term! Bullish lets go!
Bullish Energy in Natural Gas: -DMI Extreme + Wedge BreakoutThe Spark in the Gas Market
Natural gas has been quietly simmering in recent weeks, building pressure beneath a surface of consolidation. Traders watching closely will have noticed a rare alignment — one that history shows can potentially precede outsized moves. We’re talking about the convergence of two powerful signals: a -DMI yearly extreme and a falling wedge breakout.
In the past, this combination has marked moments when bearish momentum had run its course, giving way to swift and decisive bullish reversals. Now, that same alignment is flashing again, inviting a closer look at the technical landscape and the potential opportunities it presents.
Why This Setup Matters
The -DMI (Directional Movement Index) measures the strength of downward price moves. When it pushes beyond two standard deviations above its yearly linear regression channel, it signals an overextended bearish phase. Historically, these extremes have often coincided with market bottoms in Natural Gas Futures.
Layer on top a falling wedge — a bullish reversal chart pattern — and the probability of an upside move gains weight. The wedge compresses price action into a narrowing range, reflecting reduced volatility and setting the stage for a potential explosive breakout once resistance gives way. The current breakout level sits near 3.18, with technical projections aligning closely to a well-defined UFO resistance (UnFilled Orders) zone around 3.90.
The Technical Story Unfolds
Looking at the daily chart in the present, the -DMI has recently breached the +2 standard deviation boundary of its 252-period regression channel — a rare occurrence that, as said, has preceded multiple major bullish reversals in the past year. When this condition appeared, downside momentum often faded, making room for buyers to take control.
This time, the current signal aligns with a falling wedge that has been developing for weeks. Price is about to break above the wedge’s upper boundary at approximately 3.18, suggesting a potential trend reversal.
The Trade Blueprint
Direction: Long
Entry: 3.18 (confirmed breakout above wedge resistance)
Target: 3.90 (wedge projection + UFO resistance)
Stop Loss: 2.858 (below wedge and technical support floor)
Reward-to-Risk Ratio: ~2+ to 1
This structure allows traders to define risk tightly while targeting a meaningful upside move. The setup applies equally to both Natural Gas Futures (NG) and Micro Natural Gas Futures (MNG), offering flexibility in capital allocation. For smaller accounts or those wanting to reduce margin exposure, the MNG contract delivers the same tick size precision with only one-quarter of the notional value.
The Contract Advantage
Natural Gas Futures (NG) represent 10,000 MMBtu per contract, with a minimum tick size of 0.00025 — equivalent to $2.50 per tick.
Micro Natural Gas Futures (MNG) are one-tenth the size at 1,000 MMBtu per contract, with the same 0.00025 tick size equaling $0.25 per tick.
Margin requirements vary with volatility and exchange adjustments, but at the time of writing, the CME lists initial margin for NG in the range of $3,500 per contract, while MNG margins are proportionally lower at $350 per contract. This creates flexibility for traders to scale positions or manage risk without altering the technical logic of the trade. Both contracts trade nearly 24 hours per day, Sunday through Friday, offering the ability to react to global energy market shifts in real time.
Risk Management as the Safety Valve
Defining risk is the cornerstone of any trade plan. The stop loss at 2.858 is not arbitrary — it sits below both the wedge’s lower boundary and a nearby technical support level. If price were to close below this level, it would undermine the bullish thesis and call for an exit.
Using smaller MNG contracts can help align risk with account size, allowing for partial position scaling and better drawdown control. Equally important is avoiding undefined risk scenarios, particularly in a commodity as volatile as natural gas. Precision in both entries and exits reduces exposure to intraday whipsaws while maintaining the trade’s structural integrity.
Closing the Loop
The natural gas market has aligned a rare set of conditions — a -DMI yearly extreme and a falling wedge breakout — each of which has historically preceded significant upside moves on their own. Together, they offer a compelling technical case for a defined, risk-managed long position targeting the 3.90 zone.
While no setup guarantees success, this one seems to offer clarity: a well-defined entry, stop, and target, supported by historical probability and pattern structure. In volatile markets, those moments of clarity are worth paying attention to — and acting on with discipline, and always depending on the trader’s trading plan.
When charting futures, the data provided could be delayed. Traders working with the ticker symbols discussed in this idea may prefer to use CME Group real-time data plan on TradingView: www.tradingview.com - This consideration is particularly important for shorter-term traders, whereas it may be less critical for those focused on longer-term trading strategies.
General Disclaimer:
The trade ideas presented herein are solely for illustrative purposes forming a part of a case study intended to demonstrate key principles in risk management within the context of the specific market scenarios discussed. These ideas are not to be interpreted as investment recommendations or financial advice. They do not endorse or promote any specific trading strategies, financial products, or services. The information provided is based on data believed to be reliable; however, its accuracy or completeness cannot be guaranteed. Trading in financial markets involves risks, including the potential loss of principal. Each individual should conduct their own research and consult with professional financial advisors before making any investment decisions. The author or publisher of this content bears no responsibility for any actions taken based on the information provided or for any resultant financial or other losses.

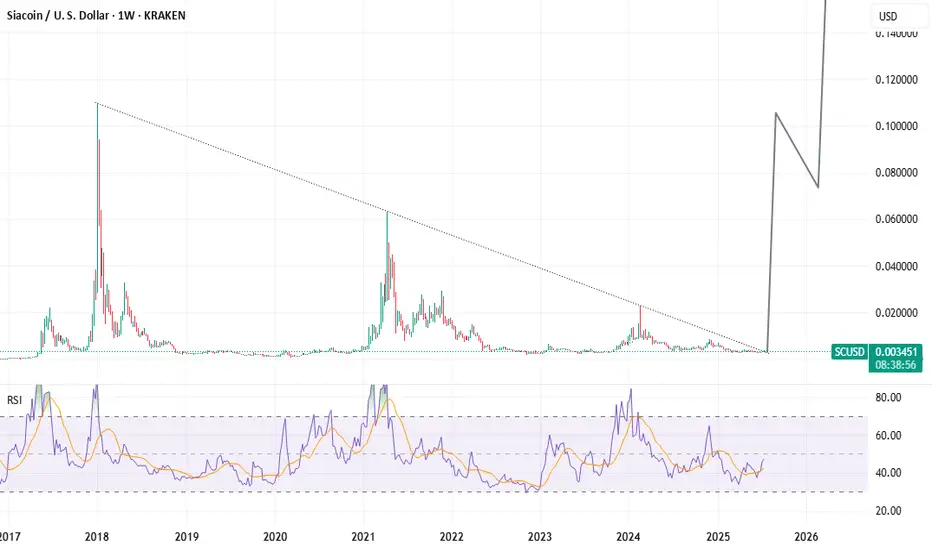
8-Year Breakout Confirmed! SIACOIN Hardfork Activated!Breaking out from a near-identical structure to XRP’s Q3 2024 move, Siacoin (SC) is poised to moon.
Once a top 20 crypto, SC has just closed outside an 8-year falling wedge on the weekly—marking the end of nearly a decade of compression.
But this isn’t just a pattern breakout—it coincides with the biggest technical overhaul in Sia’s history, rolled out on the 10-year anniversary of the token’s launch. Some of the new features:
- Full protocol overhaul — complete rewrite in Go (from siad to hostd/renterd)
- Faster performance — significantly improved upload/download speeds
- Modular architecture — easier dev integration, plug-and-play infrastructure
- Efficient storage contracts — new ephemeral account system for faster payments
- Lower gas costs — more cost-effective microtransactions for storage users
- Better redundancy & reliability — improved renter-host coordination
- Stronger developer tools — RESTful APIs + CLI tools for building on Sia
V2 basically turned Sia from a clunky decentralized Dropbox into a scalable, developer-friendly Web3 storage protocol, just in time for the AI + data sovereignty wave.
Still buried in market cap rankings, SC has the potential to quietly reclaim a top 30 spot as the world rediscovers decentralized storage. This isn’t a meme coin—it’s a battle-tested, utility-rich project with real infrastructure, real adoption potential, and serious upside.
#Siacoin #SC #Sia