Potential Short Setting Up on the 15 minute timeframeAs price makes new highs on the 15 minute time frame, I think there are potential shorting opportunities.
Fibonacci
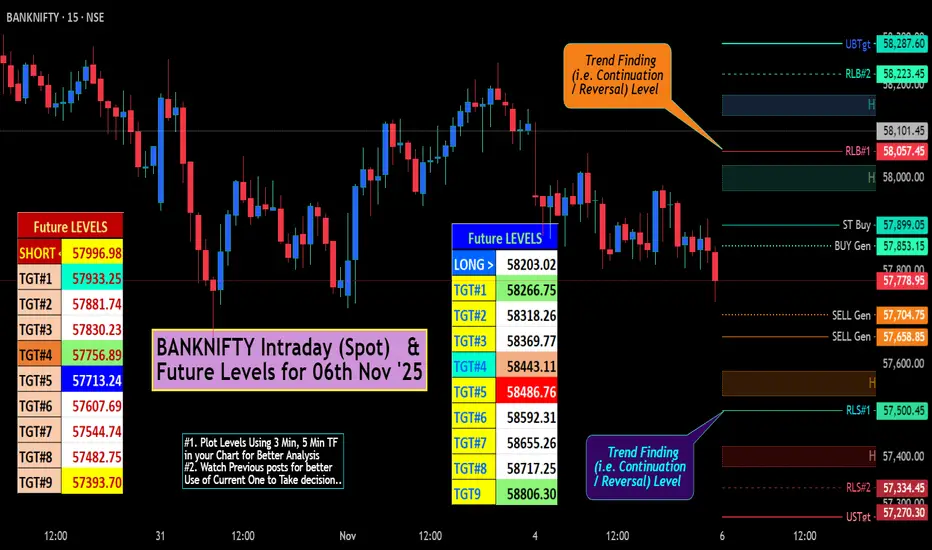
BANKNIFTY (Spot) & Future IntraSwing Levels for 06th Nov '25✍🏼️ "Future IntraSwing Levels" mentioned in BOX format.
✍🏼️ "WEEKLY Levels" follow Sunday / Saturday's Post.
L#1: If the candle crossed & stays above the “Buy Gen”, it is treated / considered as Bullish bias.
L#2: Possibility / Probability of REVERSAL near RLB#1 & UBTgt
L#3: If the candle stays above “Sell Gen” but below “Buy Gen”, it is treated / considered as Sidewise. Aggressive Traders can take Long position near “Sell Gen” either retesting or crossed from Below & vice-versa i.e. can take Short position near “Buy Gen” either retesting or crossed downward from Above.
L#4: If the candle crossed & stays below the “Sell Gen”, it is treated / considered a Bearish bias.
L#5: Possibility / Probability of REVERSAL near RLS#1 & USTgt
HZB (Buy side) & HZS (Sell side) => Hurdle Zone,
*** Specialty of “HZB#1, HZB#2 HZS#1 & HZS#2” is Sidewise (behaviour in Nature)
Rest Plotted and Mentioned on Chart
Color code Used:
Green =. Positive bias.
Red =. Negative bias.
RED in Between Green means Trend Finder / Momentum Change
/ CYCLE Change and Vice Versa.
Notice One thing: HOW LEVELS are Working.
Use any Momentum Indicator / Oscillator or as you "USED to" to Take entry.
⚠️ DISCLAIMER:
The information, views, and ideas shared here are purely for educational and informational purposes only. They are not intended as investment advice or a recommendation to buy, sell, or hold any financial instruments. I am not a SEBI-registered financial adviser.
Trading and investing in the stock market involves risk, and you should do your own research and analysis. You are solely responsible for any decisions made based on this research.
"As HARD EARNED MONEY IS YOUR's, So DECISION SHOULD HAVE TO BE YOUR's".
Do comment if Helpful .
In depth Analysis will be added later (If time Permits)
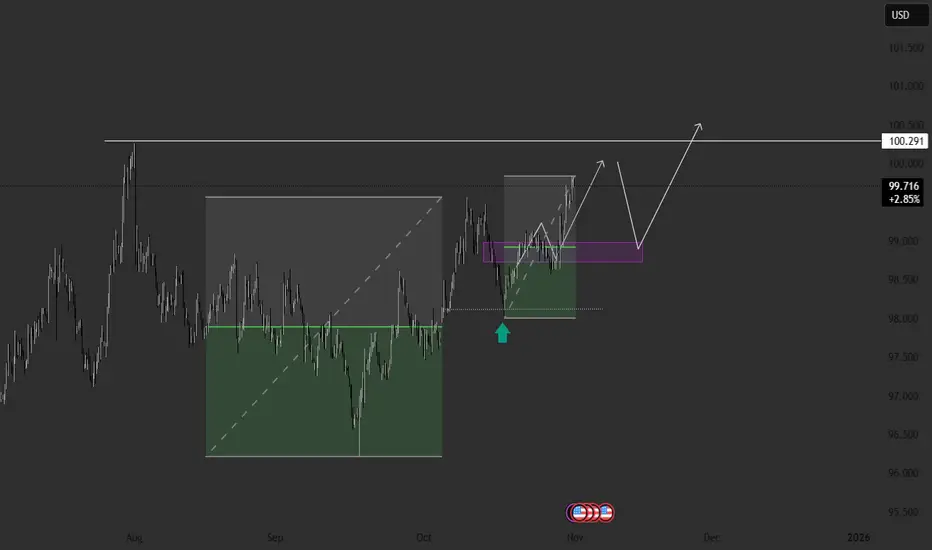
DXY Weekly Outlook – Two Key Scenarios AheadAs expected in the previous review, the price has reached the local point B.
Now the market stands at a crossroads, so let’s look at the possible scenarios for the upcoming week.
Plan A – Correction Within the Daily Order Flow
The first scenario suggests a slight correction.
The price may move into a small pullback within the daily order flow, find support there, and continue the movement toward point B.
As long as the market structure remains bullish, this scenario stays the main one.
Plan B – Possible Decline
However, we don’t cancel the bearish scenario.
Right now, the price is trading inside the weekly key level, and taking out the fractal high often acts as an indicator of a possible trend reversal.
That’s why, if the price breaks below the lower boundary of the daily order flow, I’ll start considering short setups.
Summary
Overall, the structure is still under pressure from major levels, and the coming week will show who takes control — buyers or sellers.
I’ll continue to monitor the reaction within the daily order flow zone and update the outlook in the next review.
CADJPY: Stalking a Pro-Trend Long from the Demand ZoneThe instrument is in an uptrend and is showing the beginning of a potential correction on the 4H structure. If the correction continues its downward movement, long positions can be considered from the DEMAND zone in conjunction with a reaction from one of the Fib levels.
The entry condition will be the price finding acceptance above the 50%, 61.8%, or 78.6% levels upon reaching them.
If a long setup forms, the target will be the high of January 6, 2025 .
The invalidation for the long scenarios in this trade idea will be a break of the 78.6% local level . In that case, the correction will transition to the higher structure, and long positions could then be considered from the daily Fib levels and the daily order block located below.
~~~~~~~~~~~~~~~~~~~~~~~~~~~~~~~~~~~~~~~~~~~~~~~~~~~~~~~~~~~~~~~~~
The principles and conditions for forming the manipulation zones I show in this trade idea are detailed in my educational publication, which was chosen by TradingView for the "Editor's Picks" category and received a huge amount of positive feedback from this insightful trading community. To better understand the logic I've used here and the general principles of price movement in most markets from the perspective of institutional capital, I highly recommend checking out this guide if you haven't already. 👇
P.S. This is not a prediction of the exact price direction. It is a description of high-probability setups that become valid only if specific conditions are met when the price reaches the marked POI. If the conditions are not met, the setups are invalid. No setup has a 100% success rate, so if you decide to use this trade idea, always apply a stop-loss and proper risk management. Trade smart.
~~~~~~~~~~~~~~~~~~~~~~~~~~~~~~~~~~~~~~~~~~~~~~~~~~~~~~~~~~~~~~~~~
If you found this analysis helpful, support it with a Boost! 🚀
Have a question or your own view on this idea? Share it in the comments. 💬
► Follow me on TradingView for timely updates on THIS idea (entry, targets & live trade management) and not to miss my next detailed breakdown.
~~~~~~~~~~~~~~~~~~~~~~~~~~~~~~~~~~~~~~~~~~~~~~~~~~~~~~~~~~~~~~~~~

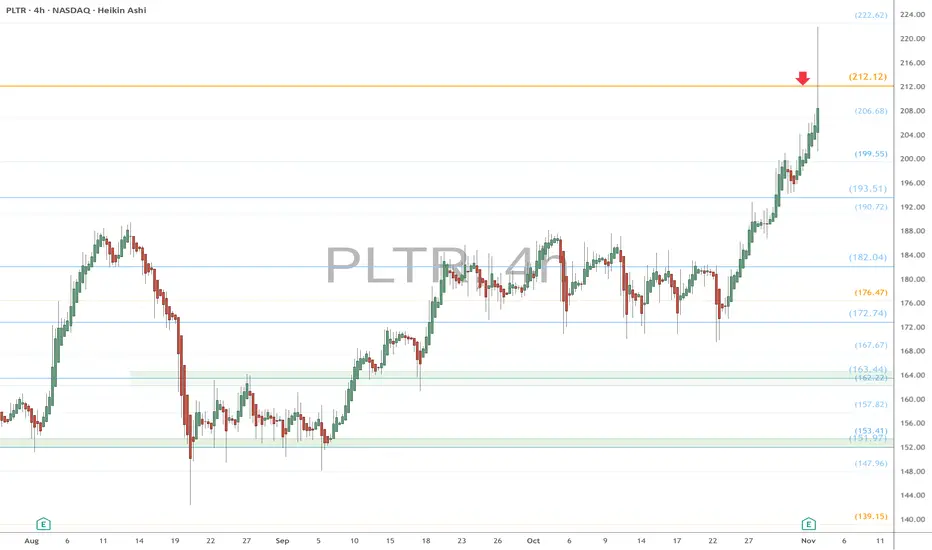
PLTR eyes on $212.12: Golden Genesis fib could mark a TOP PLTR has been slowing its ascent before earnings.
About to test a Golden Genesis fib at $212.12
Reaction here will give clues about its strength.
It is PROBABLE that we orbit this fib a few times.
It is POSSIBLE a Break-n-Retest continues uptrend.
It is PLAUSIBLE that we have topped for a while.
.
See "Related Publications" for previous plots such as this BOTTOM CALL:
Hit BOOST and FOLLOW for more such PRECISE and TIMELY charts.
========================================================
SWING IDEA - NEULAND LABNeuland Lab , a niche API manufacturer with strong export presence and leadership in complex molecules, is offering a technically strong swing trade opportunity from key support levels.
Reasons are listed below :
11,500 zone acting as a crucial support area
Formation of a hammer candle on the weekly timeframe, signaling potential reversal
Reversing from the 0.618 Fibonacci retracement zone – the golden pocket
Taking support at the 50-week EMA , holding long-term trend structure
Target - 14900 // 17600
Stoploss - weekly close below 10215
DISCLAIMER -
Decisions to buy, sell, hold or trade in securities, commodities and other investments involve risk and are best made based on the advice of qualified financial professionals. Any trading in securities or other investments involves a risk of substantial losses. The practice of "Day Trading" involves particularly high risks and can cause you to lose substantial sums of money. Before undertaking any trading program, you should consult a qualified financial professional. Please consider carefully whether such trading is suitable for you in light of your financial condition and ability to bear financial risks. Under no circumstances shall we be liable for any loss or damage you or anyone else incurs as a result of any trading or investment activity that you or anyone else engages in based on any information or material you receive through TradingView or our services.
@visionary.growth.insights

AUDJPY — 4H Retracement Zone Reaction & Continuation PlayAUDJPY is approaching a critical Fib retracement confluence around the 98.70–98.15 zone, aligned with the ascending trendline support. After a strong rejection from the 101.20 resistance, price is now pulling back toward this structure zone, where bullish momentum may re-emerge if buyers defend support.
Key Technical Structure:
Resistance: 101.20 (previous swing high)
Support: 98.70–98.15 (Fib 0.5–0.618 zone + structure confluence)
Trendline: Upholding the broader bullish structure from mid-October lows
Extension Target: 101.70 – 102.00 (bullish wave projection)
Trade Outlook:
I’m anticipating a potential retracement into the blue demand zone (98.70–98.15) for a bullish reaction. A rebound in this region could trigger a new impulse toward 100.70, followed by a retest of 101.20.
However, a break and close below 97.90 would invalidate the bullish continuation setup, signaling a shift in momentum.
Bias:
Bullish continuation favored while price remains above 98.10 — watching for confirmation from lower timeframes before re-entry.

DASH price analysis💥 Just eight years in a downtrend — that’s the story of #DASH 😅
Following CRYPTOCAP:ZEC , it looks like privacy coin fans are trying to “wake up” #DASHUSDT — and price action is finally showing signs of life 📈
📊 If buyers can hold above $90–100, it will signal a true breakout from the long-term trendline and a solid consolidation above it.
That could open the door for a careful long entry, especially since we still have room for around x5 upside to reach the 2021 highs 💪
🤔 Do you believe #DASH can reclaim its former glory,
or has its time already passed?
______________
◆ Follow us ❤️ for daily crypto insights & updates!
🚀 Don’t miss out on important market moves
🧠 DYOR | This is not financial advice, just thinking out loud

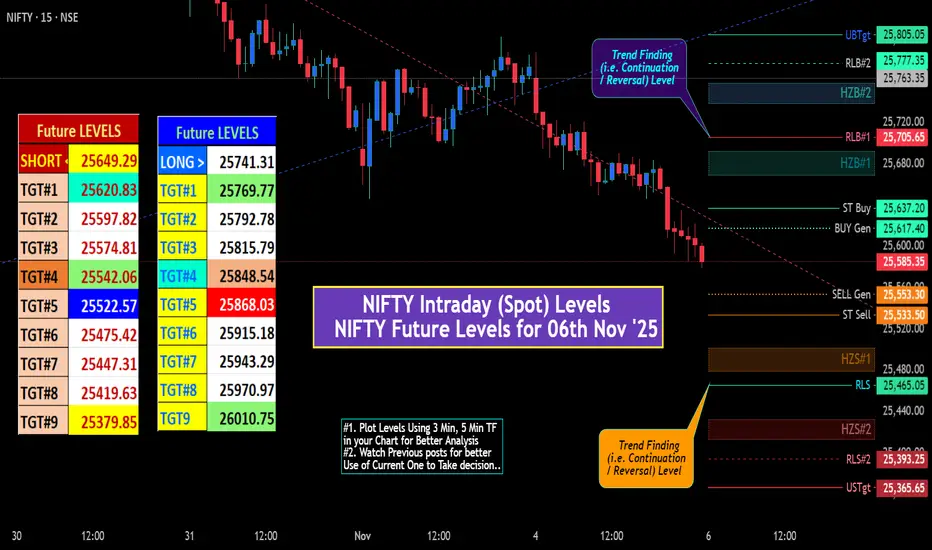
NIFTY IntraSwing (Spot) & Future Levels for 06th Nov 2025✍🏼️ "Future IntraSwing Levels" mentioned in BOX format.
✍🏼️ "WEEKLY Levels" follow Sunday / Saturday's Post.
L#1: If the candle crossed & stays above the “Buy Gen”, it is treated / considered as Bullish bias.
L#2: Possibility / Probability of REVERSAL near RLB#1 & UBTgt
L#3: If the candle stays above “Sell Gen” but below “Buy Gen”, it is treated / considered as Sidewise. Aggressive Traders can take Long position near “Sell Gen” either retesting or crossed from Below & vice-versa i.e. can take Short position near “Buy Gen” either retesting or crossed downward from Above.
L#4: If the candle crossed & stays below the “Sell Gen”, it is treated / considered a Bearish bias.
L#5: Possibility / Probability of REVERSAL near RLS#1 & USTgt
HZB (Buy side) & HZS (Sell side) => Hurdle Zone,
*** Specialty of “HZB#1, HZB#2 HZS#1 & HZS#2” is Sidewise (behaviour in Nature)
Rest Plotted and Mentioned on Chart
Color code Used:
Green =. Positive bias.
Red =. Negative bias.
RED in Between Green means Trend Finder / Momentum Change
/ CYCLE Change and Vice Versa.
Notice One thing: HOW LEVELS are Working.
Use any Momentum Indicator / Oscillator or as you "USED to" to Take entry.
⚠️ DISCLAIMER:
The information, views, and ideas shared here are purely for educational and informational purposes only. They are not intended as investment advice or a recommendation to buy, sell, or hold any financial instruments. I am not a SEBI-registered financial adviser.
Trading and investing in the stock market involves risk, and you should do your own research and analysis. You are solely responsible for any decisions made based on this research.
"As HARD EARNED MONEY IS YOUR's, So DECISION SHOULD HAVE TO BE YOUR's".
Do comment if Helpful .
In depth Analysis will be added later (If time Permits)
RH watch $162 then 151: Double Goldens for Higher Low of BOTTOM?RH has been in a major decline this whole year.
Now retesting a Golden Genesis fib at $162.45
That fib is reinforced by a Covid fib at $151.59
Hopefully this will be a "higher Low" of its BOTTOM

GBP/JPY SHORT GBP/JPY SHORT " break of a support area and retest it + 50% fib retracement + 50 and 200 ema dynamic resistance "

PLTR: potential mid-term top formation Price have reached key mid-term resistance zone outlined in May idea:
As long as price remains below the Nov 3 highs, I’ll be operating under the main assumption that the mid-term top is in, anticipating more downside in the coming weeks and months.
A 1–3 day bounce to potentially close the gap could provide a good delayed-reaction short setup.
Chart:
Macro support ideal for this correction: 120–85.
Macro view:

PLTR: Potential for Further Upside in H2 2025Price is showing a constructive, low-volume pullback into rising EMAs - a healthy sign within an ongoing uptrend as long as price is holding above 118-110 support zone.
Daily trend structure:
Macro trend structure (Weekly):
Thank you for your attention and I wish you successful trading decisions!

NASDAQ BullishThe NASDAQ is currently reacting at a key daily market structure level.
Heading into the New York session, I’m anticipating a potential sweep of sell-side liquidity levels before price shifts upward, possibly targeting new all-time highs
#NASDAQ #US100 #Indices #TechnicalAnalysis #TradingView

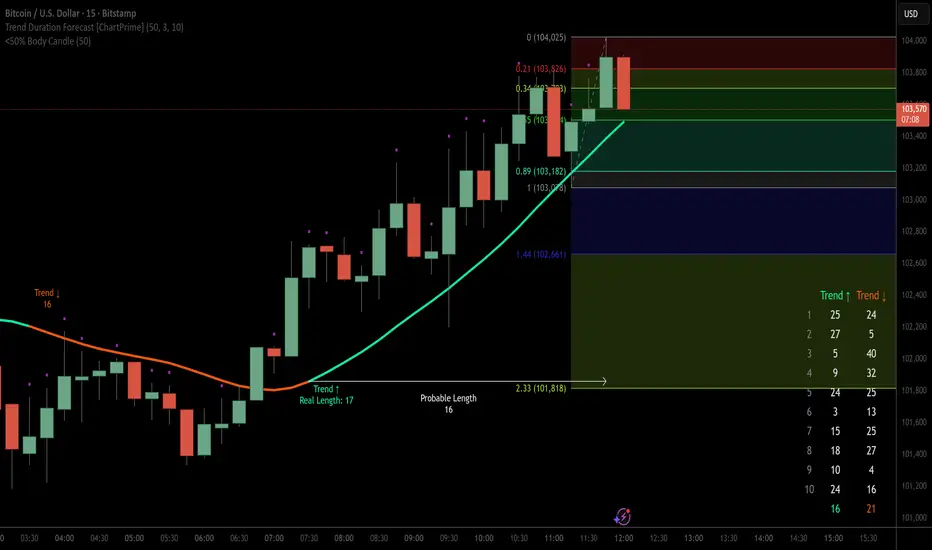
Plan for Bitcoin 130kVery simple analysis following structure, low, high, internal range liquidity (coincidentally aligns with huge weekly fair value gap) then back to new highs
This might take sometime but I'm sat

XAUUSD Long: Demand Line Supporting Move Toward $4,080 TargetHello traders! Gold (XAUUSD) continues to show resilience as price action holds above the key $3,950 Demand Zone, signaling that buyers are still defending this area effectively. After forming a Double Top pattern near the $4,150 Resistance, the market entered a correction phase, which was guided by a clean break below the neckline, followed by a retracement defined by the Fibonacci Arc. This retracement created a series of Pivot Points that now serve as short-term references for buyers and sellers. The price has since found solid support along the Demand Line, aligning with the overall ascending Trend Line that has held firm since early October. Each rejection from this zone has been met with renewed buying pressure, suggesting that the current move could represent a continuation phase within the larger bullish structure.
Currently, gold is trading around the $4,000 level, consolidating just above its Demand Line. If bullish momentum accelerates from this area, we could see a push toward the $4,080 short-term target, followed by a possible test of the $4,150 major resistance — a critical level for confirming a broader breakout.
My base scenario anticipates a gradual upward move toward $4,080, which aligns with both the trend and key resistance confluence. A clean breakout above $4,150 would open the path for a stronger bullish continuation, potentially toward $4,200+. However, a confirmed breakdown below $3,950 could shift short-term sentiment to bearish, exposing the next support area near $3,900. For now, I maintain a bullish bias, expecting further upside momentum as long as the demand structure holds firm. Manage your risk.

IMAGE (PSX: IMAGE) – Weekly ChartPrice is retracing towards the 50% Fib (27.37) after a strong bullish breakout.
As long as it holds above the 25–27 PKR zone, the uptrend may continue.
🎯 TP: 35–36 PKR
🛑 SL: 25 PKR (below 61.8% Fib)

KPEL | Buy @LTP | SL below 400 | Targets 540, 640, 710Disclaimer:
This is not financial advice. Please do your own research or consult with a financial advisor before making any investment decisions. Investments in stocks can be risky and may result in loss of capital.

SAHANA | Buy @LTP | SL below 989 | Targets 1415, 1960, 3000Disclaimer:
This is not financial advice. Please do your own research or consult with a financial advisor before making any investment decisions. Investments in stocks can be risky and may result in loss of capital.

Ethereum - Expecting Bearish Continuation In the Short TermH1 - Strong bearish move.
No opposite signs.
Currently it looks like a pullback is happening.
Expecting bearish continuation until the two Fibonacci resistance zones hold.
If you enjoy this idea, don’t forget to LIKE 👍, FOLLOW ✅, SHARE 🙌, and COMMENT ✍! Drop your thoughts and charts below to keep the discussion going. Your support helps keep this content free and reach more people! 🚀
-------------------------------------------------------------------------------------------------------------------

US 500 - Has All the Good News Been Priced?Concerns about excessive stock market valuations, especially when talking about AI focused companies, isn’t something new. In fact, it has been an on-going theme over the last 6 months of the year leading to bouts of risk aversion.
This was again the case late on Monday evening, and throughout the day yesterday when the earnings of Palantir Technologies were in the spotlight. The strange thing was that the earnings from this company, released after the close on Monday, beat analysts’ expectations, however a lack of clarity on future revenue needed to justify a market capitalisation of over $600 billion was what brought the latest concerns of an AI bubble back to the attention of traders, leading to a negative sentiment shift for the wider sector and the US 500 index in general.
Now, this may or may not be the start of a wider correction and much will depend on future risk events, price action and technical trends (more on this below), however the question for traders this time around is whether the positive news flow for US indices in the short term has already been priced? After all the US 500 index only hit a new record of 6925 on October 30th, 5 days ago.
November and December are historically strong performance months for the US 500, however currently traders are faced with several issues to navigate. Only a week ago the Federal Reserve cast some doubt over whether a rate cut in December would happen or not, with policymakers maintaining this stance in their comments at various events since then. This wasn’t expected and has led to some disappointment for traders which weighed on US 500 sentiment.
Q3 earnings have generally beaten expectations but then valuations were already high to reflect this, leading to some potential fatigue. Trade tensions between the US-China have cooled, but concerns still remain about economic growth in both countries, especially in the US, where a US government shutdown has led to the delay of key data releases such as CPI, retail sales and the all-important Non-farm Payrolls update on the current health of the US labour market, a key factor influencing the decision making of the Fed on potential interest rate cuts.
This means the release of today’s US ADP Private Payrolls data at 1315 GMT and the US ISM Services PMI survey at 1500 GMT could have a bigger influence over the direction of the US 500 moving across the week.
Technical levels and trends may also become increasingly important.
Technical Update: Back to Fibonacci Retracement Support
After reaching a new all-time high of 6925 on October 30th, the US 500 index has corrected by 2.9%, easing short-term overextended upside conditions. This pullback may reflect a healthy pause within a broader uptrend, but the question now appears to be whether this marks the extent of corrective downside moves or is the beginning of a phase of further price weakness.
As the chart below shows, latest declines in the US 500 index have now returned to a potential support zone at 6750/6760, marking the 38.2% Fibonacci retracement of the October 10th to 30th rally and the current level of the Bollinger mid-average. This possible support band may limit current declines, but closing behaviour around this area could be important in determining whether buyers can regain the upper hand or if deeper corrective risks can emerge.
Traders could now be watching this 6750/6760 support closely, as closing break below might see increased downside pressure. Such moves could then mean focus shifts to 6711, even 6661, marking the deeper 50% and 61.8% Fibonacci retracement levels.
That said, while the support is currently under pressure, the 6750/6760 range still holds on a closing basis and may help limit further selling pressure, even possibly see renewed attempts at price upside. However, traders may also now be monitoring 6825, equal to half the recent price decline, as a resistance level in the sessions ahead.
If momentum is to shift back toward attempts to renew price strength, a closing break above 6825 may be required to suggest scope to retest the 6925 October 30th all-time high.
The material provided here has not been prepared accordance with legal requirements designed to promote the independence of investment research and as such is considered to be a marketing communication. Whilst it is not subject to any prohibition on dealing ahead of the dissemination of investment research, we will not seek to take any advantage before providing it to our clients.
Pepperstone doesn’t represent that the material provided here is accurate, current or complete, and therefore shouldn’t be relied upon as such. The information, whether from a third party or not, isn’t to be considered as a recommendation; or an offer to buy or sell; or the solicitation of an offer to buy or sell any security, financial product or instrument; or to participate in any particular trading strategy. It does not take into account readers’ financial situation or investment objectives. We advise any readers of this content to seek their own advice. Without the approval of Pepperstone, reproduction or redistribution of this information isn’t permitted.

NEAR reversal areaNear is in a perfect level to bounce. Market is in extreme fear but this might be a good level to add on to holdings. Its both a good level of support from past price actions and current fibo levels.
Initial target is marked on the chart, lets see if we get rekt again :) Risk reward ratio looks good to me.
Cheers

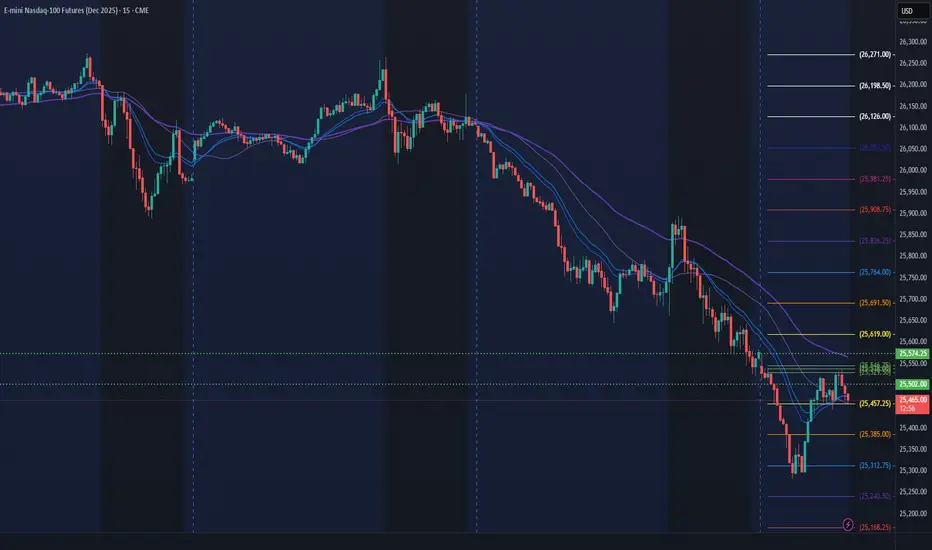
NQ Power Range Report with FIB Ext - 11/4/2025 SessionCME_MINI:NQZ2025
- PR High: 25574.25
- PR Low: 25501.75
- NZ Spread: 161.75
Key scheduled economic events:
09:15 | ADP Nonfarm Employment Change
10:00 | ISM Non-Manufacturing PMI
- ISM Non-Manufacturing Prices
10:45 | S&P Global Services PMI
Session Open Stats (As of 12:45 AM)
- Session Open ATR: 401.88
- Volume: 92K
- Open Int: 290K
- Trend Grade: Long
- From BA ATH: -3.5% (Rounded)
Key Levels (Rounded - Think of these as ranges)
- Long: 26636
- Mid: 25410
- Short: 24039
Keep in mind this is not speculation or a prediction. Only a report of the Power Range with Fib extensions for target hunting. Do your DD! You determine your risk tolerance. You are fully capable of making your own decisions.
BA: Back Adjusted
BuZ/BeZ: Bull Zone / Bear Zone
NZ: Neutral Zone