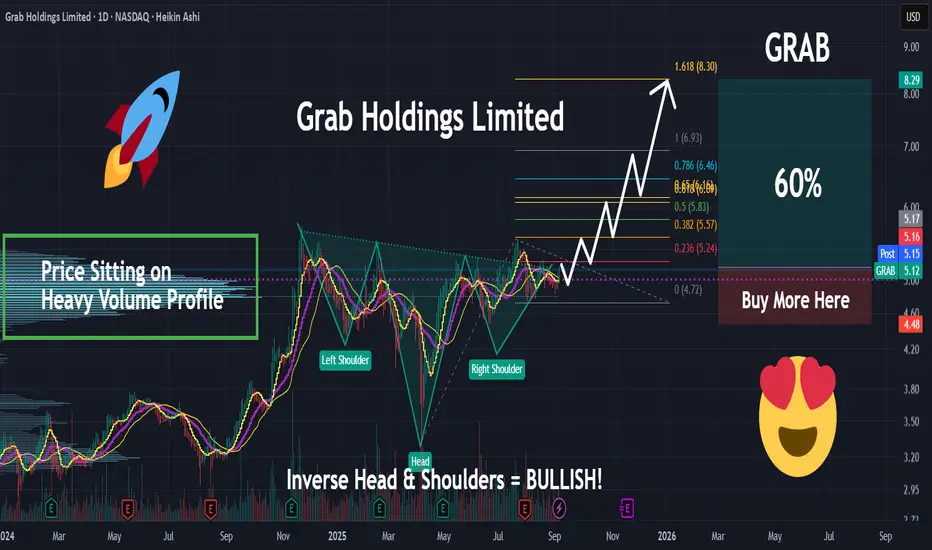
GRAB | The Time Has Come | LONGGrab Holdings Ltd. engages in the provision of millions of people each day to access its driver- and merchant-partners to order food or groceries, send packages, hail a ride or taxi, pay for online purchases or access services such as lending, insurance, wealth management and telemedicine, all through a single "everyday everything" app. The firm operates in food deliveries and mobility and by TPV in the e-wallets segment of financial services in Southeast Asia. It operates across the deliveries, mobility and digital financial services sectors in eight countries namely: Cambodia, Indonesia, Malaysia, Myanmar, the Philippines, Singapore, Thailand and Vietnam. The company was founded by Anthony Tan Ping Yeow and Tan Hooi Ling in 2012 and is headquartered in Singapore.
Fibonacci
USDJPY - in the Resistance ClusterYen entered into a resistance cluster. Yet, the stock market demonstrates weakness. Yen, typically used for carry trading may gain if stocks are sold. Then we may observe a significant correction, even down to 146.
Just my humble opinion

GBPUSD - Key Support - D1Price just entering a suport cluster, which I think will be respected. I expect the price to go up to 1.33 or even 1.34, then return and continue decline down to 1.28.
Just my humble opinion

USD/CHF Coiled for November BreakoutThe Swiss Franc is back on the defensive this week, with USD/CHF up more than 1.2% in the wake of the Fed rate decision. The three-day advance has extended into technical resistance heading into the weekly and monthly close, and the focus now turns to a potential inflection off this key zone.
USD/CHF is trading within the confines of a proposed ascending pitchfork extending off the monthly lows. The break of the weekly opening-range on Fed-day extended into the 75% parallel with price now testing resistance at 8040- a region defied by the 100% extension of the advance off the monthly low and the April swing low. A topside breach / close above this threshold would expose the September / October swing highs at 8072/76. Strength surpassing this hurdle would be needed suggest that a more significant low is in place / a larger trend reversal is underway with subsequent resistance objectives eyed at the 100% extension of the broader September advance at 8120 and the August high / May low at 8172/85 (both levels of interest for possible exhaustion / price inflection IF reached).
Initial support rests with the August low-day close (LDC) at 8007 and is backed by the objective October open at 7964. Losses below this threshold would invalidate the near-term uptrend with a break / close below the July LDC at 7911 ultimately needed to mark resumption of the broader downtrend towards the yearly lows.
Bottom line: USD/CHF continues to coil within the broader September range, and the focus is on a breakout of this multi-week consolidation pattern. From a trading standpoint, a good zone to reduce long-exposure / raise protective stops- losses should be limited to 7964 IF price is heading higher on this stretch with a close above 8076 ultimately needed to fuel the next major leg of the advance.
-MB

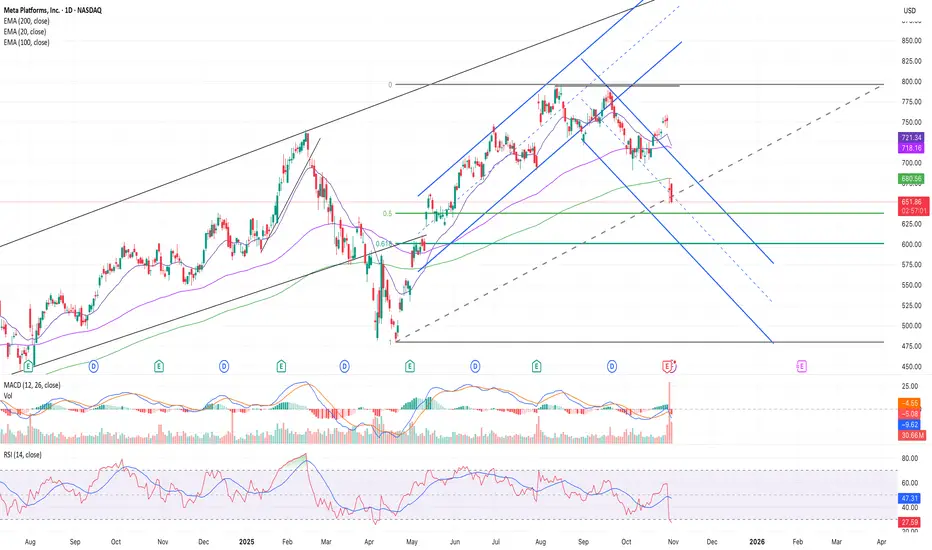
META | Descending Channel & 0.618 Fib SupportMETA is trading inside a descending channel after breaking its main uptrend. Price recently rejected the upper boundary with strong sell volume and a bearish MACD crossover, showing short-term weakness.
The 0.5 Fibonacci level is acting as current support — if price breaks below this, expect a retrace toward the 0.618 Fib zone ($400–$405) which aligns with key channel support. Holding this level could trigger a rebound toward $450–$470, but a close below $400 opens the door to $380–$360.
RSI is near oversold, suggesting a potential bounce if the 0.618 level holds. Medium-term correction within a larger bullish structure.
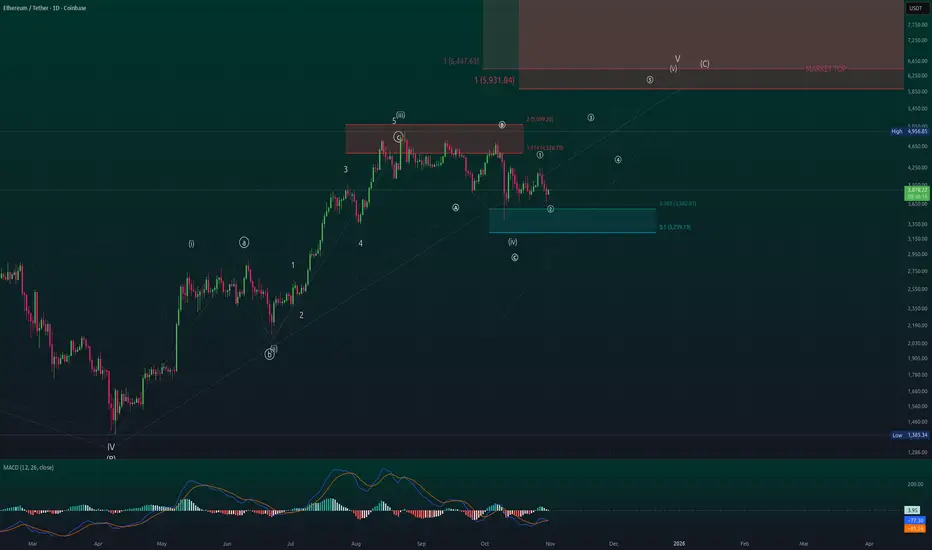
ETH/USDT — Comprehensive EW & Fib RoadmapETH/USDT — Comprehensive EW & Fib Roadmap
**Structure:** From the **Jun ’22 bear-market low → Mar ’24** forms **A/3**; **Apr ’25** prints **B/4**. Since April we’re advancing in **daily Wave C**, now focusing on **(iv)–(v)** completion toward terminal levels. This continues my earlier public idea/thread on ETH’s multi-degree terminal advance.
---
1) Multi-timeframe context
* **Primary count:** Weekly corrective **A–B–C** from ATH with the current leg = **Wave C**. Within it, daily is progressing to finish **Wave (v) of C** (terminal risk once complete). Core EW rules/guidelines (no W2 > 100% of W1; W3 not the shortest; W4 typically avoids W1 territory; alternation) frame the count and invalidations. ( )
* **Fibonacci basis:** Using standard retracement/extension clusters (0.382/0.5 retraces; 1.618/2.0 extensions) for targets and pullback zones.
---
2) 2025 zoom-in (from the Apr ’25 **B/4** low)
* We have a completed **(i)–(iii)** push into the **Aug ’25 high ≈ $4,956** (marked **Wave 3** on the chart).
* **Wave (iv)** most likely **bottomed 10 Oct ’25 ≈ $3,429**, landing in the blue retrace box (**0.382 ≈ $3,575**; **0.5 ≈ $3,233**).
* From that low, price carved a fresh **1–2** to the upside → launching pad for **③ of (v)** toward terminal targets (bearish reversal risk once (v) completes).
*(All levels and labels are taken from the provided chart screenshots.)*
---
3) Confluence zones & path to completion
* **Resistance pivots from prior swings:** **1.618 ≈ $4,528.7** then **2.0 ≈ $5,099**.
* **Terminal target cluster for (v) of C:**
* **$5,900** (first box edge),
* **$6,447** (upper confluence),
* **$8,731** (stretch/throw-over if momentum overshoots).
These align with typical EW/Fib projections for a terminal wave; diagonals often end with throw-overs and sharp reversals thereafter.
---
4) Risk management & invalidation
* **Structure invalidation of the immediate 1–2→3:** sustained break **below $3,200–$3,180** (beneath 0.5 box & October spike-low context) = defer (v) and expect a deeper/complex (iv).
* **Momentum tell:** A push into the $5.9k–$6.45k band with fading momentum/divergence would fit terminal behavior; diagonals frequently reverse hard after completion.
---
5) Alternate (lower-probability)
* If price closes **below $3,429** and holds, treat the current advance as incomplete corrective work; wait for a **new 1–2** before re-engaging on the long side. (Rule-based posture per EW hard rules/guidelines.)
---
## Trade Idea (non-advice; execution-ready)
**Bias:** Long the **1–2** base for a run into the terminal cluster, then de-risk into strength.
**Entry (Option A — pullback ladder):**
* **$3,575 → $3,233** (0.382–0.5 “blue box”). Scale in 3–4 tranches.
**Entry (Option B — confirmation add):**
* Add on decisive **daily close > $4,529** (1.618 pivot) targeting the $5.1k box next.
**Stop / Invalidation:**
* Hard stop **$3,180** (beneath the 0.5 box & Oct spike low). Re-assess if hit.
**Targets / Scale-out plan:**
* **T1:** **$5,100** (2.0 ext / prior resistance).
* **T2:** **$5,900** (terminal box edge).
* **T3:** **$6,447** (upper confluence).
* **Stretch:** **$8,731** only if momentum remains strong (take partials aggressively; diagonals can “throw-over” then snap back). ( )
**Position sizing & management:**
* Risk **≤1–2%** of equity per idea; trail under higher lows once price converts **$4,529** to support; aggressively reduce above **$5.9k** if momentum divergences appear. ( )
---
Reference / Continuation
This analysis continues my prior ETH terminal-advance roadmap on TradingView; review for the higher-timeframe diagonal context and publishing notes. ( )
---
Disclosure
Educational analysis only; **not financial advice**. Risk per trade **≤ 1–2%**.
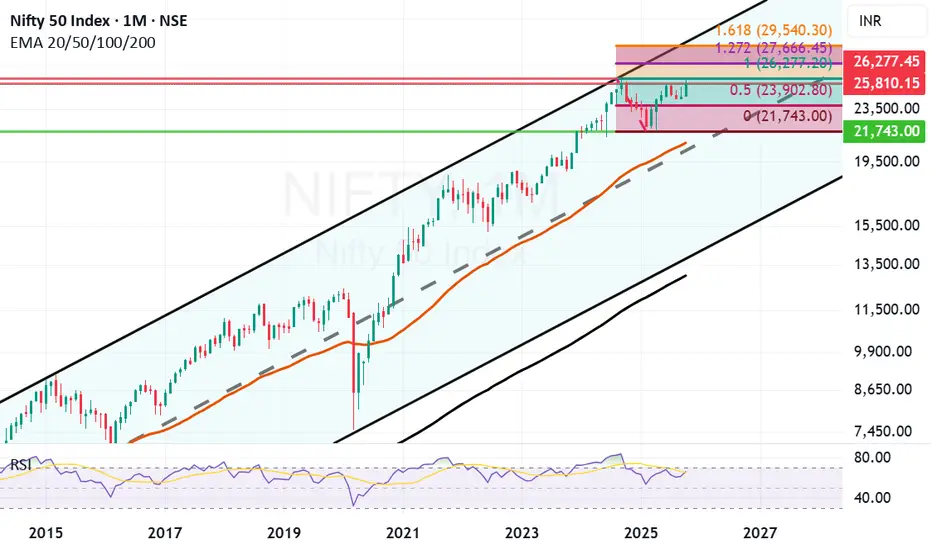
Negative closing today but it was a good monthly closing candle.Despite negative closing for last 2 days of the month it was an overall good monthly candle for Nifty. Previous highest Monthly closing for Nifty was 25810 in September 2024. This month we got a closing slightly below the same at 25722 in October 2025. Once we get a closing above previous all time high in the next month or 2 on in few months time the doors for Next Fibonacci level opens. The next Fibonacci resistance level after we get a closing above previous ATH of 26277 will be at 27666. Golden Fibonacci ratio target in few years time will be 29540.
Very strong Fibonacci support now remains at 23902. Next Fibonacci level support in case of a catastrophic event will be at 21743. Mother line of 50 Months EMA remains at 20853 which is very close to mid-channel support in case there are multiple global or regional situations creating instability.
As of now the shadow of the candle seems positive however there is a chance of little bottom testing for Nifty before we get a new all time high. Sectoral rotations and reshuffling of portfolios of HNIs, MFs and FIIs might also be on card depending on the trade deals and newly emerging tariff scenarios.
Selective stocks which have been giving good results year on year and Quarter on Quarter from Consumption, Defense, Auto, Infrastructure, Banking and Capital Goods sectors including the PSUs themes look good for long term investment currently. While previous superstars of IT, Pharma, Services and other few sectors which lead the previous rally can tend to remain laggard and sideways, specially if the trade deal agreement remain unresolved. If the trade deals with EU and US, specially US goes through even these sectors will fight back and tend to perform.
Overall it was a good month of recovery where Nifty made a comeback from the lows of 24605 to reach 26104 gaining almost 1499 points at one point. Yet it was little disappointing to close below 26K at 25722. Still the positive is that we gained 1117 points this month which is not a bad show at all. Hoping that we get a monthly closing above 26K or previous ATH soon so that doors for next phase of Bull rally can commence swiftly.
Disclaimer: The above information is provided for educational purpose, analysis and paper trading only. Please don't treat this as a buy or sell recommendation for the stock or index. The Techno-Funda analysis is based on data that is more than 3 months old. Supports and Resistances are determined by historic past peaks and Valley in the chart. Many other indicators and patterns like EMA, RSI, MACD, Volumes, Fibonacci, parallel channel etc. use historic data which is 3 months or older cyclical points. There is no guarantee they will work in future as markets are highly volatile and swings in prices are also due to macro and micro factors based on actions taken by the company as well as region and global events. Equity investment is subject to risks. I or my clients or family members might have positions in the stocks that we mention in our educational posts. We will not be responsible for any Profit or loss that may occur due to any financial decision taken based on any data provided in this message. Do consult your investment advisor before taking any financial decisions. Stop losses should be an important part of any investment in equity.
XAUUSD major pump not finished yet Gold has initiated a short-term corrective phase, with technical indicators suggesting potential for further downside in the immediate term. However, this near-term weakness does not alter our constructive long-term fundamental and technical outlook.
The broader macroeconomic backdrop, including factors such as central bank demand, inflationary pressures, and geopolitical uncertainty, continues to support a structurally bullish thesis for the asset.
Based on this macro-technical analysis, we project a sustained upward trajectory over the coming months. The primary long-term target remains the $5,000 per ounce level, which we view as a feasible objective within the current global economic cycle.
DISCLAIMER: ((trade based on your own decision))
<<press like👍 if you enjoy💚

Breakout ScenarioXRP ist moving in a triangle formation and might have completed the bottom formation of the wave 2 at the 78,6 Fib level
Breakout could be possible in a wave 3 to 1,618 fib or 2,618 fib levels in a impulsive wave 3
Wave 4 and 5 already marked but depends of coure of and if wave 3 is happening.

GbpAudafter this retracement till to zone fibo gold, now the price will go down till to our target, lets see..

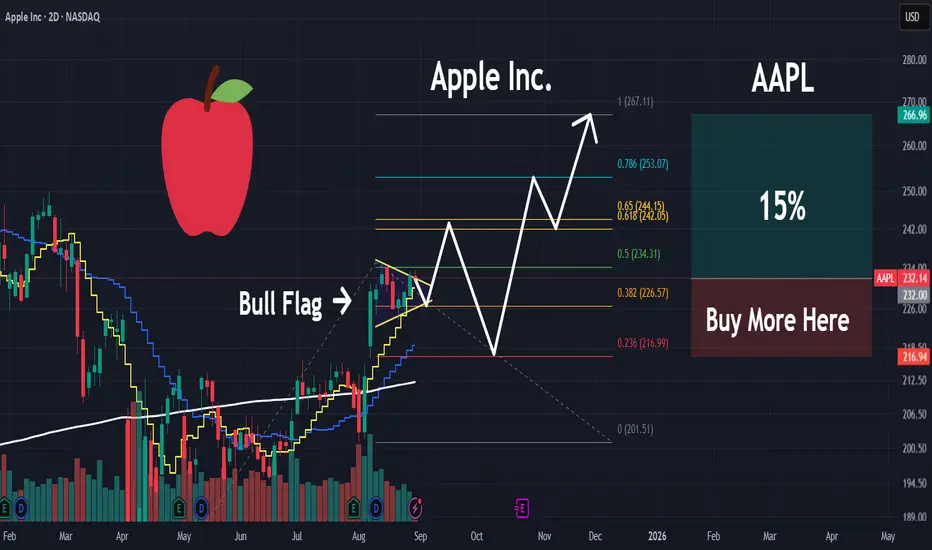
AAPL | Money will Rotate into this MEGA CAP | LONGApple, Inc. engages in the design, manufacture, and sale of smartphones, personal computers, tablets, wearables and accessories, and other varieties of related services. It operates through the following geographical segments: Americas, Europe, Greater China, Japan, and Rest of Asia Pacific. The Americas segment includes North and South America. The Europe segment consists of European countries, as well as India, the Middle East, and Africa. The Greater China segment comprises China, Hong Kong, and Taiwan. The Rest of Asia Pacific segment includes Australia and Asian countries. Its products and services include iPhone, Mac, iPad, AirPods, Apple TV, Apple Watch, Beats products, AppleCare, iCloud, digital content stores, streaming, and licensing services. The company was founded by Steven Paul Jobs, Ronald Gerald Wayne, and Stephen G. Wozniak in April 1976 and is headquartered in Cupertino, CA.
EURUSD SHORTS Will only be taking shorts if extreme of this leg gets tested and 1 h turns bearish around this area for educational purposes only. Trade safe

EBAY Wave Analysis – 30 October 2025
- EBAY broke support zone
- Likely to fall to support level 80.00
EBAY today opened with the sharp downward gap which broke the support zone between the support level 87.00 (which stopped multiple downward corrections from September) and the 50% Fibonacci correction of the upward impulse from June.
The breakout of this support zone accelerated the active intermediate ABC correction from the key resistance level 101.00.
EBAY can be expected to fall further toward the next support level 80.00 (former resistance from June).

CADJPY Wave Analysis – 30 October 2025
- CADJPY broke resistance zone
- Likely to rise to resistance level 111.30
CADJPY currency pair recently broke the resistance zone between the resistance level 109.60 (which stopped wave (1) at the start of October) and the 50% Fibonacci correction of the downtrend from July of 2024.
The breakout of this resistance zone accelerated the active intermediate impulse sequence (3) from the middle of October.
Given the clear daily uptrend, CADJPY currency pair can be expected to rise further to the next resistance level 111.30 (former multi-month high from November).

XAU/USD – Gold Maintains Short-Term Uptrend, Target $4,108🔍 Market Context
Gold continues to uphold a short-term bullish structure after forming a clear Change of Character (ChoCH) around the 3,926 USD area.
Buyers are in control as prices consistently create higher lows and react positively at the Order Block + Support Trendline zone.
As long as prices remain above the 3,940–3,926 USD range, the bullish structure is preserved.
💎 Key Technical Zones
• Order Block Bullish: 3,926 USD → main support zone, confluence with rising trendline.
• Fair Value Gap (FVG): 3,942 – 3,972 USD → potential liquidity absorption zone.
• Resistance Zone: 4,032 USD → short-term barrier, needs to break to confirm continued upward momentum.
• Liquidity Zone: 4,108 USD → extended target if the above resistance is breached.
🎯 Trading Scenarios
1️⃣ BUY Setup – Prioritize catching the retracement from the support zone
• Entry: 3,942 – 3,926 USD
• Stop Loss: 3,910 USD
• Take Profit:
– TP1: 3,972
– TP2: 4,032
– TP3: 4,064
– TP4: 4,108
✳️ “Buy the discount” – Prioritize entries at the confluence of OB + FVG to follow Smart Money flow.
2️⃣ SELL Scalp – Short-term at resistance zone
• Entry: 4,032 – 4,048 USD
• Stop Loss: 4,060 USD
• Take Profit:
– TP1: 4,010
– TP2: 3,972
– TP3: 3,942
✳️ “Sell the premium” – Only activate if a clear price rejection signal appears at resistance.
💬 Summary
The current structure remains bullish short-term with the 3,926 USD area as the key invalidation zone .
As long as prices stay above the trendline, the immediate target is the 4,108 USD liquidity zone.
Optimal strategy: Buy on dip – Sell on reaction.
💡 Today's Tagline:
“Smart Money buys fear, sells greed — follow the footprints, not the noise.”
⏰ Timeframe: 1H
📅 Update: 31/10/2025
✍️ Analysis by: Captain Vincent

USDJPY → Attempt to break through trend resistance FX:USDJPY breaks through the resistance of the bullish pattern and attempts to remain in the long zone. There is a possibility of price growth against the backdrop of the dollar's rise following Powell's speech.
The dollar is recovering after the Fed meeting, and against this backdrop, the Japanese yen is losing ground, breaking through resistance at 153.23. The currency pair is trying to capitalize on the chance for growth.
The Japanese yen is forming a breakout of the resistance of a bullish pattern: an ascending triangle + consolidation on a bullish trend.
If buyers keep the price above 153.23, the market will have a chance to grow to 154.7.
Resistance levels: 153.23, 154.7
Support levels: 151.85, 152.37
On D1, the currency pair is trying to overcome the resistance of a multi-month downward correction. Locally, on H1, there is a breakout of the bullish pattern structure, which indicates interest from buyers. The chances of growth from 153 will appear if the price consolidates above the specified level.
Best regards, R. Linda!

Gold Technical Outlook: From Reaction Zone to RallyStructure and Trendline Break
Gold on the H1 timeframe shows a clear breakout from the descending trendline, signaling a structural shift from bearish to potential bullish continuation. The breakout is supported by the formation of a higher low, suggesting growing buying pressure.
ABC Pattern and Key Retracement Zone
After the first bullish impulse from 3887 to 4045, price is now in a corrective phase (wave B), pulling back into the Fibonacci retracement zone:
0.618 (3993) to 0.786 (3978) marks the PRIMARY REACTION ZONE, where buyers are likely to step back in.
A strong bullish reaction from this zone would confirm the start of wave C.
Fibonacci Extension Targets
If the bullish continuation (wave C) unfolds as projected:
1.618 extension at 4117 → short-term bullish target.
2.618 extension at 4259 → main bullish projection, mirroring the prior impulsive move.
As long as price holds above the 3950–3980 support range, the bullish structure remains intact.
Trading Bias & Summary
Bias: Bullish (while above 3980)
Ideal Entry: Buy limit around 3980–3995 (Primary Reaction Zone)
Invalidation: Break below 3950 (signals potential deeper correction)
Targets: 4117 and 4259

USDCAD — Fib Retracement Rejection & Bullish Continuation SetupUSDCAD is respecting the Fibonacci retracement structure after pulling back from the 1.4078 swing high. The pair retraced toward the 0.618–0.786 zone (1.3818–1.3729), showing strong buying interest near trendline support. This reaction suggests that bullish momentum may resume if price maintains above 1.3820.
Key Technical Levels:
Resistance: 1.4078 (recent high), 1.4250 (long-term target zone)
Support: 1.3818–1.3730 (Fib retracement + trendline confluence)
Extension Target: 1.4250–1.4300 (1.272–1.414 projection)
Outlook:
Price is forming a potential higher low structure aligned with the ascending channel. As long as the structure holds above 1.3800, the next wave higher could target 1.4078, followed by 1.4250.
A daily close below 1.3730 would invalidate the bullish setup and open room for deeper retracement toward 1.3630 (1.272 Fib extension).
Bias:
Bullish continuation favored while price remains above 1.3800, supported by USD resilience and weakening CAD due to softer oil sentiment.

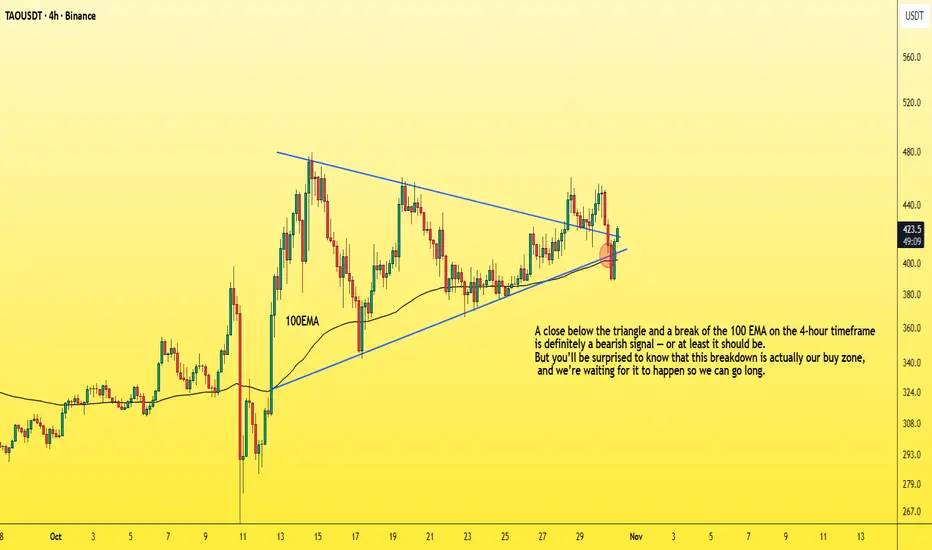
How to enter a successful futures tradeDrop everything and let me show you how to enter a successful long position with the lowest possible risk.
You need to understand that the market maker usually acts against us at major support areas on the chart — like the 100 EMA, 0.618 Fibonacci level, or a trendline.
To make this clearer, let’s take TAO as an example and I’ll explain why.
TAO has strong momentum and a large market cap,
so don’t apply what I’m about to say to meme coins, for example.
Now let’s go step by step on how to enter a futures position after choosing the coin 👇
1. First, wait for a bullish pattern to form — like a triangle — and for the coin to break it upwards with increasing long momentum.
2. The price will then retest the trendline, encouraging people to enter with larger positions, and those who missed the first breakout will likely place buy orders at the retest zone.
3. Then, the market surprises them — it drops back inside the triangle, giving a small bounce at the lower side.
4. But it doesn’t stop there — it continues dropping, breaking below the triangle and closing below the 100 EMA on the 4-hour chart.
This makes you panic and close your long position.
Others start entering shorts thinking it’s a real breakdown.
5. That’s when the market reverses sharply upward,
trapping short traders in losses,
while long traders who exited too early also lose.
In the end, only those who placed buy orders slightly below the strong support level (not directly on it, like under the 100 EMA) — and of course the market maker — end up winning.
So basically, the long traders lose, the short traders lose,
and only a small percentage of smart traders and the market maker win.
Small things to pay attention to 👇
-Your entry point should be slightly below the support, not too far below it.
(That support could be the 100 EMA, below the triangle pattern, or the 0.618 Fibonacci level, as we mentioned.)
-Don’t use high leverage — x5 should be your maximum.
-Place your stop loss 5% below your entry zone,
which equals about 25% loss if you’re using x5 leverage.
And with that, you’ve got yourself a long setup with over a 90% success rate,
and you can apply the same logic in reverse when taking a short position.
Best Regards:
Ceciliones🎯
USDJPY — Fibonacci Confluence and Trend Continuation SetupThe USDJPY pair is currently consolidating around the 153.78–153.35 Fibonacci zone after testing the 0.236 retracement from the recent swing high at 154.47. Price is holding above the short-term ascending trendline, indicating that bullish structure remains intact unless we see a clean break below the 0.618 retracement (152.64).
Key Technical Zones:
Resistance: 154.47 (swing high)
Support 1: 153.35 – 152.64 (Fib confluence and trendline zone)
Support 2: 151.50 / 150.70 (major retracement & potential buy zone)
Trade Outlook:
I’m monitoring a potential pullback toward 153.35–152.90, where buyers may re-enter for another push toward 154.40–155.00.
If price fails to hold above 152.60, the bias shifts to short-term bearish, with targets near 150.70–149.70 (1.272–1.618 extension levels).
Bias:
Bullish continuation favored while above 152.60, supported by recent USD strength and stable U.S. yields.
However, keep an eye on the upcoming Fed & BoJ events, as policy tone could shift volatility and trend momentum.

XAU/USD Update 2 Buying OpportunityNext move on the way. Focus on proper risk management & stay disciplined. Wishing you successful trades..!
Key Reason:
1. Unmitigated demand order flow along with proper BOS.
2. BISI still in pending.
3. If buyers remain strong. Then we'll see pump in gold price. High probability setup for buying.
Confirmation is most important part. Let's see how it will work.

XAU/USD Update 1Next move on the way, focus on proper risk management & stay disciplined. Wishing you successful trades..!
Key Reason:
1. 1 hour supply area.
2. In smaller time frame we've IMB inside this supply area.
3. Confirmation is very important. Let's see how it will work.

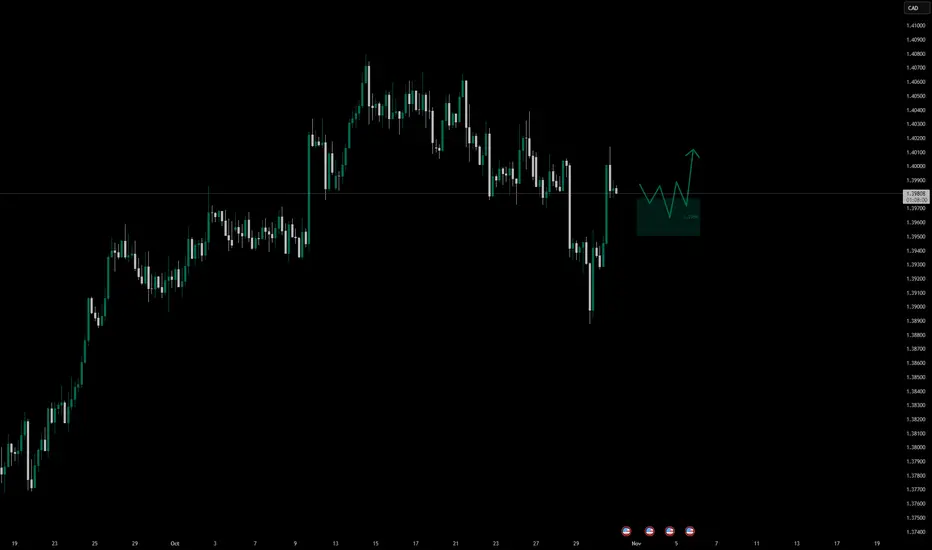
USDCADUSDCAD
Monitoring the 1.39640–1.39500 zone for a potential bullish continuation, provided the structure remains intact.
⚠️ Wait for price to reach this zone before considering any long positions — patience is key here.
Use your own entry model and apply strict risk management, ideally risking no more than 1% per setup.
Trade with confirmation; never chase a moving market.