GOLD ANALYSIS (1 W)To understand the psychology in Gold,
I use only two tools:
Fibonacci retracement,
Trend-based Fibonacci extension.
We will use these two tools to measure the weekly cycles.
Since November 2022, Gold has been forming a pattern that can only be explained by Fibonacci principles.
Using Fibonacci retracement for each swing high and low, you'll realize that each retracement equals around 50%.
In only one example, we see that a higher low reaches the 61.8% level, which is also acceptable.
After these retracements, the next leg of the impulsive move always reaches around the 1.618 Fibonacci extension.
According to these two basic technical factors, Gold should first reach around $3,800, and then aim for the $6,600 level during the next impulsive leg in the coming years.
I’m not even going to list all the reasons why Gold tends to go up over time.
Most people reading this analysis are already aware of the fundamentals behind Gold’s long-term bullish nature.
Thanks for reading.
Fibonacci

SPX WEEK 48 — Strong Bounce Into Year-End! 2026 BULL RUN COMING?Strong week for the SP:SPX index. After two weeks of hesitation candles, price finally shifted back into strength and pushed decisively higher. This week’s candle not only reclaimed momentum but fully erased last week’s cooling-off behavior.
Price also moved well above the key mid-range levels that traders usually watch to define trend health. It’s now sitting firmly above the major risk zone and continues building distance away from it — a clear sign of strength. From the moment this week’s upside break triggered, the index has gained roughly 1.9%, and that kind of move typically translates into solid returns for options traders playing directional setups.
Major support zones sit lower around 5900, 5100, and the deeper structural support near 4000. As long as price holds above the upper layers of support, momentum remains intact.
On the higher-timeframe monthly chart, the trend has been active for eight straight months with no signs of exhaustion. Price is still far above the level where the monthly trend began, and even further above the long-term midline — showing how dominant the larger trend still is.
The 2-day chart continues to support the overall bullish structure, breaking above short-term levels and maintaining strength after multiple confirmations earlier in the week.
This week was a clean continuation of the broader uptrend — strong candle, strong momentum, and strong positioning above every major structural region.
Elite clarity. Elite precision. More coming soon.

Take Profit trader 25,000 account challengescanning markets for set ups and asian presented a quick scalp!!!! check the video out on my journey to loss or profits!!

JPYRUB — Yen weakeningWe continue moving down.
The first target is 0.47, and the next possible target is 0.41.

December 1 2025 - December 5 2025: Maximum NeutralityThe market is back in a neutral position. It will be important to assess whether this is the end of a mean reversion or if macro conditions will continue to improve to support a risk-on bias that will likely take us through the end of the year. I’m considering the market to currently be at a point of maximum neutrality, however I lean on the side of the market continuing to seek risk. Time will tell.
1. Macro
We should begin to see more risk confirmation here early in the week. If the regime is risk-on, I think the Dollar will underperform some of the other funding currencies (JPY, EUR, and CHF), so I will be watching to see how treasury pricing TVC:US10 responds to a flat or falling dollar. I would want to see lower real yields FRED:DFII5 (or TVC:US05Y -T5YIE) so it would be preferable to see US10 remain flat or edge higher.
Breakevens are still very low, so the risk of real yields rising is high. I think bond volatility would also bring equity volatility since rising real yields amid slower growth is classic risk-off. Nominal yields will be important to watch.
2. FX
Since the start of November, the dollar has started to lose strength in relation to high-yielding currencies (NZD & AUD), so if we continue to see forex seek yield, that will add to the risk-on bias. I will be watching currency pairs that contain NZD and AUD as well as TVC:GB02Y -US02Y to see if US yields start to lose strength against Great Britain. I would like to see British yields rise in correlation to put further pressure on the dollar.
Currently neutral but I favor the risk-on side here based on what I’m seeing.
3. Risk
Option Adjusted Spreads (corporate bond yield pts above treasuries) are still historically low and are ticking back down, easing fears that corporate bonds are selling off. Private credit recovering also suggests that credit fears are easing across the board. This supports the risk-on bias.
4. Sector Comparison
Consumer Staples AMEX:XLP started to weaken against SP:SPX during last week’s recovery while tech AMEX:XLK outperformed. As shown on the previous chart, it will be important to watch $XLK/XLP as a risk-on/risk-off bias indicator for equities. It will also be important to watch for signs that the market is rotating from healthcare AMEX:XLV to tech $XLK. No important signals on this chart.
5. Bias
Last week’s recovery was confirmed by dealers taking short-volatility positions intraday and the price propelled past monthly VWAP (dashed). The price may revert back towards November’s VWAP level but as long as the level is not breached, it should favor the risk-on bias as well. The price has already retraced 61.8% of the downtrend.
+-+-+-+-+-+-+-+-+-+-+-+-+-+-+-+-+-+-+-+-
Conclusion: As I stated in my introduction, based on my macro indicators the market closed at a point of maximum neutrality on Friday. We will need to see nominal yields mostly flat or falling while VIX sells off to confirm risk-on positioning, however an earlier indicator will be found in Forex, where yield-seeking o aversion can be assessed in real time. With credit conditions also improving, I lean to the bullish side but will keep this Idea neutral to maintain my flexibility.
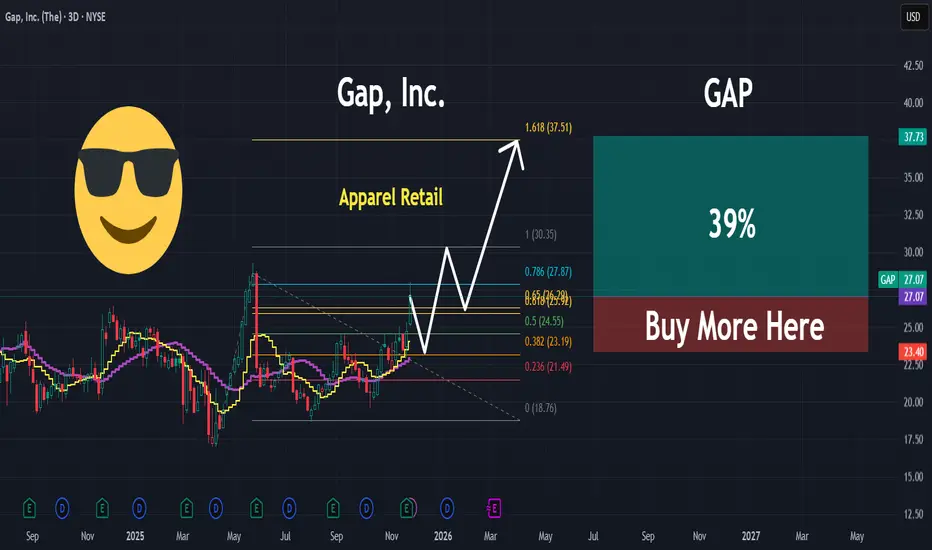
GAP | This Retailer Has Potential | LONGGap, Inc. operates as a global apparel retail company, which offers clothing, apparel, accessories, and personal care products for men, women, and children. The firm operates through the following segments: Gap Global, Old Navy Global, Banana Republic Global, Athleta, and Other. The Gap Global segment includes apparel and accessories for men and women under the Gap brand, along with the GapKids, BabyGap, GapMaternity, GapBody, and GapFit collections. The Old Navy Global segment offers clothing and accessories for adults and children. The Banana Republic Global segment provides clothing, eyewear, jewelry, shoes, handbags, and fragrances. The Athleta segment offers fitness apparel for women. The company founded by Donald G. Fisher and Doris F. Fisher in July 1969 and is headquartered in San Francisco, CA.
USB | This Regional Bank May POP Higher ! | LONGU.S. Bancorp operates as a bank holding company, which offers financial services including lending and depository services, cash management, foreign exchange and trust and investment management. The firm also offers mortgage, refinance, auto, boat and RV loans, credit lines, credit card services, merchant, bank, checking and savings accounts, debit cards, online and mobile banking, ATM processing, mortgage banking, insurance, brokerage and leasing services. The company was founded on April 2, 1929, and is headquartered in Minneapolis, MN.

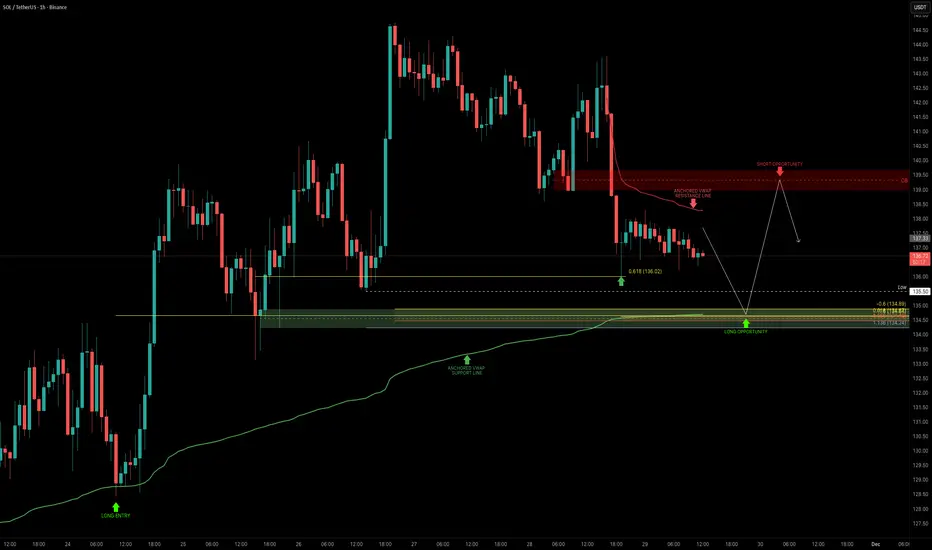
SOL — Fibonacci & Anchored VWAP ConfluenceSOL continues to be one of the most technically reliable assets, consistently respecting Fibonacci levels and key market structures. The zone between $135–$134 stands out as the next high-probability long opportunity, with multiple Fibonacci clusters lining up with the anchored VWAP from the swing low. The $134 level also aligns with the 75B market cap, adding an additional layer of confluence.
I’m looking for a long setup in this zone, targeting the $139–$140 order block for TP. This gives a clean 1:3 R:R, with the stop placed just below $133.
I’m currently developing a dynamic confluence indicator that highlights stacked support and resistance zones with high-probability reversal zones. The $139–$140 zone is currently showing a cluster of resistance, reinforcing it as the ideal TP target.
_________________________________
💬 If you found this helpful, drop a like and comment!
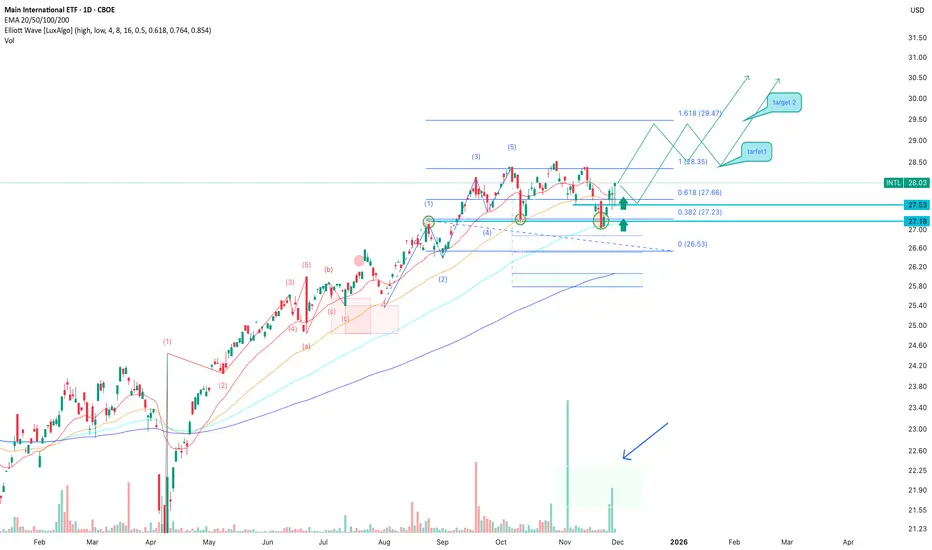
INTL: Bulls Defend Support — Buy Zone ActiveINTL remains one of the more stable international ETFs, and recent weeks show growing interest from larger players — rising volume at local lows signals accumulation. Fundamentally, the ETF is supported by diversified exposure to global companies, relatively low volatility, and renewed capital inflows into international markets as the USD cools off. This macro backdrop creates a solid foundation for a medium-term continuation of the uptrend, especially if expectations of potential Fed easing stay in place.
Technically, the price continues to defend the key support area at 27.50–27.20, where buying activity has appeared multiple times. The decline looks like a correction inside a broader bullish structure, while EMA 20/50/100 indicate a possible recovery. The Elliott wave structure also keeps the potential for a new impulsive move. A confirmed breakout above 28.35 would open the path toward 29.47 as the first target. The optimal entry is either after a confirmed hold above 28.00 or on a retest of 27.50–27.20 if a reversal signal forms.

EURUSD - why am I bearish on the priceWell, thank you for commenting on my ideas on EURUSD. This is what makes the TradingView community unique.
In one of the comments I learned that I am agains the mainstream believing that EURUSD is not going to continue growing (will not hit the next max after 1.19191 on Sep 15th). In this post I would like to provide arguments for which I am bearish in EURUSD, yet keeping in mind that those are just my humble opinions and as such they can be completely wrong.
So, let's do that:
Argument #0 - EURUSD in W1 in in Downtrend since June 2008
Argument #1 - Overbalance - total size of the corrections (marked light blue) are almost equal. Yet the recent correction perfectly is aligned with Garttley pattern (Argument 4).
Argument #2 - The BC parts of the above mentioned corrections are equal too (marked navy blue)
Argument #3 - the recent correction has performed a perfect ABC pattern
Argument #4 - The above mentioned Gartley pattern (I wrote a post on that) has been completed
Argument #5 - last but not least - the price returned exactly on Fibonacci Retracement 161.8 of the most recent correction to the up-movement starting on Sep 30th 2024.
Those argument create a massive Resistance Cluster at 1.17500 - 1.19600.
Altogether I have six argument to believe the local uptrend on EURUSD simply expired. But of course I may be absolutely wrong and EUR will go up from where it is now.
Just my humble opinion

F | Possible 3 Year Long Consolidation Over | LONGFord Motor Co. engages in the manufacture, distribution, and sale of automobiles. It operates through the following segments: Ford Blue, Ford Model E, Ford Pro, Ford Next, Ford Credit, and Corporate Other. The Ford Blue, Ford Model E, and Ford Pro segment includes the sale of Ford and Lincoln vehicles, service parts, and accessories, together with the associated costs to develop, manufacture, distribute, and service the vehicles, parts, and accessories. The Ford Next segment is involved in the expenses and investments for emerging business initiatives aimed at creating value for Ford in vehicle-adjacent market segments. The Ford Credit segment consists of the Ford Credit business on a consolidated basis, which is primarily vehicle-related financing and leasing activities. The Corporate Other segment refers to corporate governance expenses, past service pension and OPEB income and expense, interest income and gains and losses from cash, cash equivalents, and marketable securities, and foreign exchange derivatives gains, and losses associated with intercompany lending. The company was founded by Henry Ford on June 16, 1903 and is headquartered in Dearborn, MI.

NIFTY Analysis for 01st Nov '25: IntraSwing Spot & FUT levels✍🏼️ "Future IntraSwing Levels" mentioned in BOX format.
✍🏼️ "WEEKLY Levels" mentioned in BOX format.
[ Level Interpretation / description:
L#1: If the candle crossed & stays above the “Buy Gen”, it is treated / considered as Bullish bias.
L#2: Possibility / Probability of REVERSAL near RLB#1 & UBTgt
L#3: If the candle stays above “Sell Gen” but below “Buy Gen”, it is treated / considered as Sidewise. Aggressive Traders can take Long position near “Sell Gen” either retesting or crossed from Below & vice-versa i.e. can take Short position near “Buy Gen” either retesting or crossed downward from Above.
L#4: If the candle crossed & stays below the “Sell Gen”, it is treated / considered a Bearish bias.
L#5: Possibility / Probability of REVERSAL near RLS#1 & USTgt
HZB (Buy side) & HZS (Sell side) => Hurdle Zone,
*** Specialty of “HZB#1, HZB#2 HZS#1 & HZS#2” is Sidewise (behaviour in Nature)
Rest Plotted and Mentioned on Chart
Color code Used:
Green =. Positive bias.
Red =. Negative bias.
RED in Between Green means Trend Finder / Momentum Change
/ CYCLE Change and Vice Versa.
Notice One thing: HOW LEVELS are Working.
Use any Momentum Indicator / Oscillator or as you "USED to" to Take entry.
⚠️ DISCLAIMER:
The information, views, and ideas shared here are purely for educational and informational purposes only. They are not intended as investment advice or a recommendation to buy, sell, or hold any financial instruments. I am not a SEBI-registered financial adviser.
Trading and investing in the stock market involves risk, and you should do your own research and analysis. You are solely responsible for any decisions made based on this research.
"As HARD EARNED MONEY IS YOUR's, So DECISION SHOULD HAVE TO BE YOUR's".
Do comment if Helpful .
In depth Analysis will be added later (If time Permits)

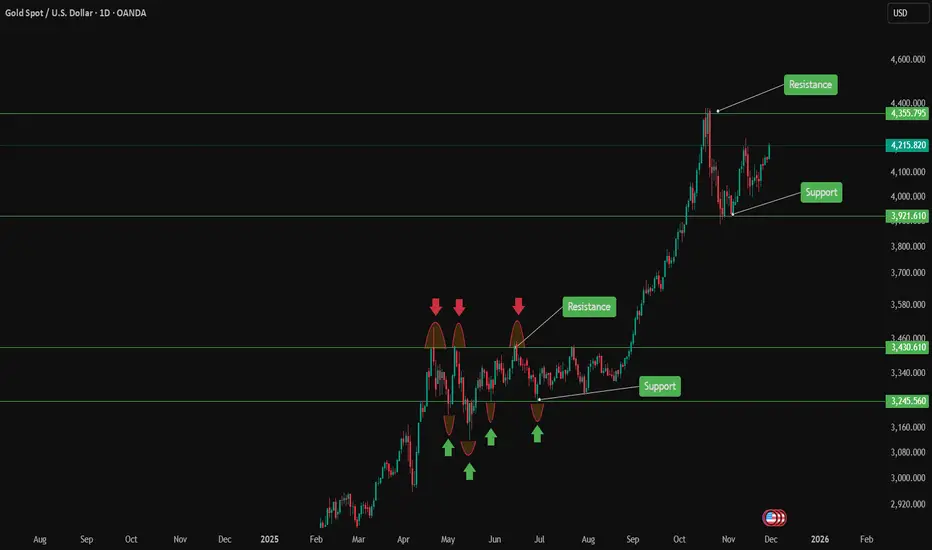
Unlock Hidden Trading Edges: Master Support & Resistance Levels Master Support & Resistance Levels – The Most Powerful Tool in Technical Analysis 📈🔥
Support and Resistance (S&R) are the foundation of price action.
Support = where price tends to stop falling (buyers step in) 🛡️
Resistance = where price tends to stop rising (sellers take control) ⚔️
These levels are not always exact, but when used correctly they give you high-probability entries and exits in Forex, Crypto, and Stocks.
How to Find Strong S&R Levels:
1-Look left → Previous swing highs & lows
The more times price has touched and bounced, the stronger the level becomes.
2-Round numbers & psychological levels
Examples: $50,000 BTC, 1.2000 EUR/USD, $200 AAPL – traders love these!
3-Use TradingView tools
Horizontal Line
Fibonacci Retracement (38.2%, 50%, 61.8%)
Volume Profile (High-volume nodes often act as S&R)
2Role Reversal – The Magic Trick ✨
Broken resistance → becomes new support
Broken support → becomes new resistance
This is where the big moves start!
Real Examples Right Now:
Bitcoin → $100,000 break support → now strong resistance
Pro Tips:
Always check multiple timeframes (Daily + 4H give the strongest levels)
Combine with RSI or volume for confirmation
Place stop-loss just below support / above resistance
When a level breaks with high volume → jump on the breakout!
Start drawing your S&R levels today and watch your win rate improve instantly.
Which market are you trading right now? Drop your favorite S&R level in the comments! 👇
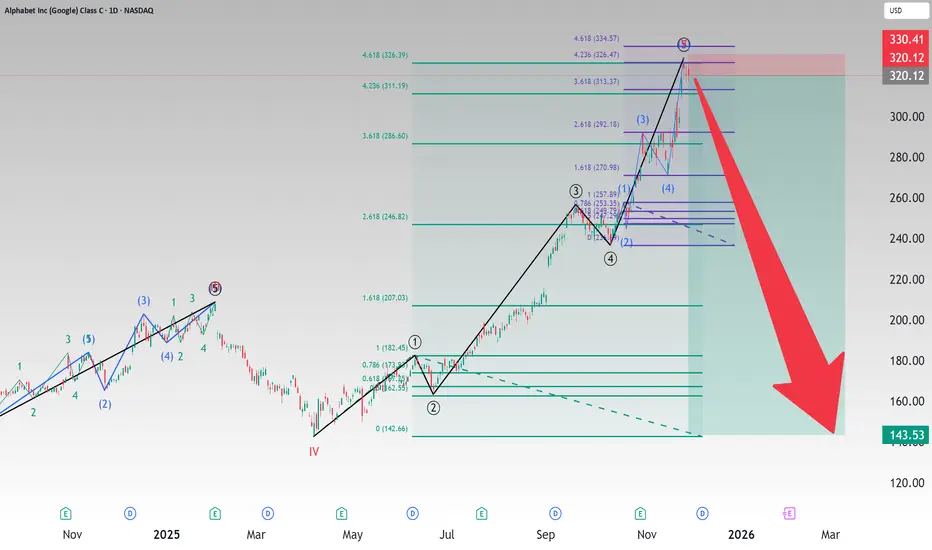
Google Short: 5-waves completion with Fibonacci ExtensionsOver here, I want to discuss the possibility that Google has peaked. I know that I am going against Berkshire Hathaway. But then, we can really confirm if the latest decision is really made by Warren Buffett given that he has also recently announced his retirement? And Charlie Munger is no longer with him.
Of course, I've always given my analysis based on Wester TA (chart patterns), Japanese TA (Candlesticks), and Elliott Waves. And over here, I present to you the potential 5-waves that might have completed on Google. And that is supported by 2 Fibonacci extensions:
1. From Primary Wave 1 across the entire wave, and
2. From Intermediate Wave 1 of 5 across entire Primary Wave 5.
But these are not certainties but probabilities and most importantly, risk-reward.
For this idea, the stop is most important: slightly above the All-time-high: $328.67. I would say that you can put the stop at $329 or $330. If Google goes beyond and makes new ATH, then this idea can be trashed.
The take profit is at the previous wave 4 of a higher degree, or the low made on 7th April 2025: $142.66.
Good luck!
Silver Juniors Basket – Potential 100% Collective Move?The basket includes six silver juniors (OCG, MTH, KTN, SVRS, SSV, DEF). All are focused on silver-dominant projects, primarily in Mexico and Colombia. Most are at the discovery and development stages, with long histories dating back to previous silver cycles. Market caps are in the 70–180M USD range – large enough to be investable for institutions, but still small enough to offer high leverage to a rising silver price. None are major producers, which means cash flow is limited, but the trade-off is greater upside torque if silver enters a strong bull phase.
Technical Highlights
Base formation (2022–2025): multi-year consolidation with rising volumes, now breaking out.
Downtrend line from 2011: currently being tested. A decisive breakout here would mark the end of a 14-year bear market structure for this basket.
Measured move of the accumulation pattern points to ~100% upside from current levels.
Fibonacci retracements from the 2020 high: a 100% collective rally coincides almost exactly with the 0.5 retracement level – a major technical magnet.
Distance % from 36-week SMA: currently ~40, while historical cycle peaks reached 110–120. This suggests substantial room for extension.
RSI (weekly): shifting from a bear-range (<50) to a bull-range (>60).
Volume: the strongest since 2011, confirming renewed institutional interest.
Trade Idea
This basket represents a high-beta silver leverage play. With silver itself testing major breakout levels, these juniors could collectively deliver a ~100% move into the 0.5 Fib retracement zone.
But the more important perspective: when a decade-long trendline finally breaks, the move often transcends Fibonacci levels and becomes a structural reset. Historically, silver juniors have not stopped at 0.5 retracements – they have delivered multiples of returns once momentum truly takes hold.
In that sense, 100% may only be the “first stop”, not the destination.

EURUSD Mid-term analysisGiven the upward movements of the Euro in the last month of the year, I expect an upward move, but since we were up last week, we need a corrective wave for long trades. So you can look for a long trade setup on lower time frames after the price corrects below 1.15500.

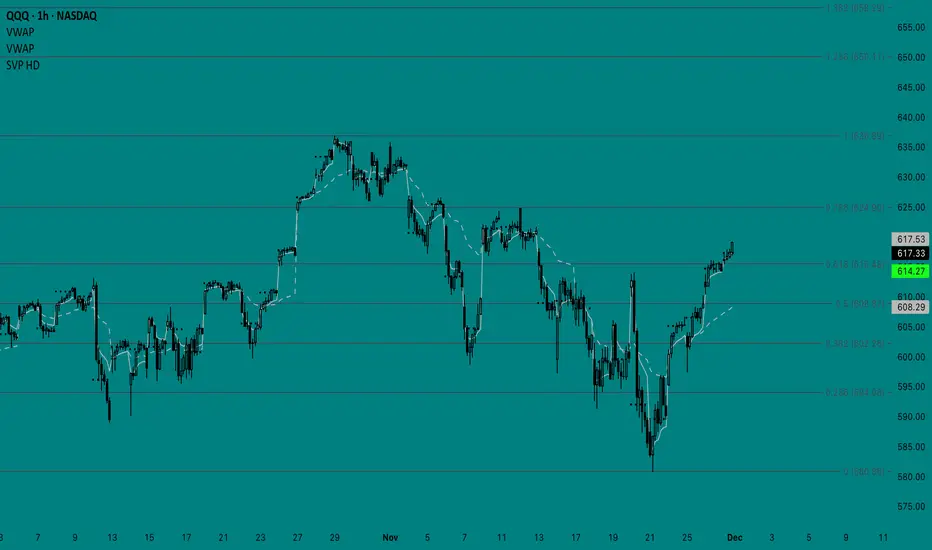
Small Caps Are Entering Their Next Expansion PhaseThesis
Small caps have materially lagged the broader market for two years while capital crowded into mega caps and AI leaders. That phase is now ending. The macro backdrop is shifting, and the price structure across the higher timeframes shows the early development of a new expansion cycle.
Macro Backdrop
Rate cuts are expected as inflation cools and growth stabilizes. Small caps benefit more than any other equity class when financing costs fall because they carry higher leverage and have shorter debt cycles. Lower rates directly lift margins and earnings outlooks.
Foreign investment flows into the United States remain strong. Over the past year most of that flow was absorbed by a handful of large names. When that segment becomes extended, capital naturally rotates down the market cap ladder. This is the exact setup taking place now.
Earnings across smaller companies have quietly turned higher. Revenue revisions have stabilized, and cost pressure is easing. With rate relief approaching, profitability spreads improve faster in small caps than in large caps. Historically this combination of improving fundamentals plus easing financial conditions has led to multi-quarter outperformance.
Technical Structure
The weekly chart shows price breaking above the entire cluster of prior compression bands with multiple strong candles closing above them. That type of reclaim typically marks the beginning of a new trend phase rather than a temporary bounce.
On the same chart, the volume footprint is rising and shows persistent accumulation since the 2024 low. The upward sloping volume trendline confirms steady demand through every pullback.
The multi-wave momentum structure on the weekly chart has flipped from contraction into expansion. This shift generally occurs in the early stage of broader moves that last several months.
On the 3-day chart, price is firmly holding above its prior consolidation zone. Each corrective dip has been absorbed at higher levels, showing strong underlying demand. The volume trend on this timeframe also remains upwards, matching the weekly structure and confirming healthy participation.
Momentum on the 3-day chart mirrors the weekly: prior downside pressure has faded, and the bars are now expanding upward. That is the same setup seen before longer upside cycles in past rotations.
The daily chart provides the clearest confirmation. Price reclaimed multiple stacked levels in one impulsive leg, along with one of the strongest volume days in over a year. Pullbacks have been shallow and immediately bought. There are no signs of distribution.
Overall Structure
Large caps have already completed their expansion wave. Small caps have not. With rate cuts approaching, foreign capital still flowing in, and earnings momentum turning positive, the fundamental and macro drivers now favor small caps.
The multi-timeframe price structure aligns with that backdrop:
Reclaims across all higher timeframes
Expanding momentum after long contraction
Persistent accumulation on volume
No distribution signals on the daily
This is exactly the type of setup that precedes multi-month rotation into smaller names. Small caps remain the last unfinished leg of this cycle, and conditions are in place for that rotation to continue.
Bearish risk remains in a lower high and OBV failing its underside retest

GBPUSD 4HEverything points to a flat. Wave B has retraced 90% of A. Target C = 1.618b of A.
Have fun with Elliott wave.

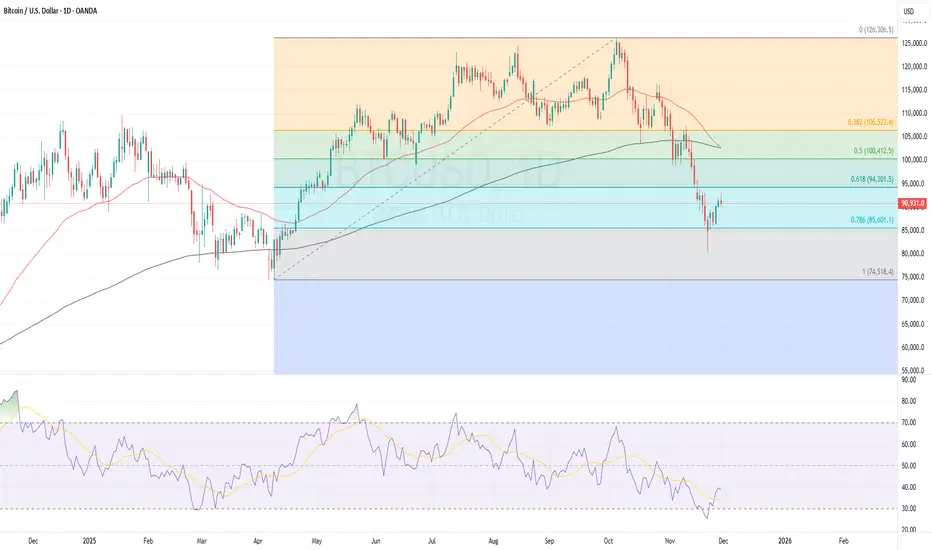
BTCUSD trading set up with Fibonacci RetracementBitcoin's recent decline since mid-October formed a very deep correction, bouncing sharply off the 0.786 Fibonacci Retracement level on the 1D chart.
Key Points
Deep Retracement : The 0.786 level represents a severe test of the prior uptrend's strength. The bounce confirms this as a major support zone, but the depth suggests significant underlying weakness or exhaustion of bullish momentum.
Immediate Target : The price is now challenging the crucial 0.618 Fibonacci level. This "Golden Ratio" acts as the primary technical resistance. A successful break above it is necessary to confirm a potential trend reversal and resume the larger upward move.
Macro Impact (The Fed) : The upcoming USD interest rate decision is the major external catalyst.
Dovish Outcome (Rate Cut/More Cuts Expected): Likely bullish for Bitcoin, increasing liquidity and risk appetite, potentially helping it break 0.618.
Hawkish Outcome (Rate Hold/Tightening Expected): Likely bearish, reducing liquidity and making it difficult for Bitcoin to hold above the $0.786$ support.
The market is at a critical technical resistance (0.618) coinciding with a major macroeconomic event. The Fed's decision will likely dictate if the 0.786 bounce holds, or if the deeper correction continues.
DVN | Strong Oil & Nat Gas Producer About to Pop | LONGDevon Energy Corp. engages in the exploration, development, and production of oil and natural gas properties. It develops and operates Delaware Basin, Eagle Ford, Heavy Oil, Barnett Shale, STACK, and Rockies Oil. The company was founded by J. Larry Nichols and John W. Nichols in 1971 and is headquartered in Oklahoma City, OK.

OB + RSI + MSS = WIN CME_MINI:MES1!
Today, I will present a large part of my strategy using three excellent example trades. It consists of various (SMC) concepts that I have combined.
Entry:
First, I look for an OB, BB, hidden divergence or liquidity sweep on the 1-hour chart. Then I go to the 15-minute and 5-minute TF and look for further RSI divergences, SMT divergences or OBs as confirmation and wait for an MSS.
(Important for hidden divergence: only enter after confirmation and leaving the divergence zone)
Take profit:
I set my take profit depending on the situation. Either just before a liquidity pool or on the Fibonacci extension zone 1 or just before zone 1.618.
Stop loss:
I set my stop loss just behind the OB or the candles of the RSI divergence zone, whereby I must achieve a CRV of at least 3 for each trade.
Feel free to give me feedback on my system and ask me questions!
Shoutouts to @Sirc255 through who I came upon RSI!

ETH — Using Fibonacci for High-Precision TradingUnderstanding Tools, Confluence & Today’s Setup
I’ve been getting a lot of DMs asking what the best indicator is.
The truth? There is no universal “best indicator” because indicators are tools, and every tool serves a different purpose. Trading is like carrying a toolbox: the skill isn’t in having the tools, but in knowing when and how to use them.
Educational Segment: Why Fibonacci Should Be Your Foundation
After years of studying different systems, I’ve come to a very simple conclusion:
👉 Fibonacci tools are the most powerful and reliable in my entire arsenal.
Why?
They help you spot reversal zones with precision
They work across all market conditions
They are rooted in natural ratios that markets consistently gravitate toward
They create predictable targets, retracements, extensions, and even timing when used correctly
Indicators like oscillators etc. are best used as confirmation, not as the primary signal.
If I had to pick one indicator besides Fibonacci, it would absolutely be the VWAP.
Why the Anchored VWAP Is Incredibly Underrated
It shows where true volume-weighted market support + resistance lies
It adapts dynamically
It works extremely well as a dynamic support/resistance line
It is fantastic as a trailing stop-loss tool
It helps identify institutional footprints in price structure
Fibonacci + VWAP is one of the strongest forms of confluence you can build.
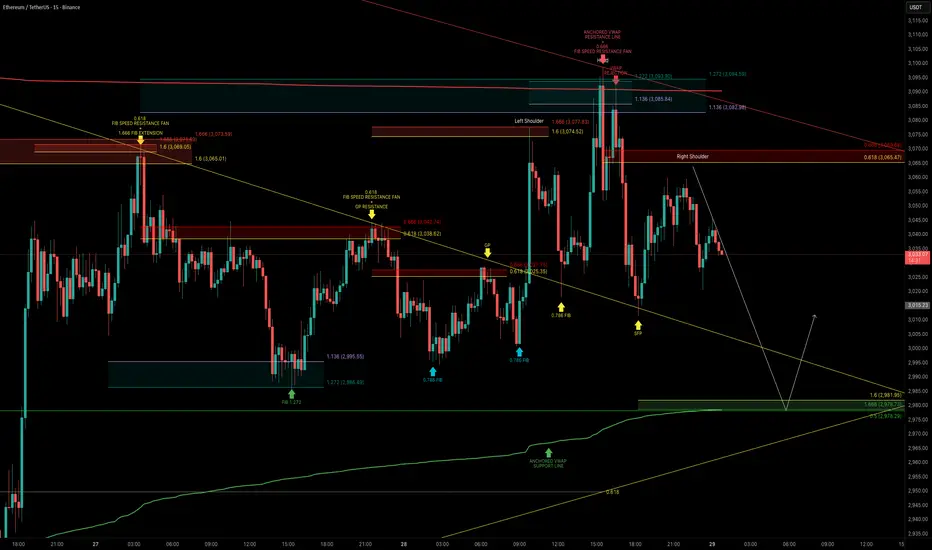
ETH Technical Breakdown
Today, ETH attempted a breakout but the move failed, and the rejection was clean.
ETH rejected at the anchored VWAP aligned with Fibonacci reversal zone:
ETH tested the anchored VWAP near $3,090 twice, coinciding with the 1.136–1.272 Fibonacci Reversal Zone.
This confluence acted as a strong resistance, leading to a swift selloff soon after.
Key Confluence Level Below:
My next major downside target lines up with a cluster of confluences:
1.6-1.666 Fibonacci extension
0.5 Fibonacci retracement
Anchored VWAP (green support line)
Liquidity zone (demand area)
0.618 Fibonacci speed fan support
Educational Takeaway → Confluence Is King
If there’s one lesson to internalize:
The more factors that align at the same level or zone, the higher the probability of a successful trade.
This ETH range has provided several high-quality setups for anyone who understands how to read price through Fibonacci.
Final Notes
ETH remains in a well-defined trading range use confluence, stay patient, and let the market come to your level.
_________________________________
💬 If you found this helpful, drop a like and comment!