NQ Power Range Report with FIB Ext - 1/20/2026 SessionCME_MINI:NQH2026
- PR High: 25405.00
- PR Low: 25367.25
- NZ Spread: 84.25
No key scheduled economic events
High volume open following holiday weekend
- Weekend gap down ~1.0% remains open
Session Open Stats (As of 12:55 AM)
- Session Open ATR: 356.37
- Volume: 201K
- Open Int: 269K
- Trend Grade: Long
- From BA ATH: -3.8% (Rounded)
Key Levels (Rounded - Think of these as ranges)
- Long: 26521
- Mid: 25264
- Short: 24008
Keep in mind this is not speculation or a prediction. Only a report of the Power Range with Fib extensions for target hunting. Do your DD! You determine your risk tolerance. You are fully capable of making your own decisions.
BA: Back Adjusted
BuZ/BeZ: Bull Zone / Bear Zone
NZ: Neutral Zone
Fibonacci

GMR Power — Extended Wave-3, Contracting Wave-4… Resolution📉 GMR Power & Urban Infra — Weekly Context and Daily Wave-4 / Wave-5 Structure (Elliott Study)
This publication presents an educational Elliott Wave structure study 📚 using the Weekly timeframe for the overall market context and the Daily timeframe to analyse the ongoing Wave-4 correction , its probable termination area, and the conditional Wave-5 projection .
On the Weekly chart , GMR Power shows a clear impulsive advance from the 2023 base into the ₹169.25 region , labelled as Wave-(3) . Fibonacci extension analysis shows that this move exceeded the 3.618 extension and approached the 4.0 level , confirming that Wave-3 is the extended wave . After this peak, price behaviour shifted from strong trending action to overlapping and corrective movement , signalling the development of Wave-(4) .
On the Daily chart , Wave-(4) is unfolding as a contracting triangle (A–B–C–D–E) 🔺. Each leg is corrective and overlapping, volatility has contracted, and momentum has faded. This behaviour is typical of a Wave-4 triangle following an extended Wave-3 , where the market corrects more through time than price ⏳.
From a structural and Fibonacci perspective 📐, the Wave-E termination zone is identified between approximately ₹85–95 . This region aligns with the 0.618–0.786 retracement band of the prior advance. In Elliott Wave studies, Wave-E of a triangle often resolves quietly and may not show a dramatic breakdown, which matches the current behaviour.
Because Wave-3 is extended , Elliott alternation principles suggest that Wave-5 is more likely to be contracted rather than extended . Therefore, Wave-5 expectations are best framed using triangle thrust measurement and reduced Fibonacci relationships to Wave-1 , rather than equality or extension relative to Wave-3.
Using these methods, the primary Wave-5 reference zone lies in the ₹120–140 region . A move toward the ₹160–170 area would be considered a lower-probability stretch scenario and would require clear impulsive behaviour and momentum expansion. A truncated Wave-5 remains possible but is not the base expectation.
This study focuses on structure, probability, and wave behaviour 🧠 rather than prediction. Discussion of Wave-5 becomes relevant only after the triangle completes and price clearly transitions from corrective overlap to impulsive movement .
This publication is shared strictly for educational and analytical discussion 📚⚠️ and does not constitute investment advice.

EURJPY Wave Analysis – 19 January 2026
- EURJPY reversed from support zone
- Likely to rise to resistance level 185.30
EURJPY currency pair recently down from the support zone between the support level 182.70 (low of the previous minor correction iv) and the lower daily Bollinger Band.
This support zone was further strengthened by the 50% Fibonacci correction of the sharp upward impulse from December.
Given the clear daily uptrend, EURJPY currency pair can be expected to rise to the next resistance level 185.30 (which reversed the price earlier this month).

Gold Prep for $5,000 -- Q1 2026Based on Gold's macro Elliott Wave structure, the pending new all-time high near $5,000 is likely to unleash the most magnificently tremendous episode of bear power ever witnessed in Gold's history.
The elders, boomers, OGs, etc. are likely preparing to migrate to crypto. I believe this is the quiet part that institutions and media is not saying out loud. Then again, this idea of a catalyst is totally speculation.
The chart is more of a science.

ETH/USDT 4H chart🧭 Trend Context
• Main Trend: Up – clear HH/HL breakout.
• Price respects the uptrend line (orange).
• The last upward impulse was very strong (dynamic breakout to ~3400).
⸻
📊 Key Horizontal Lines
🔴Supports
• 3188–3200 – local support + prior S/R flip
• 3130 – strong structural support
• 3052 – last line of trend defense (critical)
🟢 Resistances
• 3232 – current resistance (price reaction now)
• 3317 – important resistance/consolidation
• 3404 – high impulse (local ATH)
⸻
📐 Price Structure
• The drop from ~3360 to ~3188 looks like an impulse correction, not a trend reversal.
• Currently, the price:
• has rebounded from support
• is above the trend line
• is fighting against 3232
👉Into the decision zone.
⸻
📉 Stochastic RSI
• Was oversold (0–20)
• Now retracing upward
• Potential for an uptrend, but no confirmed breakout
⸻
🔮 Scenarios
✅ Baseline scenario (bullish – more likely)
Conditions:
• Hold >3188
• Breakout and 4-hour close above 3232
Targets:
• 3317
• 3400–3420
⸻
⚠️ Corrective scenario
If:
• Rejection from 3232
• Reversion to the downtrend
Targets:
• 3188
• 3130
• Extreme: 3050 (still uptrend)

MUGHAL Technical Outlook MUGHAL – Swing Idea
The stock has taken strong support from the Fibonacci golden zone.
RSI is stable and the overall price structure remains bullish, indicating that the recent pullback looks healthy rather than a trend reversal.
CMP and the 101–98 zone remain active for buy-on-dips.
Stop Loss (closing): 95
Targets: 109 – 115 – 123 – 129
This is a trend continuation setup — patience can lead to better rewards. 📈
Analysis for educational purposes only.

Star Cement — The Quiet Phase Before the Next Big Move?📉 Star Cement — Primary Wave-4 & Wave-5 Context (Elliott Wave Study)
This post is an educational Elliott Wave structure study 📚 based on the current weekly and daily chart of Star Cement.
Star Cement completed a strong multi-year advance 🚀 from the 2022 lows, peaking near the ₹308–310 region . This advance shows classic characteristics of a Primary Wave-3 , including strong momentum, broad participation, and a terminal phase near the highs.
After the peak, price behaviour shifted from trending to overlapping and corrective , suggesting the market has transitioned into a Primary Wave-4 phase . Among the common corrective patterns, a Flat (A-B-C) structure currently best explains the price action.
Within this interpretation, Wave A declined from ~₹308 to ~₹245 and showed overlapping characteristics rather than a clean impulse. Wave B retraced weakly toward ~₹270 and lacked impulsive strength, which is typical behaviour within flat corrections. Wave C is currently unfolding with overlapping internal swings and reduced momentum, supporting the view that this is a corrective decline rather than the start of a new impulsive downtrend.
From a structural and Fibonacci perspective 📐, the chart highlights a broader confluence area between ₹195 and ₹205 , corresponding to the 0.618 retracement of the entire Primary Wave-3 and the 1.272 extension of Wave A. An extended confluence area is also visible around ₹185–190 , near the 0.786 retracement of Primary Wave-3. These zones are presented purely as areas of analytical interest where flat corrections often mature, not as signals.
In educational terms 🎓, a Flat-C phase typically ends quietly rather than dramatically . Behaviour consistent with a maturing correction would include price stabilising within the ₹185–205 zone , smaller and overlapping candles, failed breakdown attempts with quick recoveries, and the emergence of a clean directional move away from the zone. In contrast, continuation of the correction would be suggested by impulsive downside expansion below ~₹185 , increasing range and volume on declines, and weak rebounds that remain capped below prior resistance zones.
The projected Primary Wave-5 🔵 (shown in blue on the chart) is included strictly for higher-degree context. Wave-5 scenarios are only studied after Wave-4 has fully resolved and the structure transitions from corrective to impulsive. Historically, Primary Wave-5 advances tend to be more selective, often shorter than Wave-3, and occur only after prolonged consolidation or correction. The Fibonacci extension zones associated with Wave-5 are theoretical reference levels that illustrate how analysts frame potential future paths, not expectations.
At this stage, Star Cement remains in a Primary Wave-4 corrective environment . The focus is on observing structure, momentum, and confirmation rather than anticipating outcomes 🧠. Higher-degree trend continuation can only be discussed after the correction completes and the market clearly proves a change in behaviour.
📉 Star Cement — Blue Wave-4 on Daily Timeframe (Elliott Study)
After the advance into the ₹308–310 zone 🚀, price behaviour shifted from trending to overlapping and corrective , marking the development of blue Wave-4 on the daily chart. This phase is characterised by segmented declines , frequent counter-trend bounces, and fading momentum , rather than impulsive selling.
Blue Wave-4 is interacting with a key ₹195–205 confluence zone 📐, with a deeper reference near ₹185–190 , areas where corrective waves often stabilise. Wave-4 corrections typically resolve quietly through time and overlap ⏳, not sharp reversals.
This study is shared strictly for educational and analytical discussion and does not constitute investment advice ⚠️.

BITF | This BTC Miner Will Pop | LONGBitfarms Ltd. (Canada) engages in the business of mining cryptocurrency. The firm is also involved in the ownership and operation of server farms comprised of computers designed for the purpose of validating transactions on the Bitcoin blockchain. The company was founded by Emiliano Joel Grodzki and Nicolas Bonta in 2017 and is headquartered in Toronto, Canada.

KSE 100, 1D - Probable projectionsKSE 100, 1D
Probable projections
190,000
193,000
199,000
Support: 185,000
Arsalan Anwer
Stags

The Silver Bullet
Silver is back on the rise and showing increasingly strong bullish momentum despite the numerous large accounts on social media trying to pin the top and boast short entries that are currently suffering severely.
On 10/29/24 I described a breakout move occurring where price would see an initial rejection of the $53-$57 range before exploding to a target range of $79 and $132. I don't care to explain where these levels are derived from in great detail in order to preserve a part of my edge through a unique application of Fibonacci.
Aside from the 2.618 @ $132.01 being primary target at this stage in the parabola:
Special interest to the $108-$110 range just ahead here upon break of $96.72. Method implies the next intermediary rejection and reconsolidation begins there, with true support laying at $79.81 in the event of a rejection.
Good luck!

BABA: holding the mid-term support NYSE:BABA price is still holding the mid-term support zone outlined in the October update (see "previous" section bellow) and continues to act constructively. The structure suggests a potential start of a new uptrend toward the next target resistance zone at 205–230.
Chart:
As long as price holds above 155 in the short term and above the January lows, I am expecting the right-hand side of a new base (from the October highs) to form, with price following through toward 200+.
Previously:
• On macro support (Jun 24):
www.tradingview.com
• On potential upside reversal (Jul 15):
www.tradingview.com
• On support and bullish corrective structure (Aug 19):
www.tradingview.com
• On bullish structure (Aug 29):
www.tradingview.com
• On mid-term support (Oct 13):
www.tradingview.com

EURUSD - Can the 0.382 - 0.5 Fib & Trendline Save the Bulls?We are currently seeing a critical setup on the Euro/Dollar daily chart. After a correction from the recent highs, price action has arrived at a major decision point.
Here is the technical reasoning behind this setup:
Trendline Support: The pair is testing a long-term ascending trendline (yellow line) that has been respected since the start of the trend. A bounce here keeps the macro uptrend intact.
Fibonacci Confluence: The price is currently sitting right on the 0.5 Fibonacci retracement level. This level lines up perfectly with the trendline, creating a "confluence zone" of support.
The Green Zone: As highlighted in the shaded box, there is previous structural support in this area (between the 0.382 and 0.5 Fibs) where buyers have stepped in before.
RSI Context: The RSI (bottom pane) has cooled off significantly from the highs and is approaching the lower range, suggesting the selling pressure might be nearing exhaustion.

FUTU: watching for more downsideNASDAQ:FUTU as long as price is holding below the Jan lower highs at 190, I am watching for further downside into 140–135 and potentially 130–120 as part of a mid-term top formation.
Chart (daily):
From a larger-degree perspective, the upside trend from the 2022 lows (see long idea from Dec 2023: ) may have topped, with price now unfolding its first wave of decline. This remains my primary scenario as long as price continues to close below the 190 level.
Chart (larger-degree view):
Alternatively, if price is able to hold — i.e., does not break down below the 153 level — and subsequently breaks out and holds above 190 in the coming weeks, the odds would shift toward a more bullish scenario with upside extensions into the 235–265 zone.
Chart:

FUTU: strong potential for 2024FUTU reached the upper zone of mid-term 52-45 support range and is trying to find a footing.
I like the gap-up with substantial volume today. Re-claiming the 50d moving average would be a constructive next step in shifting the odds of important bottom in place.
Otherwise, if 50.28 level will not hold, next support levels are: 49-45.
Suggested price structure is in-tact until price holds above 40.90 level.
Fundamentally solid with strong sales and earnings growth 4qrts in a row, high EPS growth estimates for 2023 and decent 2024, could be a perspective growth candidate to outperform the markets in 2024 (in favourable environment).

GOLD Weekly Divergence
Massive Divergence on the Weekly
Followed by a liquidity sweep pull back.
Price should drop now.
Weekly Chart showing divergence on RSI for confirmation
Price then made a pull back and took out the liquidity at the previous High. This took 2 weekly candles to happen. Following the principle : "The First Move is NOT the Real Move" the rejection made by the wick from that frist weekly candle following is not the real move. So we wait on the second weekly candle to clear the high of the previous weekly candle wick. Only then can we look for sells.
Our target T.P will be 50% of the most recent Order Block shown on the weekly chart.

UMAC: when unusual machines start printing moneyUnusual Machines operates in a high-risk, niche technology segment driven by speculative demand and rapid capital rotation. Recent attention to the stock has increased sharply due to volume expansion and growing market interest. This is not a value-driven story but a momentum-driven one, where price behavior and liquidity flows dominate decision-making. Such stocks are often used by funds and traders during risk-on phases to accelerate returns through volatility.
Technically, UMAC has broken out from a long accumulation base and confirmed a structural trend shift. Price is holding above the key 0.618 Fibonacci level, signaling strong bullish control. The current structure resembles post-breakout consolidation with continuation potential. The primary scenario targets 26.1 and 39.3 based on Fibonacci extensions, provided price holds above the 17.5–18.0 zone. An alternative scenario allows for a pullback toward 12.8–13.0, which may act as a re-entry support zone. CCI remains in positive territory, confirming sustained momentum.
When markets reward risk, stocks like this do not move quietly. They move fast, and they move without apology.

2026-01-19the move is just ranging at the moment , not much to do
there is no volume at the moment , it's a bank holiday

SUI, volatile, but local uptrend intactCRYPTOCAP:SUI
🎯Price printed a 3 white knight bullish engulfing pattern, reclaiming the daily pivot, now being tested as support. Wave 2 of a new uptrend appears to be underway. Wave 3 has a first target of the daily 200EMA, followed by $3.1
📈 After negating the bearish divergence, daily RSI has unconfirmed hidden bullish divergence forming.
👉 Analysis is invalidated below $1.31, keeping the downtrend alive
Safe trading

ONDO, rekt, fresh low...LSE:ONDO
🎯Price printed a 3 white knight bullish engulfing pattern, jumping above the daily pivot before being rejected hard to fresh lows, keeping the downtrend intact. The 0.786 Fibonacci retracement has been penetrated as price loses the High Volume Node support. S1 pivot is the next target, $0.3.
📈 Daily RSI is showing unconfirmed bullish divergence.
👉 Analysis is invalidated above $0.5 swing high.
Safe trading

HBAR, Bears in control, strong rejectionCRYPTOCAP:HBAR
🎯Price caught a strong bid on bullish divergence, but was rejected just as hard. Price is below the daily pivot and 200EMA, which is bearish, showing the downtrend is intact. The next downside target is the S1 pivot at $0.0893.
📈 Hidden bearish divergence played out at a High Volume Node. Bullish divergence is now forming, but unconfirmed.
👉Analysis is invalidated below the swing low, keeping wave 2 alive. We are very close to this level.
Safe trading

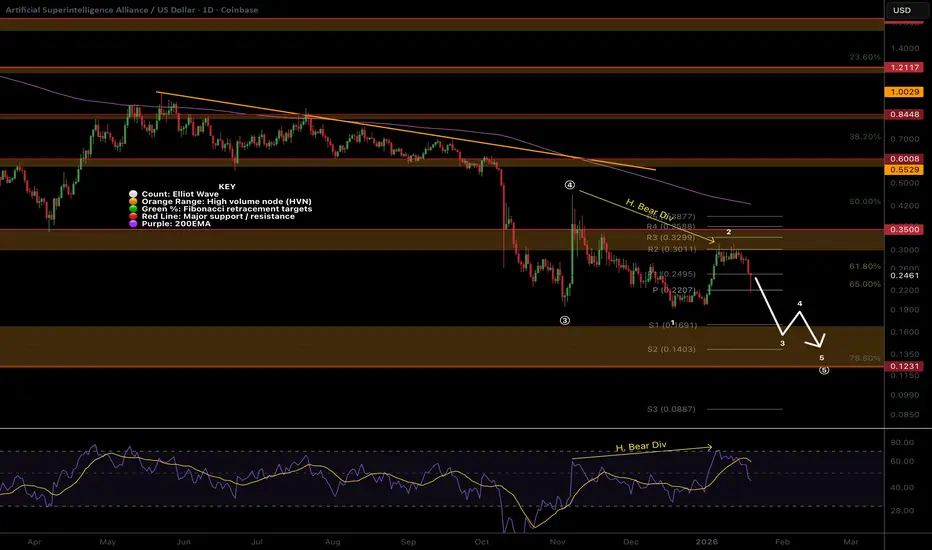
FET looking for new lows, downtrend in tact, h. bear divNYSE:FET
🎯The downtrend is intact, with wave 2 appearing complete. Wave 3 down is strong and hard. Price appears to want to continue lower to test the altCoin golden pocket at 0.786 Fibonacci retracement.
📈 Daily RSI went too high, too fast, and printed hidden bearish divergence at a High Volume node. The rejection was hard and swift.
👉 Analysis is invalidated above wave 2 swing high, $0.3.
Safe trading
ETH, trying to breakout, multiple attempts 200EMA and R1 pivotCRYPTOCAP:ETH
🎯Wave 1 appears to have completed a leading diagonal. Wave 2 appears complete with the recent higher low, but we need to break above wave 1 for confirmation. Price was rejected at the daily 200EMA and R! pivot, but is attempting to break through again. Overcoming this will be very bullish, especially as we are above the daily pivot.
📈 Daily RSI is printed hidden bearish divergence, followed by another bearish divergence. A move above wave (1) is essential to negate this, or prices could head to new local lows.
👉 Analysis is invalidated below wave (2)
Safe trading

DOGE, testing daily pivot as support, not much changed in a weekCRYPTOCAP:DOGE
🎯 Price printed a bullish engulfing 3 white knight candle pattern. It is above the daily pivot, yet testing as support. A critical level to hold. DOGE is still below the daily 200EMA. Overcoming this will be very bullish. The Elliot wave count remains tricky, so I will await more confirmation.
📈 Daily RSI printed bullish divergence, then negated the bearish divergence. The RSI shot up too hard and fast, which often results in a reversal. The reversal took place and tested the daily pivot as suggested last week.
👉 Analysis is invalidated below the swing low, keeping the downtrend alive
Safe trading
