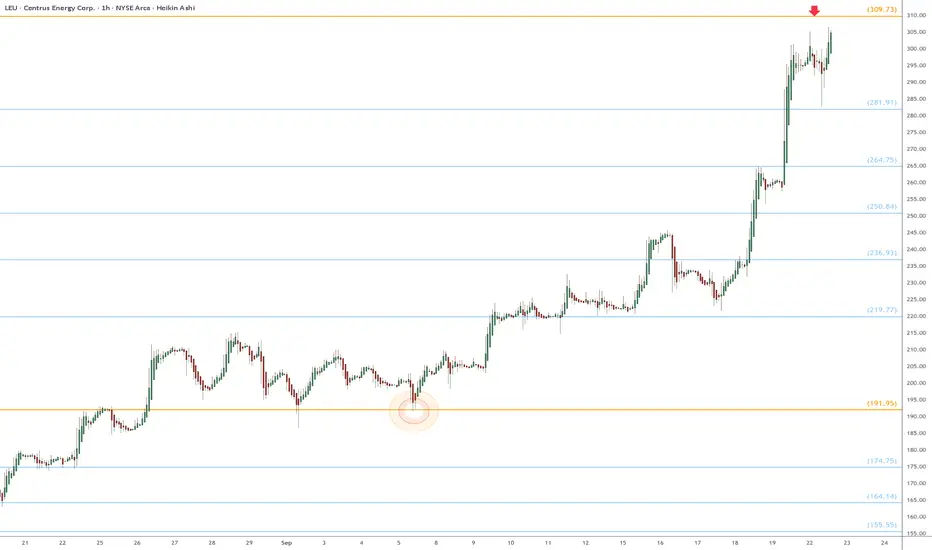
LEU eyes on $309.73: Golden Genesis fib should give a Dip-to-FibLEU has been flying off the last Golden Genesis at $191.95
Now barrelling full speed into sister Golden fib at $309.72
Taking some profits here, and look for a Dip-to-Fib to rebuy.
Fibonacci
FTSE 100 Wave Analysis – 20 October 2025
- FTSE 100 reversed from key support level 9330.00
- Likely to rise to resistance level 9600.00
FTSE 100 index recently reversed from the support area between the key support level 9330.00 (former strong resistance from August and September), 50% Fibonacci correction of the upward impulse from September and the lower weekly Bollinger Band.
The upward reversal from this support zone created the daily Japanese candlesticks reversal pattern Hammer.
Given the strong daily uptrend, FTSE 100 index can be expected to rise to the next resistance level 9600.00 (which stopped the previous impulse wave iii).

$BTC.D Death Cross Has Occurred! The Signal on ₿itcoin Dominance We've Been Waiting All Cycle For 🔥
20 / 50 WMA Death Cross has officially occurred on CRYPTOCAP:BTC.D
So close to Alt Season I can taste it 😋

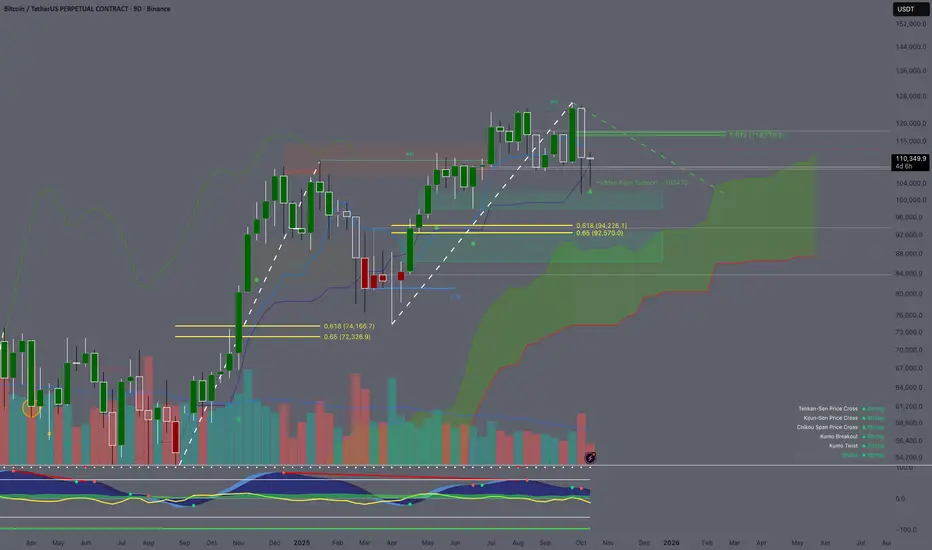
9D Timeframe Analysis using Ichimoku Cloud / Fib/ ICT
Price Action: The candle is pushing north and attempting to turn into a green candle. If the candle successfully turns green and creates a big long wick. The candle can be the support candle for this bullish. The candle won't be closed until this Friday night. Since the candle already discovered the south side and created long wicks. If the candle turns green we will experience the new discovery price on the north side.
Ichimoku Cloud: The price is currently trading above the Kijun-Sen ($109,454.3). If the price continues trading above this level. The trend is validated by the Kijiun-Sen. The Kijun-Sen sometimes plays a role such as a healthy pull back point where you can enter for a long position or a confirmation of a trend. The prices usually pulled back to this line after all time high. Price usually consolidated between (above/below) the lines before the pump in a bull market. The Kijin-Sen is also pushing upward which is a bullish sign but the Tenkan-Sen is flattened out. When the Tenkan-Sen is flat out, the price tends to trade sideways or we can say that the momentum has reduced. Cloud A is still shifting upward while Cloud B has flatted. Cloud A shifting upward means the momentum is still there but the current momentum which is the Tenkan-sen is flat.
Fibonacci: I drawed a fibonacci from $126208.5 to $101.516.5. The all time high point to the 20 billions liquidated event in crypto space. 1 candle made all time high and 1 candle flash crashed to the fair value gap. With the fibonacci, the 0.618 and 0.65 are showing $116,776.2 and $117,566.3. If the low range fib is the bottom then the price has to retrace back to 0.618 in others to continue the massive sell off. So this is playing a key level on the bears for short.
Fair Value Gaps (FVGs): There is a fair value gap when I draw a fip from the previous low in April to the all time high end of September. There is a fair value gap at the 0.65 fib level. Which shows that if the price is retraced back to that level. We are sill in the up trend in favor of the bull
Cipher B: The vwap is trading below money flow and momentum. The Money flow has flatted out while momentum is going down. This is not a good sign because the vwap is pointing south and trading below moneyflow which could lead to the consolidation. The consolidation is not always bad but shows that the trend is cooling down.
Key Levels: 0.618 from bull and bear. If the price is dropped to the fair value gap which is $94.226.1. The actual fair value gap at 0.65 not 0.618 but those levels go together. We will call 126208.5 the top. But if the price is defense above the Kinjun-Sen and does not retrace at the 0.618 from the high to the wick then we are not at the top yet.
Outlook: The change in Tenkan-Sen and Kijun-Sen. The shift of direction in those will be first noticed before anything other factors. Also price trading above/below/between those levels as well.
LAC heads up at $10.84: Golden Genesis fib may give a Dip-to-FibLAC has been flying with the rare-earth sector.
Now approaching a Golden Genesis fib at $10.84
Look for a Dip-to-Fib or Break-n-Retest to engage.

BTCUSD – Buy Plan from Key Order BlockBTCUSD is approaching a high-value Order Block . I’ll be looking for buy opportunities only if the price taps into the OB and forms a valid LTF bullish confirmation.
If the market fails to confirm, no trade will be taken.
No confirmation = No trade.
Patience until a proper internal liquidity sweep and confirmation setup appears.


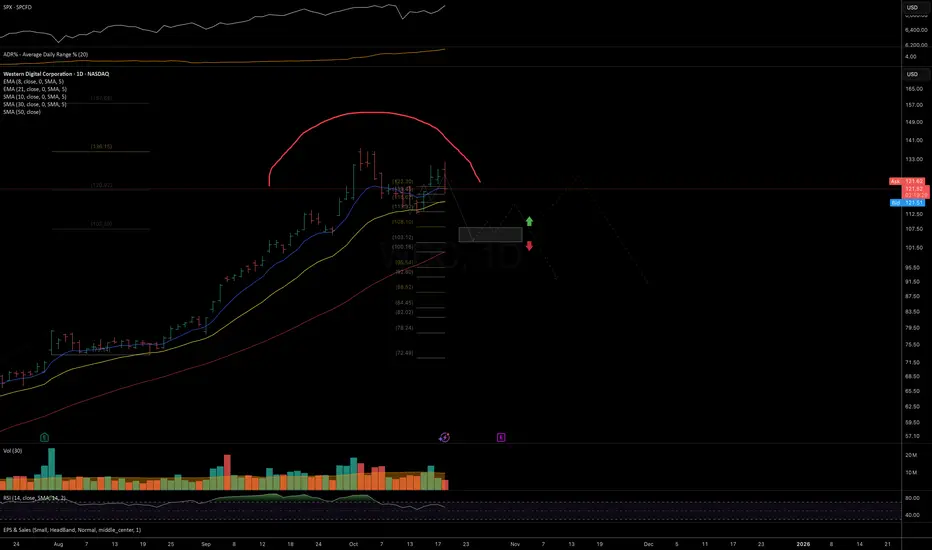
WDC: potential topping structurePrice continues to act in line with the trend structure suggested in the October analysis. As long as price remains below today’s low, I’m watching for downside continuation toward the 108–103 support zone in the short term, with potentially lower targets in the mid-term.
Chart:
Previously:
On downside potential (Oct 9):
Chart:
see in weekly review:
$TOTAL Crypto Market Cap Fights Back w/ Weekly CloseCrypto CRYPTOCAP:TOTAL Market Cap looking similar to CRYPTOCAP:BTC
Thankfully did not close outside of the Danger Zone.
It's absolutely imperative that Bulls reclaim the 20WMA this week and close above the .236 Fib
Losing the 20WMA has signaled more downside / sideways chop historically.
Hopefully this is just a fake-out, otherwise the 50% Gann will be retested alongside the 50WMA.

MU: price reached key mid-term resistance Price has shown strong follow-through from the support zone mentioned in the October update and has now reached the top of a key mid-term resistance area.
As long as price is closing below 219, I’m watching for selling pressure to start building and for a potential pullback toward the 160 area / rising 50-day MA.
Chart:
Previously:
• On resistance zone (Oct 3):
Chart:
www.tradingview.com
• On mid-term support (Sep 30):
Chart:
www.tradingview.com
• On pullback potential (Aug 12):
Chart:
www.tradingview.com
• On resistance (Aug 7):
www.tradingview.com
• On support zone (Jul 22):
www.tradingview.com
• On downside potential (Jul 15):
www.tradingview.com

$BTC Bulls Fight Back With Weekly CloseNot sure how I continue to amaze myself, but I do 🤓
Notice how those MMs respected my DANGER ZONE POI to the dollar?
Thankfully CRYPTOCAP:BTC did not close the Week outside the DZ.
The battle between Bulls and Bears is FIERCE 🔥
Bulls cannot afford another blue weekly close.
If so, the 50WMA retest ~102k will be inevitable.
Bulls need to reclaim and close this upcoming week above the 20WMA and .236 Fib
A close ~$116k would be super bullish.
That should be enough ammo to spark the long awaited parabola that UpTober has historically brought us.

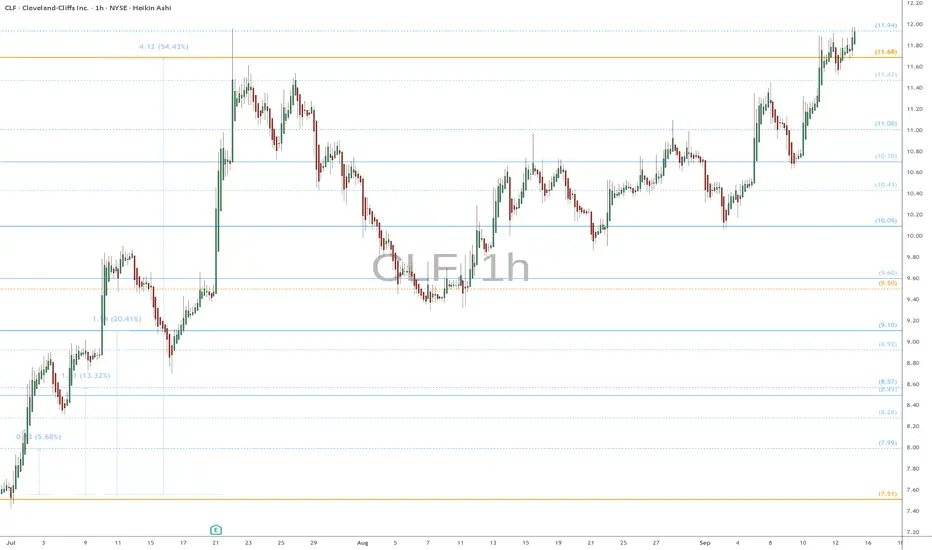
CLF watch $11.68: Golden Geneiss fib break shows major strengthCLF has make a round trip to a Golden Genesis fib at $11.68
This Golden Genesis marked the last top and stated retrace.
Now looks to be leaving orbit of this fib going for next leg up.
.
Last Plot that caught a < 54% > gain
Hit BOOST and FOLLOW for more such PRECISE and TIMELY charts.
========================================================
.
RBRK eyes on $76.30: Golden Genesis fib to HOLD or CRASHRBRK has been retracing from its AllTimeHigh.
Testing a proven Golden Genesis fib at $76.30
Looks like it will fail so looking at fibs below.
.
Previous Plot that called a PERFECT TOP:
Hit BOOST and FOLLOW for more such PRECISE and TIMELY charts.
=========================================================
.

$NVA Base BuildingTechnicals -
Short-term momentum - flat to slightly positive.
RSI (1-min) - 42 to 47 = climbing out of oversold.
MACD (1-min): nearing crossover.
Support - $54
Resistance -$55.8 and $56.7 (9 and 20 EMAs)
NVA is currently stabilizing around $55.1, holding above its morning low of $54.0 after a steep selloff from the mid-$60s. Volume has tapered sharply, showing that selling pressure has largely exhausted and short-term traders are shifting into a wait-and-see accumulation phase. The tape has compressed into a tight $54.8–$55.5 range, suggesting indecision but also potential energy building for the next move. Technically, momentum indicators like RSI and MACD are flattening and hinting at an early reversal setup, while key resistance sits near $55.8–$56.7. If NVA can reclaim and hold above $55.6 with renewed volume, it likely stages a quick rebound toward $56–$57; otherwise, it will continue to base quietly above support until a stronger catalyst emerges. In the near term, the outlook is neutral with a mild bullish bias, as the stock appears to be digesting its selloff rather than beginning another leg down.
There are risks associated with investing in securities. Investing in stocks, bonds, exchange traded funds, mutual funds, and money market funds involve risk of loss. Loss of principal is possible. A security’s or a firm’s past investment performance is not a guarantee or predictor of future investment performance.

Floki price analysis🚀 Elon Musk is back to his old tricks!
With one tweet — he pumped #FLOKI 🐶 again.
⚠️ The bad: pure manipulation, nothing good for the market long term.
✅ The good: Elon clearly feels that this is the “window of opportunity” when just one sentence can spark a +30–50% pump 😏
📊 On the global OKX:FLOKIUSDT chart, the price has been moving in a huge channel for nearly two years.
Now it’s right in the middle zone.
✅ To confirm strength, buyers must break above the midpoint and secure a hold in the upper half of the range.
❌ Otherwise — expect a pullback to the launch rocket zone, or even lower.
🤔 What do you think — another hype tweet, or the start of a new memecoin season?
______________
◆ Follow us ❤️ for daily crypto insights & updates!
🚀 Don’t miss out on important market moves
🧠 DYOR | This is not financial advice, just thinking out loud

IOT watch $36.60: Golden Genesis fib to hold for key Higher LowIOT correcting since it hit ATH above 60 bucks.
Now testing a proven Golden Genesis at $38.60
Lookng for a clean Break-n-Retest for long entries.

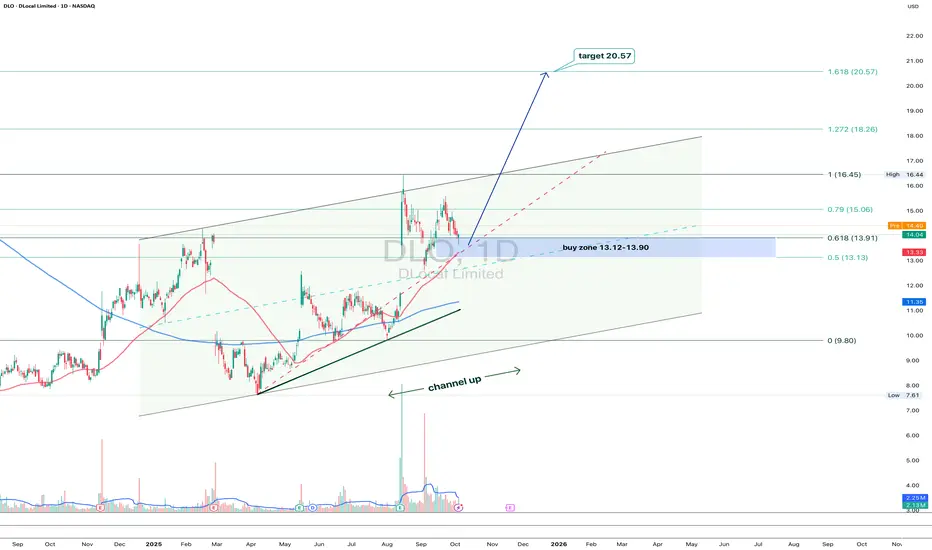
DLO 1D: steady within the channel, eyes on $20+On the daily chart, DLocal keeps trading inside a clean upward channel. After a strong leg up, price is pulling back toward the 13.12–13.90 buy zone - a confluence of the 0.5–0.618 Fibonacci retracement and the channel’s lower boundary.
As long as both MA50 and MA200 stay below price, buyers remain in control. Volume expansion supports the idea of another bullish swing ahead.
First resistance is near $16.45, with the broader target sitting at $20.57 - the 1.618 Fibonacci extension.
From a fundamental standpoint, DLocal keeps strengthening its presence in emerging markets. The fintech theme is still alive, and this setup looks like a calm pullback before another push higher.
In short - wait for confirmation around support, then let the trend do the heavy lifting. Just remember: even the cleanest channels have bumps along the road
AAPL watch $256-257: Double Golden fib zone that caused last TOPAPPL has been confidently climbing the wall of worries.
Now testing the Double Golden zone at $256.75-257.41
Look for a Break-n-Retest (likely) or a Dip-to-Fib for entry.
.
Previous Analysis that caught the EXACT TOP:
Hit BOOST and FOLLOW for more such PRECISE and TIMELY charts.
========================================================
.

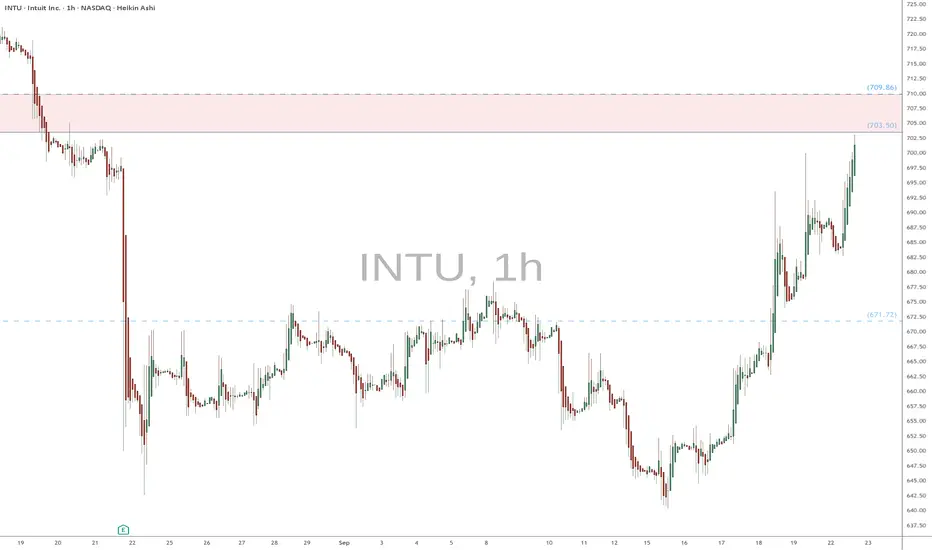
INTU heads up at $703 then 709: Resistance Zone bulls MUST breakINTU trying to paint a bottom after earnings drop.
Currently testing a key resistance $703.50-709.86
Look for a Dip-to-Fib or Break-n-Retest for entries.
.
Previous Analysis that caught the PERFECT BOTTOM:
Hit BOOST and FOLLOW for more such PRECISE and TIMELY charts.
=========================================================
.
NIFTY Intraday Levels for 21ST Oct 2025🙏🏼 HAPPY DIWALI 🙏🏼
🕸️ Though Levels does not work properly on just 1 Hour trading, but published levels Due to GLOBAL as well as Domestic Uncertainty.
🚀 "WEEKLY Levels" mentioned in BOX format.
🌡️Plot Levels Using 3 Min, 5 Min Time frame in your Chart for Better Analysis
L#1: If the candle crossed & stays above the “Buy Gen”, it is treated / considered as Bullish bias.
L#2: Possibility / Probability of REVERSAL near RLB#1 & UBTgt
L#3: If the candle stays above “Sell Gen” but below “Buy Gen”, it is treated / considered as Sidewise. Aggressive Traders can take Long position near “Sell Gen” either retesting or crossed from Below & vice-versa i.e. can take Short position near “Buy Gen” either retesting or crossed downward from Above.
L#4: If the candle crossed & stays below the “Sell Gen”, it is treated / considered a Bearish bias.
L#5: Possibility / Probability of REVERSAL near RLS#1 & USTgt
HZB (Buy side) & HZS (Sell side) => Hurdle Zone,
*** Specialty of “HZB#1, HZB#2 HZS#1 & HZS#2” is Sidewise (behaviour in Nature)
Rest Plotted and Mentioned on Chart
Color code Used:
Green =. Positive bias.
Red =. Negative bias.
RED in Between Green means Trend Finder / Momentum Change
/ CYCLE Change and Vice Versa.
Notice One thing: HOW LEVELS are Working.
Use any Momentum Indicator / Oscillator or as you "USED to" to Take entry.
⚠️ DISCLAIMER:
The information, views, and ideas shared here are purely for educational and informational purposes only. They are not intended as investment advice or a recommendation to buy, sell, or hold any financial instruments. I am not a SEBI-registered financial adviser.
Trading and investing in the stock market involves risk, and you should do your own research and analysis. You are solely responsible for any decisions made based on this research.
"As HARD EARNED MONEY IS YOUR's, So DECISION SHOULD HAVE TO BE YOUR's".
Do comment if Helpful .
In depth Analysis will be added later (If time Permits)

Double Top and Dump simulation (Bearish With Time) Here's a double top scenario slight run to 680. forecasted CMF, MACD, and price action. fits within retracement and time for your Fibonacci nerd.
~$630 11/20/25
~$680 12/30/25
1. Santa rally
2. Gov Shutdown over probably at the 11/20 mark
3. Taco Rally on 11/20 as well
~$650 1/7/25
~$675 2/25/26
~$620 4/16/26
~$600 7/6/26
~$630 7/30/26
~$600 8/21/26
~$550 10/16/26
Just an alternative theory to my blow off top idea.
SP:SPX AMEX:SPY


DLO: updates on trend structure alternativesPrice has followed the upside potential outlined in the September and October updates. However, the structure since the October bottom can also be interpreted as a running flat correction within a larger degree consolidation.
If price moves below the 21dEMA, more downside potential is likely in the coming weeks — with a possible retest of the February and May tops to complete the consolidation phase.
Conversely, closing above the 21dEMA would favor continuation of upside momentum toward the 20–22 resistance zone.
Chart:
Previously:
• On local support (Oct 8):
See Weekly review:
• On pullback potential (Sep 22):
and
• On downside potential and support (Sep 3)
and www.tradingview.com
