GOLD → Consolidation. The fundamental backdrop is changing...FX:XAUUSD stabilizes after a week-long decline, failing to consolidate above $4050. The market is taking a pause before new impulses. Focus on 4030 and 3980...
Investors are closing positions before the end of the week and month, the reason being the uncertainty surrounding the deal with China and Powell's less dovish stance on policy: a 25 bp rate cut is already priced in. The probability of a December cut has fallen to 72.8% (from 91.1% a week ago). Powell emphasized that decisions depend on data, which is not available due to the shutdown.
The strong dollar (2-month highs) is putting pressure on gold. Weak data from China (PMI fell to 49.0) is reducing demand from the largest consumer.
The balance is tipping towards weak fundamentals...
Resistance levels: 4030, 4085
Support levels: 3982, 3955, 3915
Technically, bears are keeping the market below 4030 - strong resistance. If buyers enter the market (there are currently no fundamental reasons for this) and the bulls are able to break through 4030 and keep the price above this level, we will have a chance for growth. But under the current circumstances, I expect a correction to support before a possible rise.
Best regards, R. Linda!
Fibonacci

XAUUSD major pump not finished yet Gold has initiated a short-term corrective phase, with technical indicators suggesting potential for further downside in the immediate term. However, this near-term weakness does not alter our constructive long-term fundamental and technical outlook.
The broader macroeconomic backdrop, including factors such as central bank demand, inflationary pressures, and geopolitical uncertainty, continues to support a structurally bullish thesis for the asset.
Based on this macro-technical analysis, we project a sustained upward trajectory over the coming months. The primary long-term target remains the $5,000 per ounce level, which we view as a feasible objective within the current global economic cycle.
DISCLAIMER: ((trade based on your own decision))
<<press like👍 if you enjoy💚

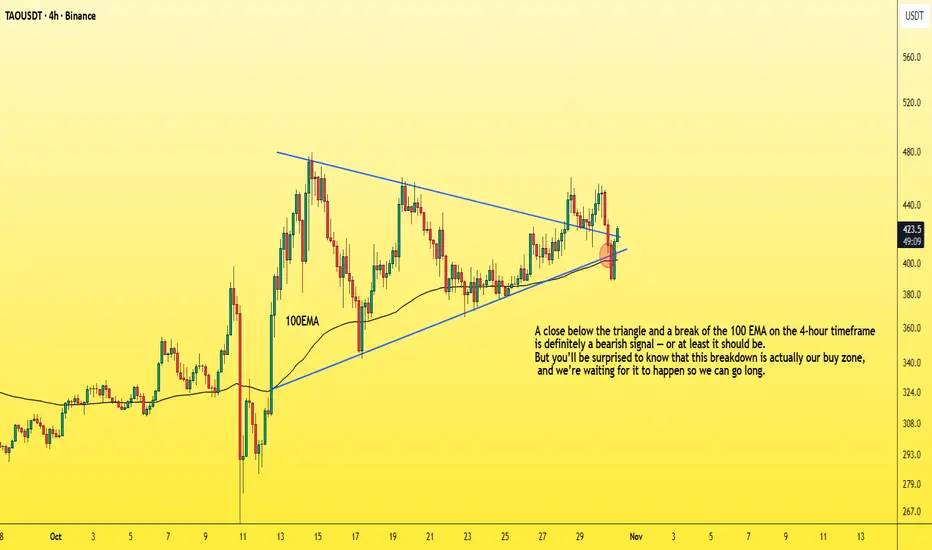
How to enter a successful futures tradeDrop everything and let me show you how to enter a successful long position with the lowest possible risk.
You need to understand that the market maker usually acts against us at major support areas on the chart — like the 100 EMA, 0.618 Fibonacci level, or a trendline.
To make this clearer, let’s take TAO as an example and I’ll explain why.
TAO has strong momentum and a large market cap,
so don’t apply what I’m about to say to meme coins, for example.
Now let’s go step by step on how to enter a futures position after choosing the coin 👇
1. First, wait for a bullish pattern to form — like a triangle — and for the coin to break it upwards with increasing long momentum.
2. The price will then retest the trendline, encouraging people to enter with larger positions, and those who missed the first breakout will likely place buy orders at the retest zone.
3. Then, the market surprises them — it drops back inside the triangle, giving a small bounce at the lower side.
4. But it doesn’t stop there — it continues dropping, breaking below the triangle and closing below the 100 EMA on the 4-hour chart.
This makes you panic and close your long position.
Others start entering shorts thinking it’s a real breakdown.
5. That’s when the market reverses sharply upward,
trapping short traders in losses,
while long traders who exited too early also lose.
In the end, only those who placed buy orders slightly below the strong support level (not directly on it, like under the 100 EMA) — and of course the market maker — end up winning.
So basically, the long traders lose, the short traders lose,
and only a small percentage of smart traders and the market maker win.
Small things to pay attention to 👇
-Your entry point should be slightly below the support, not too far below it.
(That support could be the 100 EMA, below the triangle pattern, or the 0.618 Fibonacci level, as we mentioned.)
-Don’t use high leverage — x5 should be your maximum.
-Place your stop loss 5% below your entry zone,
which equals about 25% loss if you’re using x5 leverage.
And with that, you’ve got yourself a long setup with over a 90% success rate,
and you can apply the same logic in reverse when taking a short position.
Best Regards:
Ceciliones🎯
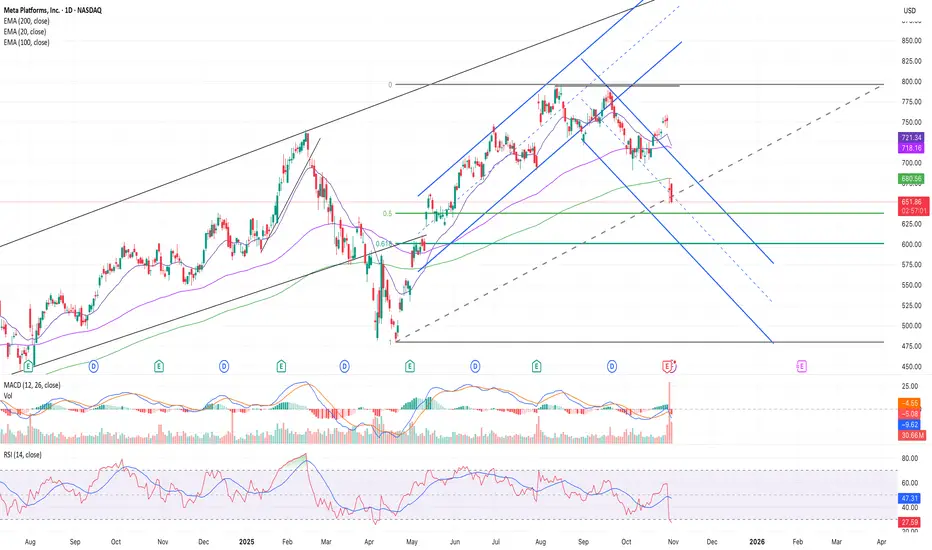
META | Descending Channel & 0.618 Fib SupportMETA is trading inside a descending channel after breaking its main uptrend. Price recently rejected the upper boundary with strong sell volume and a bearish MACD crossover, showing short-term weakness.
The 0.5 Fibonacci level is acting as current support — if price breaks below this, expect a retrace toward the 0.618 Fib zone ($400–$405) which aligns with key channel support. Holding this level could trigger a rebound toward $450–$470, but a close below $400 opens the door to $380–$360.
RSI is near oversold, suggesting a potential bounce if the 0.618 level holds. Medium-term correction within a larger bullish structure.
EURUSD SHORTS Will only be taking shorts if extreme of this leg gets tested and 1 h turns bearish around this area for educational purposes only. Trade safe

CADJPY Wave Analysis – 30 October 2025
- CADJPY broke resistance zone
- Likely to rise to resistance level 111.30
CADJPY currency pair recently broke the resistance zone between the resistance level 109.60 (which stopped wave (1) at the start of October) and the 50% Fibonacci correction of the downtrend from July of 2024.
The breakout of this resistance zone accelerated the active intermediate impulse sequence (3) from the middle of October.
Given the clear daily uptrend, CADJPY currency pair can be expected to rise further to the next resistance level 111.30 (former multi-month high from November).

NasdaqNasdaq is showing a correction pattern after a previous upward movement. The price closed below the old support zone and was rejected, confirming a resistance zone at 25,923.4.
The loss of this support reinforces the continuation of the corrective movement, with a projected drop towards the next support zone at 25,569.8, a point where there is convergence with the previous low and a potential area for absorbing buy orders.

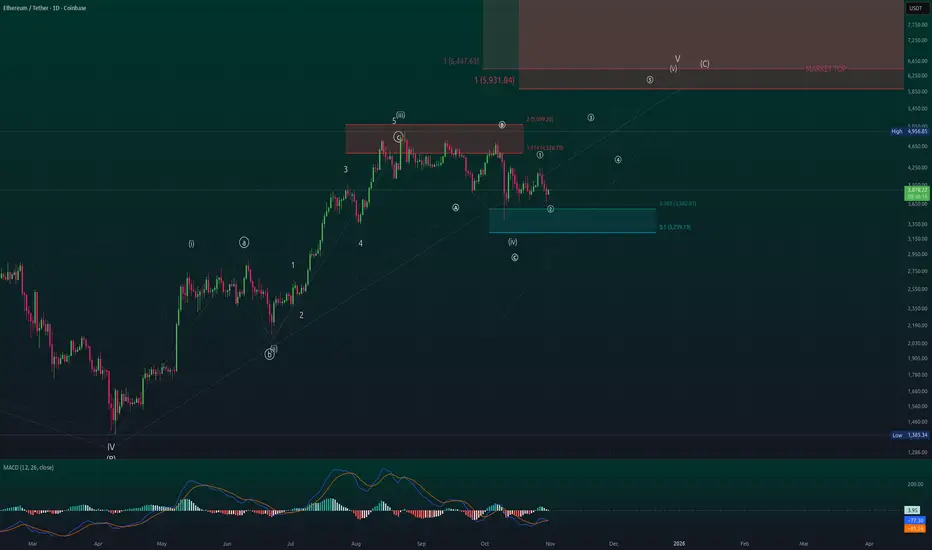
ETH/USDT — Comprehensive EW & Fib RoadmapETH/USDT — Comprehensive EW & Fib Roadmap
**Structure:** From the **Jun ’22 bear-market low → Mar ’24** forms **A/3**; **Apr ’25** prints **B/4**. Since April we’re advancing in **daily Wave C**, now focusing on **(iv)–(v)** completion toward terminal levels. This continues my earlier public idea/thread on ETH’s multi-degree terminal advance.
---
1) Multi-timeframe context
* **Primary count:** Weekly corrective **A–B–C** from ATH with the current leg = **Wave C**. Within it, daily is progressing to finish **Wave (v) of C** (terminal risk once complete). Core EW rules/guidelines (no W2 > 100% of W1; W3 not the shortest; W4 typically avoids W1 territory; alternation) frame the count and invalidations. ( )
* **Fibonacci basis:** Using standard retracement/extension clusters (0.382/0.5 retraces; 1.618/2.0 extensions) for targets and pullback zones.
---
2) 2025 zoom-in (from the Apr ’25 **B/4** low)
* We have a completed **(i)–(iii)** push into the **Aug ’25 high ≈ $4,956** (marked **Wave 3** on the chart).
* **Wave (iv)** most likely **bottomed 10 Oct ’25 ≈ $3,429**, landing in the blue retrace box (**0.382 ≈ $3,575**; **0.5 ≈ $3,233**).
* From that low, price carved a fresh **1–2** to the upside → launching pad for **③ of (v)** toward terminal targets (bearish reversal risk once (v) completes).
*(All levels and labels are taken from the provided chart screenshots.)*
---
3) Confluence zones & path to completion
* **Resistance pivots from prior swings:** **1.618 ≈ $4,528.7** then **2.0 ≈ $5,099**.
* **Terminal target cluster for (v) of C:**
* **$5,900** (first box edge),
* **$6,447** (upper confluence),
* **$8,731** (stretch/throw-over if momentum overshoots).
These align with typical EW/Fib projections for a terminal wave; diagonals often end with throw-overs and sharp reversals thereafter.
---
4) Risk management & invalidation
* **Structure invalidation of the immediate 1–2→3:** sustained break **below $3,200–$3,180** (beneath 0.5 box & October spike-low context) = defer (v) and expect a deeper/complex (iv).
* **Momentum tell:** A push into the $5.9k–$6.45k band with fading momentum/divergence would fit terminal behavior; diagonals frequently reverse hard after completion.
---
5) Alternate (lower-probability)
* If price closes **below $3,429** and holds, treat the current advance as incomplete corrective work; wait for a **new 1–2** before re-engaging on the long side. (Rule-based posture per EW hard rules/guidelines.)
---
## Trade Idea (non-advice; execution-ready)
**Bias:** Long the **1–2** base for a run into the terminal cluster, then de-risk into strength.
**Entry (Option A — pullback ladder):**
* **$3,575 → $3,233** (0.382–0.5 “blue box”). Scale in 3–4 tranches.
**Entry (Option B — confirmation add):**
* Add on decisive **daily close > $4,529** (1.618 pivot) targeting the $5.1k box next.
**Stop / Invalidation:**
* Hard stop **$3,180** (beneath the 0.5 box & Oct spike low). Re-assess if hit.
**Targets / Scale-out plan:**
* **T1:** **$5,100** (2.0 ext / prior resistance).
* **T2:** **$5,900** (terminal box edge).
* **T3:** **$6,447** (upper confluence).
* **Stretch:** **$8,731** only if momentum remains strong (take partials aggressively; diagonals can “throw-over” then snap back). ( )
**Position sizing & management:**
* Risk **≤1–2%** of equity per idea; trail under higher lows once price converts **$4,529** to support; aggressively reduce above **$5.9k** if momentum divergences appear. ( )
---
Reference / Continuation
This analysis continues my prior ETH terminal-advance roadmap on TradingView; review for the higher-timeframe diagonal context and publishing notes. ( )
---
Disclosure
Educational analysis only; **not financial advice**. Risk per trade **≤ 1–2%**.
Breakout ScenarioXRP ist moving in a triangle formation and might have completed the bottom formation of the wave 2 at the 78,6 Fib level
Breakout could be possible in a wave 3 to 1,618 fib or 2,618 fib levels in a impulsive wave 3
Wave 4 and 5 already marked but depends of coure of and if wave 3 is happening.

ZEC proves that old-school crypto still got the fire!The price of CRYPTOCAP:ZEC finally broke out from a long consolidation (unlike poor #DASH 😅).
💰 Market cap already exceeded $6B, even slightly surpassing CRYPTOCAP:XMR (Monero).
🪙 True old-school vibes:
Total supply is limited to 21M coins — just like CRYPTOCAP:BTC . No trillions, no inflationary nonsense 😎
📊 On the #ZECUSDT chart, we see an almost correction-free rally — brief pauses between levels and then another leg up.
In fact, CRYPTOCAP:ZEC just broke above its 2021 high, and we don’t really see any major profit-taking yet.
🧩 P.S. The technical levels work beautifully — use them wisely 😉
⚖️ But the real question is:
is this genuine demand for anonymity, or is someone carefully pumping CRYPTOCAP:ZEC after years of mining accumulation?
______________
◆ Follow us ❤️ for daily crypto insights & updates!
🚀 Don’t miss out on important market moves
🧠 DYOR | This is not financial advice, just thinking out loud.

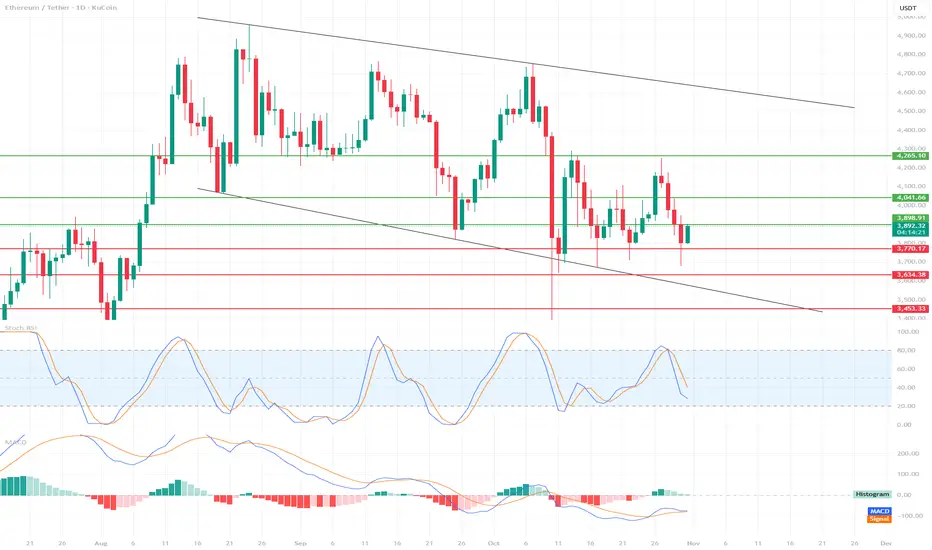
ETH Tests Support – Is This the Beginning of a Rebound?📉 Market Structure
We see a descending channel, bounded by two black trend lines.
Upper Boundary: ~$4,700
Lower Boundary: currently around $3,700, representing strong dynamic support.
The price is currently hovering slightly above the lower edge of the channel, suggesting a possible rebound, but the market remains in a medium-term downtrend.
🔍 Support and Resistance Levels
Support:
$3,770 → currently being tested, crucial in the short term.
$3,643 → next strong support from previous lows.
$3,453 → last line of defense against a steeper decline.
Resistance:
$3,889 → closest resistance, current local ceiling.
$4,041 → strong resistance resulting from prior consolidation.
USD 4.265 → a line that, if broken, could signal a change in the medium-term trend.
📊 Technical Indicators
Stochastic RSI
Located near the oversold zone (below 20), with a slight upward curve.
🔹 Signal: Potential upside move (bounce) in the short term if the %K and %D lines cross upward.
MACD
The MACD line is slightly below zero, but is starting to curve upward and may soon cross the signal line.
🔹 The histogram is starting to decline on the negative side – this is often an early bullish signal (possible change in momentum).
⚖️ Scenarios
🔹 Bullish
If ETH holds above USD 3,770 and the Stoch RSI confirms the rebound, a possible move towards:
3,889 → USD 4,041 → USD 4,265.
A break above USD 4,265 could open the way to USD 4,500+ (upper band of the channel).
🔻 Bearish
Loss of support at USD 3,770 → a signal of weakness.
Then the next downside targets:
USD 3,643, then USD 3,453.
If USD 3,453 breaks, possible tests of the lower band of the channel – even around USD 3,300.
🧭 Summary
Main trend: downward (descending channel).
Short-term bias: neutral-bullish (potential for a rebound from support).
Key level to watch: USD 3,770 – maintaining this level could trigger a rebound, loss = risk of a steeper decline.
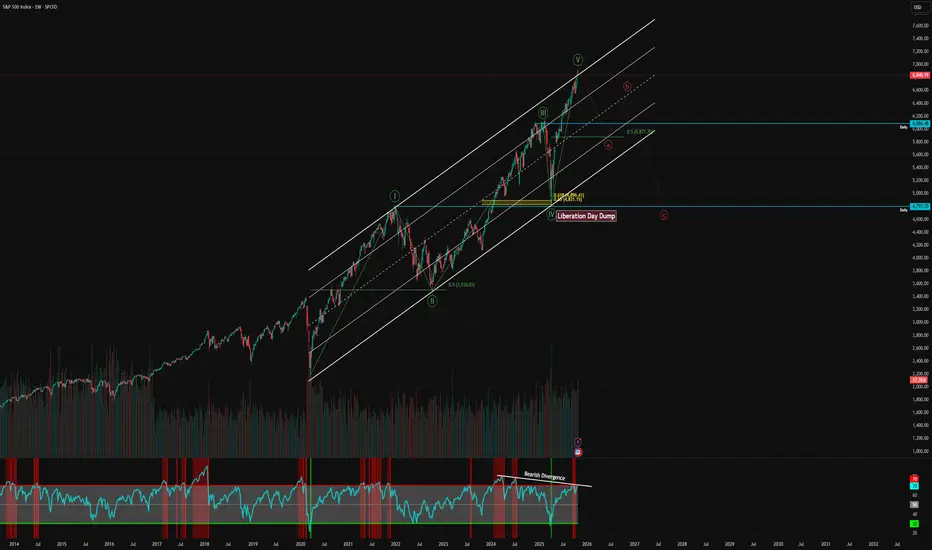
Topping Signal?To me this looks like Wave 5 of the Elliott Wave supercycle in the stock market. We had a monster rally since the liberation day dump, now we are coming up against some strong resistance.
Should we be concerned? So far I have taken a lot of chips of the table. I am still very much long, we don't fight the tape, but if you haven't already started booking profits; have a good hard think about how much higher we could go from here.
The government shutdown will start to filter through the earnings reports next earnings season, especially if it persists over a month. Consumer stocks are showing weakness, whilst the AI trade continue to go vertical, but it will not go on forever - something will eventually give.
CADJPY: Stalking a Pro-Trend Long from the Demand ZoneThe instrument is in an uptrend and is showing the beginning of a potential correction on the 4H structure. If the correction continues its downward movement, long positions can be considered from the DEMAND zone in conjunction with a reaction from one of the Fib levels.
The entry condition will be the price finding acceptance above the 50%, 61.8%, or 78.6% levels upon reaching them.
If a long setup forms, the target will be the high of January 6, 2025 .
The invalidation for the long scenarios in this trade idea will be a break of the 78.6% local level . In that case, the correction will transition to the higher structure, and long positions could then be considered from the daily Fib levels and the daily order block located below.
~~~~~~~~~~~~~~~~~~~~~~~~~~~~~~~~~~~~~~~~~~~~~~~~~~~~~~~~~~~~~~~~~
The principles and conditions for forming the manipulation zones I show in this trade idea are detailed in my educational publication, which was chosen by TradingView for the "Editor's Picks" category and received a huge amount of positive feedback from this insightful trading community. To better understand the logic I've used here and the general principles of price movement in most markets from the perspective of institutional capital, I highly recommend checking out this guide if you haven't already. 👇
P.S. This is not a prediction of the exact price direction. It is a description of high-probability setups that become valid only if specific conditions are met when the price reaches the marked POI. If the conditions are not met, the setups are invalid. No setup has a 100% success rate, so if you decide to use this trade idea, always apply a stop-loss and proper risk management. Trade smart.
~~~~~~~~~~~~~~~~~~~~~~~~~~~~~~~~~~~~~~~~~~~~~~~~~~~~~~~~~~~~~~~~~
If you found this analysis helpful, support it with a Boost! 🚀
Have a question or your own view on this idea? Share it in the comments. 💬
► Follow me on TradingView for timely updates on THIS idea (entry, targets & live trade management) and not to miss my next detailed breakdown.
~~~~~~~~~~~~~~~~~~~~~~~~~~~~~~~~~~~~~~~~~~~~~~~~~~~~~~~~~~~~~~~~~

GBPUSD - Key Support - D1Price just entering a suport cluster, which I think will be respected. I expect the price to go up to 1.33 or even 1.34, then return and continue decline down to 1.28.
Just my humble opinion

USDJPY - in the Resistance ClusterYen entered into a resistance cluster. Yet, the stock market demonstrates weakness. Yen, typically used for carry trading may gain if stocks are sold. Then we may observe a significant correction, even down to 146.
Just my humble opinion

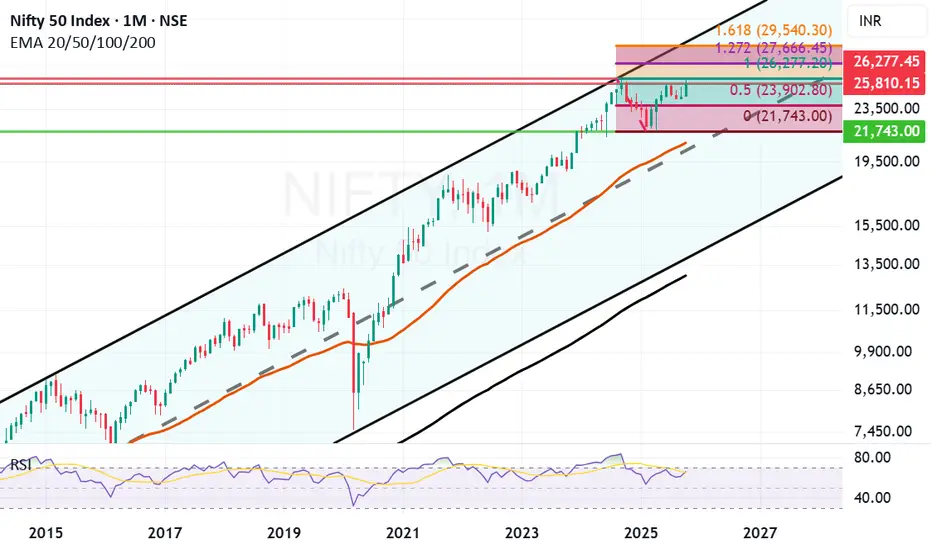
Negative closing today but it was a good monthly closing candle.Despite negative closing for last 2 days of the month it was an overall good monthly candle for Nifty. Previous highest Monthly closing for Nifty was 25810 in September 2024. This month we got a closing slightly below the same at 25722 in October 2025. Once we get a closing above previous all time high in the next month or 2 on in few months time the doors for Next Fibonacci level opens. The next Fibonacci resistance level after we get a closing above previous ATH of 26277 will be at 27666. Golden Fibonacci ratio target in few years time will be 29540.
Very strong Fibonacci support now remains at 23902. Next Fibonacci level support in case of a catastrophic event will be at 21743. Mother line of 50 Months EMA remains at 20853 which is very close to mid-channel support in case there are multiple global or regional situations creating instability.
As of now the shadow of the candle seems positive however there is a chance of little bottom testing for Nifty before we get a new all time high. Sectoral rotations and reshuffling of portfolios of HNIs, MFs and FIIs might also be on card depending on the trade deals and newly emerging tariff scenarios.
Selective stocks which have been giving good results year on year and Quarter on Quarter from Consumption, Defense, Auto, Infrastructure, Banking and Capital Goods sectors including the PSUs themes look good for long term investment currently. While previous superstars of IT, Pharma, Services and other few sectors which lead the previous rally can tend to remain laggard and sideways, specially if the trade deal agreement remain unresolved. If the trade deals with EU and US, specially US goes through even these sectors will fight back and tend to perform.
Overall it was a good month of recovery where Nifty made a comeback from the lows of 24605 to reach 26104 gaining almost 1499 points at one point. Yet it was little disappointing to close below 26K at 25722. Still the positive is that we gained 1117 points this month which is not a bad show at all. Hoping that we get a monthly closing above 26K or previous ATH soon so that doors for next phase of Bull rally can commence swiftly.
Disclaimer: The above information is provided for educational purpose, analysis and paper trading only. Please don't treat this as a buy or sell recommendation for the stock or index. The Techno-Funda analysis is based on data that is more than 3 months old. Supports and Resistances are determined by historic past peaks and Valley in the chart. Many other indicators and patterns like EMA, RSI, MACD, Volumes, Fibonacci, parallel channel etc. use historic data which is 3 months or older cyclical points. There is no guarantee they will work in future as markets are highly volatile and swings in prices are also due to macro and micro factors based on actions taken by the company as well as region and global events. Equity investment is subject to risks. I or my clients or family members might have positions in the stocks that we mention in our educational posts. We will not be responsible for any Profit or loss that may occur due to any financial decision taken based on any data provided in this message. Do consult your investment advisor before taking any financial decisions. Stop losses should be an important part of any investment in equity.
USDJPY → Attempt to break through trend resistance FX:USDJPY breaks through the resistance of the bullish pattern and attempts to remain in the long zone. There is a possibility of price growth against the backdrop of the dollar's rise following Powell's speech.
The dollar is recovering after the Fed meeting, and against this backdrop, the Japanese yen is losing ground, breaking through resistance at 153.23. The currency pair is trying to capitalize on the chance for growth.
The Japanese yen is forming a breakout of the resistance of a bullish pattern: an ascending triangle + consolidation on a bullish trend.
If buyers keep the price above 153.23, the market will have a chance to grow to 154.7.
Resistance levels: 153.23, 154.7
Support levels: 151.85, 152.37
On D1, the currency pair is trying to overcome the resistance of a multi-month downward correction. Locally, on H1, there is a breakout of the bullish pattern structure, which indicates interest from buyers. The chances of growth from 153 will appear if the price consolidates above the specified level.
Best regards, R. Linda!

LINKUSDT → A trap? Grabbing liquidity before the fall...BINANCE:LINKUSDT is forming a correction after a bearish run. A false breakdown of support is triggering a correction before a possible continuation of the decline.
The coin is testing the support of the trading range within the downtrend. The reaction to the false breakdown of support is a pullback to the zone of interest. After a strong downward distribution, a correction to the break-even zone is forming. A false breakout of resistance at 17.45 could trigger a continuation of the decline due to a weak market and a liquidity pool formed above 17.450, which is likely to stop the pullback on the bearish trend.
Resistance levels: 17.450
Support levels: 16.53, 15.77
The downtrend may continue. A retest of resistance may end in a fall and an update of the local minimum, as well as reaching the zone of interest at 15.77.
Best regards, R. Linda!

USD/JPY📊 Technical Analysis
Trend: The overall daily and weekly trend remains "bullish".
Structure: A rejection at 154 suggests sellers defending that area.
Liquidity zone: 153.00 aligns with previous demand, Fibonacci 38–50 % retracement, and EMA support — a likely area for buyers to reload.
Pattern: Double-top → short-term correction → continuation pattern.
✅ Bearish pullback: Price rejects 154 → retraces to 153 (liquidity sweep) → resumes uptrend | Bearish rejection candle on 4H or daily.
❌ Invalidation / breakout: Price breaks and closes above 154.30 with strong volume Continuation straight to 155–156 without retrace.
> The USD/JPY may be setting up for a short-term correction from 154.00 toward 153.00 to gather liquidity before continuing higher in line with the long-term bullish trend.

USD/CHF Coiled for November BreakoutThe Swiss Franc is back on the defensive this week, with USD/CHF up more than 1.2% in the wake of the Fed rate decision. The three-day advance has extended into technical resistance heading into the weekly and monthly close, and the focus now turns to a potential inflection off this key zone.
USD/CHF is trading within the confines of a proposed ascending pitchfork extending off the monthly lows. The break of the weekly opening-range on Fed-day extended into the 75% parallel with price now testing resistance at 8040- a region defied by the 100% extension of the advance off the monthly low and the April swing low. A topside breach / close above this threshold would expose the September / October swing highs at 8072/76. Strength surpassing this hurdle would be needed suggest that a more significant low is in place / a larger trend reversal is underway with subsequent resistance objectives eyed at the 100% extension of the broader September advance at 8120 and the August high / May low at 8172/85 (both levels of interest for possible exhaustion / price inflection IF reached).
Initial support rests with the August low-day close (LDC) at 8007 and is backed by the objective October open at 7964. Losses below this threshold would invalidate the near-term uptrend with a break / close below the July LDC at 7911 ultimately needed to mark resumption of the broader downtrend towards the yearly lows.
Bottom line: USD/CHF continues to coil within the broader September range, and the focus is on a breakout of this multi-week consolidation pattern. From a trading standpoint, a good zone to reduce long-exposure / raise protective stops- losses should be limited to 7964 IF price is heading higher on this stretch with a close above 8076 ultimately needed to fuel the next major leg of the advance.
-MB

$111,661 and 25 cents: BTC Genesis fib to say "its Ova" or notShown here is a single fib series in three different time-frames.
The Genesis Sequence has called all of the major turns since 2015.
These are "very high gravity" objects that tend to capture into orbit.
$ 111,661.25 is a "minor" ratio between semi-majors.
$ 105,451.85 Is a "semi-major" and possible bottom
$ 117,868.00 is a semi-major above for next target if bull.
Bottom line:
Rejection here could add to the "its over" narrative.
Break-n-Hold of this fib would help dispel that idea.
We expect a few "orbits" here then escape upwards.
See "Related Publications" for previous EXACT calls such as our recent TOP:
Hit BOOST and FOLLOW for more such PRECISE and TIMELY charts.
========================================================

BTCUSD.PBTCUSD.p 15 minut IFVG touch and town liquidity is target and 5 minute activities buy side liquidity and 5 minute OB for entry down side liquidity

Zcash Wave Analysis – 31 October 2025- Zcash rising inside impulse wave 3
- Likely to test resistance level 400.00
Zcash cryptocurrency earlier reversed up from the round support level 300.00 (which has been reversing the price from the start of October) intersecting with the 38.2% Fibonacci correction of the upward impulse from the middle of this month.
The upward reversal from the support level 300.00 continues the active impulse wave 3, which belongs to the intermediate impulse wave (5) from last month.
Given the strong daily uptrend, Zcash cryptocurrency can be expected to rise further toward the next round resistance level 400.00, target price for the completion of the active impulse wave (3).
