Lam Research - Wave ContinuesLam Research is continuing its corrective move, with wave C already in progress.
Fibonacci levels indicate multiple downside targets.
Targets:
141 -> 134 -> 125
---
Please subscribe and leave a comment.
You’ll get new information faster than anyone else.
---
Fibonacci

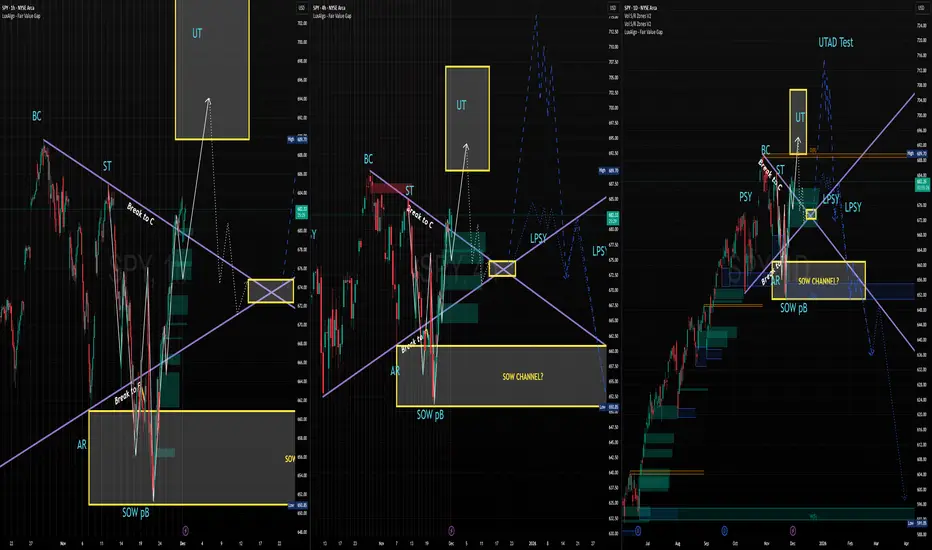
Long Term Wyckoff Distribution In-PlayAs the title states, we have a Wyckoff distribution method/pattern in play here on the chart.
So far the set up and pattern has been pretty on-point if you take a look and analyze Wyckoff Methods from www.wyckoffanalytics.com .
I don't have a ton of additional analysis to add here. I am only analyzing the chart and indicators I have. However, I'd love to hear some additional feedback for contrasting opinions or agreeing opinions for some confluence.
Have a great day TV gang and I hope you have a great December.
GIFTNIFTY: IntraSwing Levels For 18th Dec '25GIFTNIFTY IntraSwing Levels For 18th Dec '2
[ Level Interpretation / description:
L#1: If the candle crossed & stays above the “Buy Gen”, it is treated / considered as Bullish bias.
L#2: Possibility / Probability of REVERSAL near RLB#1 & UBTgt
L#3: If the candle stays above “Sell Gen” but below “Buy Gen”, it is treated / considered as Sidewise. Aggressive Traders can take Long position near “Sell Gen” either retesting or crossed from Below & vice-versa i.e. can take Short position near “Buy Gen” either retesting or crossed downward from Above.
L#4: If the candle crossed & stays below the “Sell Gen”, it is treated / considered a Bearish bias.
L#5: Possibility / Probability of REVERSAL near RLS#1 & USTgt
HZB (Buy side) & HZS (Sell side) => Hurdle Zone,
*** Specialty of “HZB#1, HZB#2 HZS#1 & HZS#2” is Sidewise (behaviour in Nature)
Rest Plotted and Mentioned on Chart
Color code Used:
Green =. Positive bias.
Red =. Negative bias.
RED in Between Green means Trend Finder / Momentum Change
/ CYCLE Change and Vice Versa.
Notice One thing: HOW LEVELS are Working.
Use any Momentum Indicator / Oscillator or as you "USED to" to Take entry.
⚠️ DISCLAIMER:
The information, views, and ideas shared here are purely for educational and informational purposes only. They are not intended as investment advice or a recommendation to buy, sell, or hold any financial instruments. I am not a SEBI-registered financial adviser.
Trading and investing in the stock market involves risk, and you should do your own research and analysis. You are solely responsible for any decisions made based on this research.
"As HARD EARNED MONEY IS YOUR's, So DECISION SHOULD HAVE TO BE YOUR's".
Do comment if Helpful .
Do Comment for In depth Analysis. Follow notification about periodical View
5

MSTR. When Bitcoin sneezes, Strategy looks for the floorMSTR is deep in a corrective phase after the rally to 543. The current decline does not signal a structural breakdown but a return to a major demand zone at 100–102, where long term support and prior accumulation align. Selling volume is fading, suggesting seller exhaustion rather than panic. As long as price holds above 100–102, the recovery scenario remains valid. Initial rebound targets sit near 230, followed by 300 if market structure stabilizes.
Fundamentally, Strategy remains the most leveraged public Bitcoin proxy. As of December 2025, the company holds over 214000 BTC, making it the largest public Bitcoin holder globally. The average acquisition price remains well below historical highs, reducing long term downside risk. In Q3 2025, the company reported an increase in digital asset value as crypto markets recovered. The core analytics software business remains stable, while debt servicing shows no liquidity stress. Strategy is no longer just a software company. It is a macro Bitcoin instrument in equity form.
When Bitcoin panics, MSTR falls harder. But it usually stands up first when the cycle turns.

85,354 and 35 cents: BTC Golden Genesis Fib proving VERY strongShown here is a single fib series in three different timeframes.
The "Genesis Sequence" has called all major turns since 2015.
These are "high gravity" objects that tend to capture into orbit.
This Golden fib (1.1618 exponent) has proven itself again and again.
It probably will NOT hold after so many hits but WOW, what a fighter!
Perhaps bulls will pull off a miracle, but likely we fall through it now.
$125,550.41 was the cycle top exactly at a fib.
$ 85,354.35 Golden Fib that has proven utlra-strong
$ 97,769.44 is first barrier for bounce off the Golden.
$ 77,672.47 is the first support if we lose the Golden.
.
See "Related Publications" for previous Plots such as this EXACT TOP call:
Hit BOOST and FOLLOW for more such PRECISE and TIMELY charts.
========================================================
.

BTCUSD: Anticipating a Strategic Sell OpportunityRecent economic indicators present a challenging landscape for risk assets, with disappointing U.S. employment figures underscoring labor market fragility and cooling inflationary pressures signaling a potential shift in monetary policy expectations. Major U.S. equity indices, such as the Dow Jones Industrial Average (US30) and Nasdaq-100 (NDX), are exhibiting technical patterns suggestive of near-term exhaustion, hinting at a broader market correction. Against this backdrop, Bitcoin (BTC/USD) appears poised for a period of weakness.
From a technical perspective, BTC/USD is approaching a critical juncture. The pair is testing a key ascending resistance trendline (highlighted in orange), which has historically acted as a formidable barrier. A retracement toward this dynamic resistance zone is anticipated, presenting a high-probability selling opportunity. Given that this setup does not align with a classic A-Book liquidity profile, trading volumes may remain subdued, suggesting a less aggressive approach to position sizing.
Traders are advised to monitor price action closely for confirmation of a pullback, with a focus on confluence between the ascending resistance and other technical indicators, such as momentum divergences or elevated selling pressure, to optimize entry timing. Risk management remains paramount in navigating this potentially volatile environment.

AQN | Utilities Companies Win Big Next Year | LONGAlgonquin Power & Utilities Corp. is an investment holding company, which engages in energy generation and water distribution facilities. It operates through the Regulated Services Group and Renewable Energy Group segments. The Regulated Services Group segment owns and operates a portfolio of electric, natural gas, water distribution, and wastewater collection utility systems and transmission. The Renewable Energy Group segment focuses on operating a diversified portfolio of renewable and thermal electric generation assets. The company was founded on August 1, 1988 and is headquartered in Oakville, Canada.

BTC Critical Test: Can the $86k Volume Shelf Hold?📉 BTC/USD: Institutional Market Structure
Date: December 17, 2025
Timeframe: 4-Hour (Bitstamp)
The Executive Summary
Bitcoin remains in a Bearish High Time Frame (HTF) posture. Price is currently testing the lower bound of value, sitting directly on the -1 Standard Deviation band. We are witnessing a high-volume compression event. The market must decide: defend this liquidity shelf or flush to the -2σ deviation.
1. Key Institutional Levels
• 📍 Point of Control (POC): $90,172
• The Pivot: This is where the most volume has traded. As long as we are below $90k, the market is in "distribution mode." Rallies into this zone are likely selling opportunities.
• 📉 Anchored VWAP (AVWAP): $93,510
• The Trend: We are significantly below the institutional average price. The spread between Price ($86k) and AVWAP ($93k) confirms sellers are dominating momentum.
2. Volatility & Statistical Targets
• Current Battleground (-1σ): $86,326. We are trading exactly at this level. The algos are currently fighting to hold price inside the statistical norm.
• Downside Target (-2σ): $79,142. If the current support fails, this is the next high-probability liquidity pool.
• Upside Reversion (+1σ): $100,694. A distant target, only relevant if we reclaim the $90k POC first.
3. Volume Profile Analysis
Look at the massive Volume Shelf (Green Histogram) between $86,000 and $92,000.
• The Trap: We are at the bottom of this shelf. This is the danger zone. If price slips below $84,000, we enter a "Low Volume Node" (LVN).
• Physics of Price: Price travels fast through low volume. A loss of $84k could result in a rapid liquidation cascade down to the $79k - $80k region.
4. The Trade Plan
• 🐻 Bearish Continuation (Primary):
• Watch for a 4H close below $86,000.
• Target: The -2σ Band at $79,142.
• Invalidation: A reclaim of the POC ($90,172).
• 🐂 Bullish Reclaim:
• We need to see price accept back above $92,000. Until then, this is "chopping wood" in a bearish trend.
Analyst Note: The chart shows a "Last Signal: 3" (Downside exhaustion/continuation). Do not mistake support for a reversal. We are simply pausing at the bottom of the value area.

Long Term Silver Bull Going ShortThis post is a follow up to my "Grand Silver Supercycle" chart posted on 2/2/2023. I recommend referencing that chart to understand my commentary here. In that chart, I called for silver to double in price by the end of 2025 and to reach $95 by 2027. Since then, silver has overshot my near term price targets. I'm here to argue that silver has gone up too far too quickly and is due for a sharp pullback to the $50-$55 range.
Why am I calling this the near term top?
Silver has very neatly followed Elliot Wave Theory throughout its history. In 2023, I predicted Wave 3 of the current cycle, which began with the low in the summer of 2022, to have a 1.618 extension of Wave 1. Instead, silver just reached the 2.618 extension, which back in 2023, I thought was too bold of a prediction. While it is possible for a 4.618 extension to 102.5, these extensions are very rare. The bias is towards a pullback here.
There is also a convergence between the Elliot Wave extension, a fib retracement level, and logarithmic trendline. This indicates that any attempts to breakout higher will face strong resistance.
Finally, I need to talk about gold. The monthly RSI has been over 90 for 3 months, closing in on 4 months. Gold has only held an RSI above 90 for 4 consecutive months at one point prior in its charted history. Gold is still silver's big brother and will determine the direction the two move.

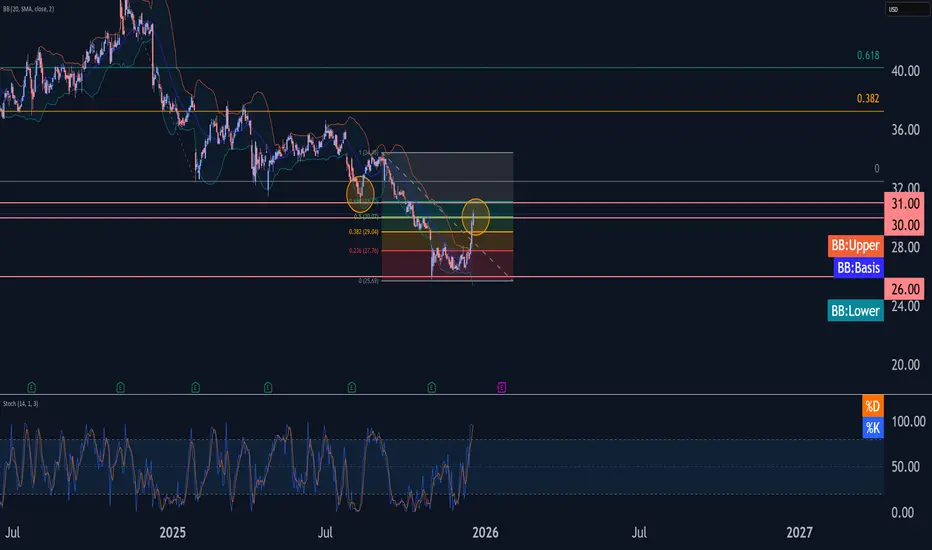
Comcast Wave Analysis – 17 December 2025
- Comcast broke resistance area
- Likely to rise to resistance level 31.00
Comcast recently broke the resistance area between the round resistance level 30.00 and 50% Fibonacci correction of the previous sharp downward impulse from September.
The breakout of this resistance area accelerated the active ABC short-term correction iv from the end of October.
Comcast can be expected to rise further to the next resistance level 31.00 (former strong support from April and August).
USDCAD Weekly BiasWeekly bias is bullish .CRT candles is formed but needs 2 days for confirmation .expect some pullback down on 4h chart before resuming the bullish scenario.

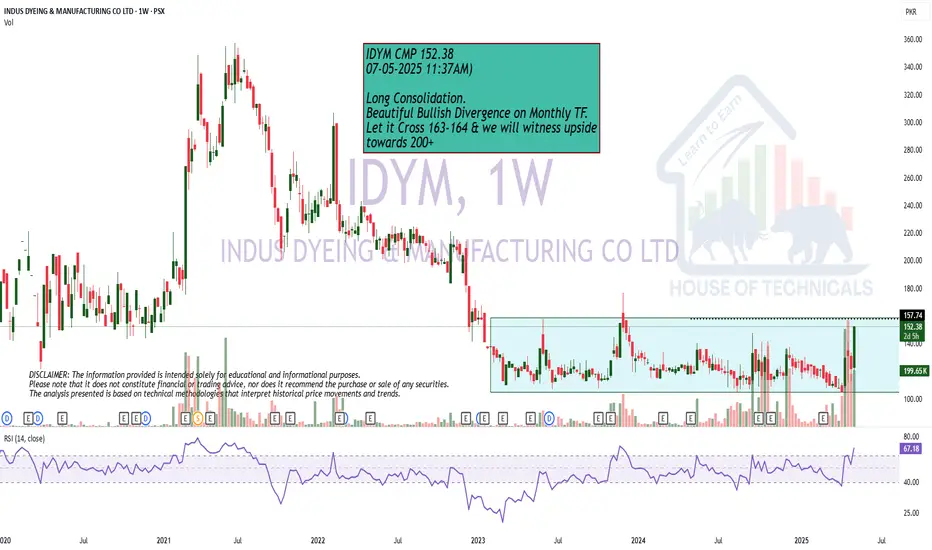
Near BreakoutLong Consolidation.
Beautiful Bullish Divergence on Monthly TF.
Let it Cross 163-164 & we will witness upside
towards 200+
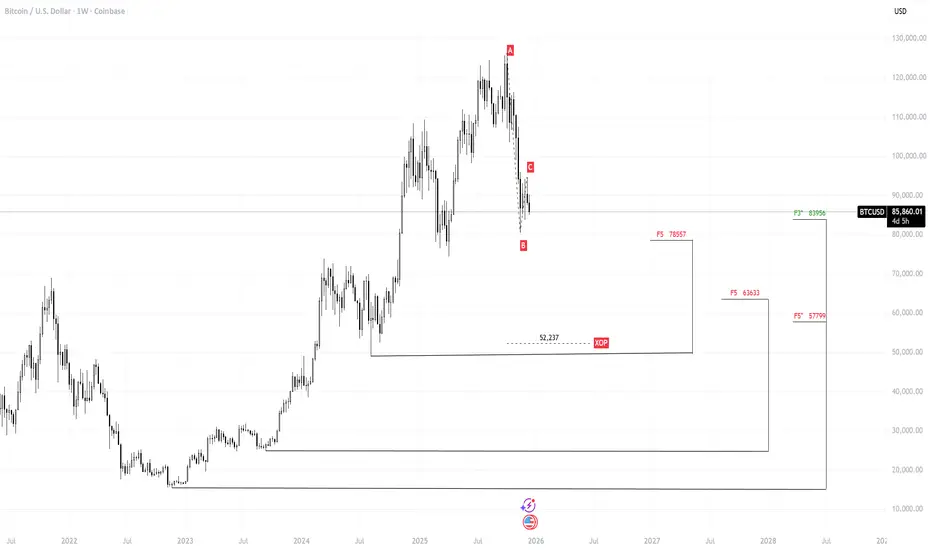
Bitcoin – DiNapoli Levels to Monitor for a Potential Long SetupThe chart shows several untested DiNapoli levels on the right , which represent the primary areas of interest for a potential long scenario. These levels have not yet been tested or broken and therefore remain technically valid.
At the moment, price action remains strongly bearish. The market has already broken through four DiNapoli levels without any visible signs of momentum weakening, which confirms the strength of the current downside move. As long as this behavior persists, no long entry is justified.
The XOP target of the current downside swing is located around $52,237 . Given the structure and the absence of bullish signals so far, a test of this level remains a high-probability scenario.
Only after price reaches the marked DiNapoli levels and if clear signs of trend weakening appear (failure to reach extensions, momentum divergence, or DiNapoli reversal patterns), a long setup may be considered. Until such confirmation is present, this analysis remains purely observational, with no anticipatory positioning.
BTC Next Leg DownA continuation downward leg fractal is drawn. It reaches 0.618 - 0.66 of the 2022 low to the 2025 high. This seems like a good area to draw down into in order to have a chance of consolidation.

How to Trade Breakouts in TradingViewBreakout trading is a strategy that aims to capture strong price movements when markets break through key support or resistance levels, often signaling the start of a new trend or continuation move.
What You'll Learn:
Understanding breakouts as price movements beyond established support or resistance levels
How breakouts can occur at horizontal levels, trendlines, or chart patterns like triangles, rectangles, and flags
Why consolidation patterns often precede strong breakout moves
Recognizing the difference between false breakouts and confirmed breakouts
How to use candle closes beyond key levels as confirmation rather than relying on quick spikes
The critical role of volume in validating breakouts and separating real moves from fakeouts
Why expanding ATR during a breakout confirms increasing volatility and momentum
Understanding the break and close entry method for conservative breakout trades
How to scale into positions by entering partially on the break and adding on continuation
Using the pullback entry strategy to trade retests of broken levels as new support or resistance
Setting stop losses using ATR-based methods or placing them beyond consolidation patterns
Calculating profit targets with measured move techniques by projecting pattern heights
How to mark key levels in TradingView using the horizontal line tool from the left toolbar
Drawing trendlines and connecting swing points for pattern recognition
Accessing built-in pattern recognition tools through the Indicators menu
Practical examples using futures charts across multiple timeframes
This tutorial is designed for futures traders, day traders, and swing traders who want to capitalize on momentum moves and volatility expansion using technical breakout strategies.
The methods discussed may help you identify high-probability breakout setups, manage entries with proper confirmation, and set risk-appropriate stops and targets across multiple markets and timeframes.
Learn more about futures trading with TradingView: optimusfutures.com
Disclaimer
There is a substantial risk of loss in futures trading. Past performance is not indicative of future results. Please trade only with risk capital. We are not responsible for any third-party links, comments, or content shared on TradingView. Any opinions, links, or messages posted by users on TradingView do not represent our views or recommendations. Please exercise your own judgment and due diligence when engaging with any external content or user commentary.
This video represents the opinion of Optimus Futures and is intended for educational purposes only. Chart interpretations are presented solely to illustrate objective technical concepts and should not be viewed as predictive of future market behavior. In our opinion, charts are analytical tools, not forecasting instruments.

$NFLX its showtime!What it dew yall?! So NASDAQ:NFLX came out the gates steaming this morning but has reduce some of its spark as the day has progressed. Price is still in a semi uptrend on the 15 min TF. Price rejected at Level 0. Technically Buyers lost control after we closed below the 0.382, However it's not over until we're under the 0 and because this is an early spot, I have set my S/L at the -.0272 (CLOSE below this level). Where price is right now this would be considered an early Entry, (As long as the EMA's don't flip/ Side note, I use 8/14/21 EMA's). The R:R is Crazyyyyy. Not too much to lose and everything to gain. Plus, Tomorrow is CPI. What could get more crazier right before Christmas? LOL.
Once I learn how to publish my indicators correctly, Ill let yall know.
Happy Trading, Alerts Set!

AUDUSD — Counter-Trend ABC Breathing Inside a Bearish HTF WCLPrice is currently trading inside a fresh bearish higher-timeframe WCL , so any upside here is treated as corrective, not a trend flip.
Within that context, a clean bullish ABC has formed.
B held structurally, displacement followed, and the move left behind a breaker block + FVG , which defines my area of interest.
The idea is simple:
If price revisits this zone and respects it, the path of least resistance is a continuation of the correction toward the ABC C-target , before deeper HTF supply comes into play.
Invalidation is clear.
A break below B kills the sequence entirely.
This is a location-first setup —not a prediction, not a signal.
Always wait for confirmation and trade in alignment with higher-timeframe context.
Not financial advice.

BABA: when China allows growth againAlibaba remains one of the most undervalued mega-cap tech companies globally. After years of regulatory pressure and weak macro conditions in China, the company is entering a stabilization phase. Regulatory risks have eased, and Chinese authorities are signaling support for the technology sector and domestic consumption. Alibaba continues to generate strong cash flow, operates a massive ecosystem across e-commerce, cloud, and logistics, and actively executes share buybacks, reducing float. At current levels, the market is pricing in excessive pessimism, creating asymmetric upside if macro conditions improve.
From a technical perspective, price is trading inside a rising channel. After a strong impulse, the market moved into a corrective phase, forming a swing zone. Price remains above key EMA levels, confirming a valid medium-term uptrend. The current area represents a buyer interest zone aligned with structural support and Fibonacci levels. Declining volume during the pullback supports the idea of a healthy correction rather than trend reversal.
Trading plan: as long as price holds above the current support zone and confirmation appears, long positions become attractive. The first target is a return to previous highs, followed by Fibonacci extensions. Medium-term targets align with the upper boundary of the channel. A breakdown below the swing zone would invalidate the bullish scenario and signal deeper correction.
The best opportunities often appear when fear fades but confidence hasn’t returned yet.

Alphabet May Be OversoldAlphabet has pulled back after hitting a new all-time high, and some traders may think it’s oversold.
The first pattern on today’s chart is the rally between November 14 and November 25. The Internet giant held its ground yesterday after retracing half the advance, which may confirm its direction is pointing higher.
Second, GOOGL has bounced multiple times at its 21-day exponential moving average (EMA). It returned to the same EMA yesterday. Will that lure trend followers?
Next, stochastics have dipped to an oversold condition.
Finally, GOOGL is an active underlier in the options market. That could help traders take positions with calls and puts.
TradeStation has, for decades, advanced the trading industry, providing access to stocks, options and futures. If you're born to trade, we could be for you. See our Overview for more.
Past performance, whether actual or indicated by historical tests of strategies, is no guarantee of future performance or success. There is a possibility that you may sustain a loss equal to or greater than your entire investment regardless of which asset class you trade (equities, options or futures); therefore, you should not invest or risk money that you cannot afford to lose. Online trading is not suitable for all investors. View the document titled Characteristics and Risks of Standardized Options at www.TradeStation.com . Before trading any asset class, customers must read the relevant risk disclosure statements on www.TradeStation.com . System access and trade placement and execution may be delayed or fail due to market volatility and volume, quote delays, system and software errors, Internet traffic, outages and other factors.
Securities and futures trading is offered to self-directed customers by TradeStation Securities, Inc., a broker-dealer registered with the Securities and Exchange Commission and a futures commission merchant licensed with the Commodity Futures Trading Commission). TradeStation Securities is a member of the Financial Industry Regulatory Authority, the National Futures Association, and a number of exchanges.
Options trading is not suitable for all investors. Your TradeStation Securities’ account application to trade options will be considered and approved or disapproved based on all relevant factors, including your trading experience. See www.TradeStation.com . Visit www.TradeStation.com for full details on the costs and fees associated with options.
Margin trading involves risks, and it is important that you fully understand those risks before trading on margin. The Margin Disclosure Statement outlines many of those risks, including that you can lose more funds than you deposit in your margin account; your brokerage firm can force the sale of securities in your account; your brokerage firm can sell your securities without contacting you; and you are not entitled to an extension of time on a margin call. Review the Margin Disclosure Statement at www.TradeStation.com .
TradeStation Securities, Inc. and TradeStation Technologies, Inc. are each wholly owned subsidiaries of TradeStation Group, Inc., both operating, and providing products and services, under the TradeStation brand and trademark. When applying for, or purchasing, accounts, subscriptions, products and services, it is important that you know which company you will be dealing with. Visit www.TradeStation.com for further important information explaining what this means.

GBPAUD — BC Entry Inside Weekly WCL, Invalidation Below BPrice is trading inside a Weekly WCL after a weekly bearish ABC sequence completed . At that point, momentum fades and location takes control .
Within this context, a bullish ABC formed, and price retraced into the BC / order-block zone .
Entry is mechanical, with invalidation below B , the sequence failure point.
Expectation is simple:
B holds → rotation higher toward the bullish ABC target
B breaks → idea invalidated
Note : when time allows, always wait for confirmation inside the level (sweep, displacement, CISD, etc.).
Structure over prediction.
— SmellyTaz
Disclaimer : This is not financial advice.


NIFTY Analysis for 18th Dec '25: IntraSwing Spot levelsNIFTY Analysis for 18th Dec '25: IntraSwing Spot levels
Follow GIFTNIFTY Post for NF levels
Moving Averages
Period Simple Exponential
MA 9 25932.90 25929.39
MA 20 26017.61 25942.93
MA 50 25803.86 25765.13
MA 100 25320.29 25452.51
MA 200 24767.86 24974.57
Technical Indicator
Name Value
Adx(14) 0.00
Rsi(14) 46.47
Stoch Rsi(14) 0.11
MACD(12,26) 23.15
Williams %R -80.19
ROC -1.51
NIFTY 50 Synopsis: December 17, 2025
Market Overview:
The NIFTY 50 index ended the session marginally lower, marking its third consecutive negative close amid persistent FII outflows (cumulative ~₹20,000 Cr in December) and rupee weakness at 90.50. Global cues were mixed (US flat, Asia subdued), with domestic DII buying providing some cushion. The index consolidated below key resistance at 25,950, forming a Doji pattern indicating indecision.
Key Metrics:
Open: 25,902.40
High: 25,929.15
Low: 25,770.35
Close (Last Tick): 25,822.65 (↓37.35 pts or -0.14%)
POST Close: 25,818.55
Volume: Moderate; AD ratio 23:27 (bearish tilt).
Sectoral Performance:
Gainers: PSU Bank (+1%), Metals (+0.5%), Pharma (resilient on global cues).
Losers: IT (-0.7%), Auto (-0.5%), Realty (yield pressure).
Key Drivers:
Positives: DII inflows (~₹1,077 Cr); metals rebound on commodity rally.
Negatives: FII selling; rupee rout dims EM sentiment; no fresh trade deal progress.
Sentiment: Cautious analysts eye 25,900 for bounce
Outlook: Range-bound (25,770–25,930); watch rupee/RBI intervention for upside triggers. PSU Bank index's strength signals selective opportunities.
Intraday ScreenShot 5 min TF
[ Level Interpretation / description:
L#1: If the candle crossed & stays above the “Buy Gen”, it is treated / considered as Bullish bias.
L#2: Possibility / Probability of REVERSAL near RLB#1 & UBTgt
L#3: If the candle stays above “Sell Gen” but below “Buy Gen”, it is treated / considered as Sidewise. Aggressive Traders can take Long position near “Sell Gen” either retesting or crossed from Below & vice-versa i.e. can take Short position near “Buy Gen” either retesting or crossed downward from Above.
L#4: If the candle crossed & stays below the “Sell Gen”, it is treated / considered a Bearish bias.
L#5: Possibility / Probability of REVERSAL near RLS#1 & USTgt
HZB (Buy side) & HZS (Sell side) => Hurdle Zone,
*** Specialty of “HZB#1, HZB#2 HZS#1 & HZS#2” is Sidewise (behaviour in Nature)
Rest Plotted and Mentioned on Chart
Color code Used:
Green =. Positive bias.
Red =. Negative bias.
RED in Between Green means Trend Finder / Momentum Change
/ CYCLE Change and Vice Versa.
Notice One thing: HOW LEVELS are Working.
Use any Momentum Indicator / Oscillator or as you "USED to" to Take entry.
⚠️ DISCLAIMER:
The information, views, and ideas shared here are purely for educational and informational purposes only. They are not intended as investment advice or a recommendation to buy, sell, or hold any financial instruments. I am not a SEBI-registered financial adviser.
Trading and investing in the stock market involves risk, and you should do your own research and analysis. You are solely responsible for any decisions made based on this research.
"As HARD EARNED MONEY IS YOUR's, So DECISION SHOULD HAVE TO BE YOUR's".
Do comment if Helpful .
Do Comment for In depth Analysis.
Follow notification about periodical View

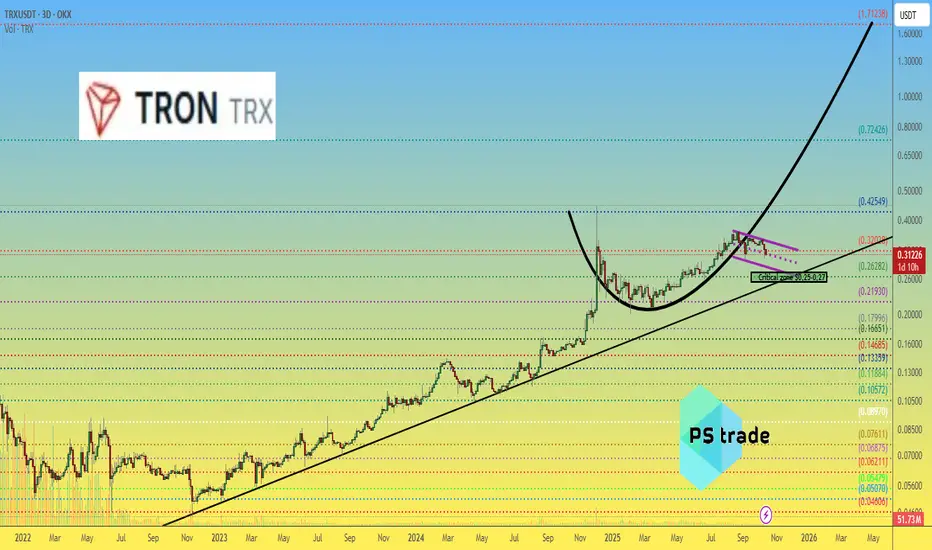
$TRX — The “protected child” of Justin SunOnce again, AMEX:TRX has proven it’s the “favorite child” of its creator, Justin Sun.
Despite the market chaos, OKX:TRXUSDT dropped only ~10%, showing exceptional resilience while many altcoins suffered deep crashes.
The next key support zone is $0.25–0.27, (based on trend line) which previously marked bottoms during the COVID crash (March 2020) and November 2022.
If buyers defend this level, it could act as a strong base for a rebound — possibly up to $1.7.
This structure continues to reflect steady demand and long-term accumulation rather than exit pressure.
💭 Will #Tron repeat its historical bounce from this range, or is the sentiment shifting this time?
______________
◆ Follow us ❤️ for daily crypto insights & updates!
🚀 Don’t miss out on important market moves
🧠 DYOR | This is not financial advice, just thinking out loud