XAU/USD From Panic to Pause- Breakout to Decide DirectionThe gold rally extending nearly 30% off the January low before exhausting into confluent resistance at 5520-5615- a region defined by the 2.618% extension of the broader December 2024 advance and the 1.618% extension of the August rally.
Gold marked the largest single-day decline in history the following day with XAU/USD plunging more than 21% off the high before exhausting near 4500 into the February open. The subsequent recovery has extended more than 15.5% off the monthly low with XAU/USD now approaching Fibonacci resistance at the 61.8% retracement of the most recent decline at 5142. Looking for possible inflection off this level in the days ahead IF reached.
It is worth noting that gold is likely to remain rangebound for some time as the markets digest this recent washout. The last two significant pullbacks (April -10.8% and October -11.3%) held the decline ranges for more than a month before resumption and we could be in for a few more weeks of chop here.
XAU/USD is trading within the confines of an ascending pitchfork extending off the monthly low with the median-line further highlighting initial resistance near 5142. The initial weekly opening-range is extremely tight – look for a breakout to offer guidance here. A topside breach above the median-line would expose the 100% extension of the advance off the monthly low at 5343- strength beyond this level would suggest a more significant low is in place and dispel the notion of this recovery being a simple correction within a larger decline. A close above 5615 will ultimately be needed to fuel the next major leg of the gold advance toward 6K.
Monthly open support rests at 4894 and is backed by the February low-day close and the 61.8% retracement of the February range at 4660/66. Key support rests with the 2025 high-day close (HDC) at 4500/33 and losses beyond this zone would suggest a larger correction is underway. Subsequent support rests with the objective yearly open at 4319.
Bottom line: Gold is in consolidation after last month’s massive selloff and prices could remain sideways here for the next few weeks before asserting the next move. From a trading standpoint, losses should be limited to 4500 for the broader uptrend to remain viable with a breach / close above 5343 needed to suggest a more significant low is in place and threaten another run at the highs.
-MB
Fibonacci

Dow Could Be Gearing Up for a Run Toward 50,000We’ve seen it before—and we might be seeing it again . The Dow Jones is showing a familiar pattern, and here’s what’s happening:
The index has been repeatedly hitting the 1.618 Fibonacci extension from previous ranges.
Right now, we’re approaching the 100% extension between the last swing high (~45,000) and swing low (~36,600).
If the Dow breaks above that previous high at 45,000, there's a good chance we’ll see the pattern repeat—with 50,000 as the next target.
It’s all about that breakout confirmation. Until then, we watch and wait.
This market has a memory—let’s see if it chooses to repeat it again.

Eose long zone Eose presents a potential triple bottom and golden pocket pivot here. This is a high beta stock that loves to rip harder than the market, very volatile. My alarm went off and I bought some August 16$ calls here. The patient will be rewarded.

GOLD(XAUUSD): Price is in AB=CD Pattern! What's next?Dear Traders,
Following a price rally to $5600, a clearer indication of future price movement emerged. However, the price corrected itself after dropping to the unexpected $4400 level. Since then, it’s resumed natural price movement and currently forms an AB pattern. This pattern is on the verge of developing into a CD pattern, potentially lifting the price from $4967 to $5400 in the next move.
Consider entering when the price experiences a smaller correction. Given the current market’s significant volatility, strict risk management is recommended. If you enjoy our work, please like and comment for more insights.
Team SetupsFX_

ABEVTechnical Analysis:
Surge in volume at the end of an ABC impulse
Deep bullish divergence on the MACD
Accumulation is taking place at the 0.786 Fibonacci retracement level

State Bank of India SBIN– Bullish Buy on Dips StrategyTimeframe: Daily
Trend: Primary uptrend intact
SBI continues to trade within a rising trend structure, respecting the ascending trendline formed from previous higher lows. Price has retraced after a strong impulse move and is currently hovering near a confluence support zone, making this a classic bullish continuation setup rather than a trend reversal.
🔍 Technical Observations
Price is holding above the rising trendline, confirming structural strength.
The current pullback aligns with the Fibonacci Golden Zone (0.5 – 0.618), which historically acts as a high-probability demand area.
0 Fibonacci / prior breakout zone is acting as immediate support, indicating healthy retest behavior.
Volume expansion on the previous upside move suggests institutional participation, while current consolidation reflects profit booking rather than distribution.
📌 Trade Plan (Risk-Managed Approach)
Initial Entry: Add less quantity first near current levels to test price acceptance.
Add-on Strategy:
Add more quantity as and when price approaches the rising trendline
Further accumulation near 0 Fibonacci & Golden Zone support, provided price shows stability.
This staggered entry helps reduce timing risk and improves average cost.
🎯 Upside Targets
Target 1: Previous resistance zone
Target 2: Upper range breakout
Expected Upside: ~8–10% if momentum resumes with volume expansion
🛑 Invalidation / Risk Management
A daily close below the rising trendline and 0.618 Fib support would weaken the bullish thesis.
Traders should keep position size aligned with risk tolerance and trail stops as price moves higher.
⚠️ Risk Disclosure
This analysis is for educational purposes only and not financial advice. Stock market investments are subject to market risk. Prices can move against expectations due to broader market conditions, news, or volatility. Always use proper risk management, position sizing, and consult a qualified financial advisor before making trading or investment decisions.

VETUSDT Long-Term Structure Favors Further DownsideVET remains structurally bearish on the weekly timeframe, respecting a long-term descending channel. Price continues to print lower highs and lower lows, with momentum favoring further downside. A brief corrective bounce toward the channel midline is possible, but unless reclaimed, it is likely to act as resistance. The broader expectation remains continuation lower toward the highlighted accumulation zone around the lower channel boundary, where long-term demand is anticipated. Trend remains bearish until proven otherwise.

UJ ShortM/W: Uptrend, hitting resistance level
D: Uptrend, respecting the lows
4H: Downtrend, price broke trend and retraced 61.8% on major FIB
1H: Uptrend, price is consolidating and resisting previous zone + BEARISH divergence on RSI.
CURRENTLY: I'm looking for price to go short to previous support/resistance zone
Exits
TP1 @ minor support/resistance
TP2 @ previous major resistance zone

GU ShortW: Uptrend, respecting the lows
D: Uptrend, price made a new high
H4: Downtrend, price hit -27 on 4H
1H: Downtrend, price hit retraced 50% so far
CURRENTLY: I'm looking for price to go short to previous support / resistance area @ H4 -61.8 FIB

GBPNZD RE ENTERED - SHORTS CONTINUED INTO THE ABYSSWe can see that GBPNZD has been in a strong downtrend, and found support and has been range trading between 2.25908 and 2.28024 recently it has broken support at 2.25908.
Today we have seen the pair retrace back to the 0.50 fib level expecting hte downside to resume from here
I am expecting the next leg down to continue TP - 2.22961

eBay - Breaking Down the StructureLet’s take a look at eBay stock from the very beginning up to today:
What do we see?
A completed wave structure and an almost completed Fibonacci structure as well.
The peak came in at 101 , which is close to the 105 Fibonacci level.
Now let’s zoom in on the larger fifth wave:
The move started in late September 2022, and this structure also looks complete.
The corrective move from mid-August 2025 confirms this.
A push toward 105 looks unlikely, though it can’t be completely ruled out.
Either way, the broader bias remains to the downside.
For now, let’s focus on the smaller timeframe,
specifically the fifth wave on a lower degree.
Key targets:
75
71
66
The potential move from the current level is 14-23% .
On a broader scale, a sizable correction within the fifth wave is expected.
---
Subscribe and leave a comment.
You’ll get new ideas faster than anyone else.
---

BMW is in a clear weekly uptrend, with price stair‑stepping highBMW is in a clear weekly uptrend, with price stair‑stepping higher as investors lean into its improving earnings profile, EV rollout, and capital returns.
Management expects strong demand into 2026 and is backing that view with a sizeable 2025–2027 share buyback programme, which supports EPS growth and underpins the trend while Neue Klasse EV models ramp.
This idea treats BMW as a trend‑following long!

NZDUSD LONGSSimple price flow, change of fractal structure and now let's wait for the 1H pullback to retest 4H EMA

Solusdt relief rally before major dropSOL has already fulfilled its mid-term bearish projection, with the bearish pennant target achieved. The current expectation is a relief rally toward the mid-term supply zone around $145, followed by a continuation lower toward the projected downside target.

EURUSD LONGBullish bias on EURUSD.
H1 BPR at the 0.618 Fibonacci level, within an overall bullish trend.
The Daily 0.618 has already been reached.
After a strong bullish expansion, the market is currently accumulating.
There is a possibility that price continues higher without a deep retracement, however my preferred scenario is a pullback into the Fibonacci zone, targeting a move toward 1.23 and 89 on the DXY.

Ethereum - Looking To Sell Pullbacks In The Short TermH4 - Strong bearish move.
No opposite signs.
Currently it looks like a pullback is happening.
Expecting bearish continuation until the two Fibonacci resistance zones hold.
If you enjoy this idea, don’t forget to LIKE 👍, FOLLOW ✅, SHARE 🙌, and COMMENT ✍! Drop your thoughts and charts below to keep the discussion going. Your support helps keep this content free and reach more people! 🚀

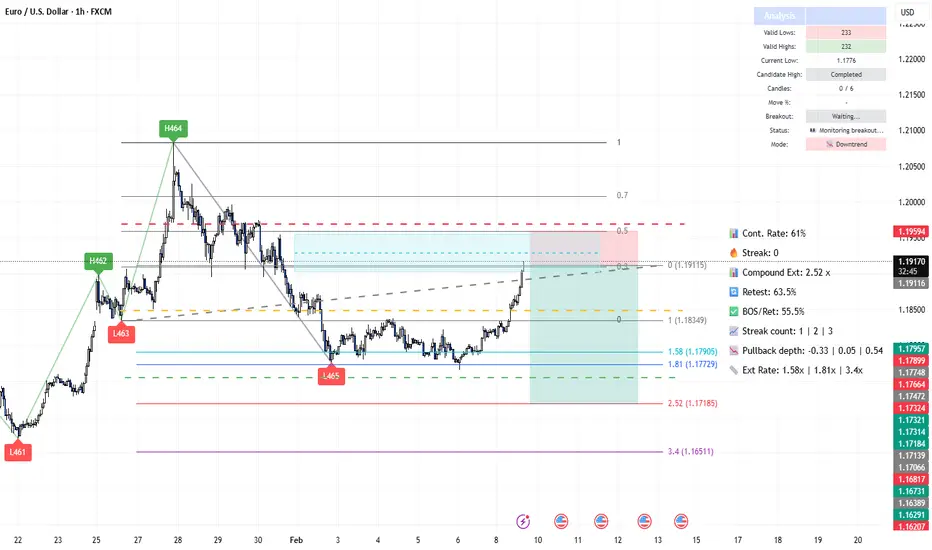
EUR/USD Market Analysis: Macro + Structure [MaB]1. The Macro Context (The "Why") 🌍
Hi traders! Before looking at the candles, let's look at the money.
My fundamental scoring table is giving us a clear signal: we have a -2 differential, pointing toward a Bearish (Moderate) bias that we simply can't ignore. 🏦
Key Factor Analysis:
🏦 Current Rates: Explanation: USD Fed funds at 3.75% offer a significant carry advantage over the BCE at 2.15%. Score EUR: 0 | Score USD: +1
🌍 Economic Regime: Explanation: EUR is in a Reflation phase with weak growth, while the USD enjoys a "Goldilocks" Expansion with solid GDP. Score EUR: +1 | Score USD: +1
📊 Rate Expectations: Explanation: ECB remains neutral with a prolonged hold, while the Fed shows a dovish post-cut trend. Score EUR: 0 | Score USD: -1
⚖️ Risk Sentiment: Explanation: Market sentiment is currently neutral for both currencies with no significant bias. Score EUR: 0 | Score USD: 0
🏛️ COT Score: Explanation: Speculators are heavily long on EUR at maximums, while USD shorts are being covered, suggesting a sentiment improvement. Score EUR: +2 | Score USD: +1
Currency Score Summary: Total Score EUR: +2 (Mixed) Total Score USD: +4 (Balanced)
Synthesis:
💡 EUR (Weak, Score +2): Mixed situation with stagnant growth (0.7%) and manufacturing PMI in contraction (<50).
💡 USD (Strong, Score +4): Solid growth (2.1%) and expanding PMIs, supported by positive employment data from jobless claims.
Conclusion: Given this fundamental backdrop, we are strictly looking for Short setups. Going against this bias would be statistical suicide. 🚫
2. The Technical Setup (The "Where") 📉
Timeframe: 1h | Pair: EUR/USD
The SMC Market Structure + Price Zones indicator has confirmed our statistical edge.
Here’s the probabilistic data from the dashboard:
🚀 Continuation Rate (61%): We are currently above the 60% threshold.
This confirms a healthy directional trend where continuation has a much higher probability than a reversal.
🔥 Streak Analysis (0): We are currently on impulse number 0 (Waiting for breakout).
Expected Streak: 1 | 2 | 3
Remaining Moves: High. This indicates a Young trend. The statistical range suggests we are at the start of a potential new bearish leg.
🔄 Retest & Reaction:
Retest Prob (63.5%): The probability of the price returning to test the zone after a BOS.
BOS/Ret Rate (55.5%): Once inside the zone, this is the probability of a positive reaction leading to a new BOS.
🎯 Extension & Projection:
Extension Range: The expected extension for this single leg is between 1.58x and 1.81x (Expected: 1.58x).
Compound Extension (2.52x): This is the total projected move based on the remaining expected impulses.
3. Execution Plan on Chart 🎯
Moving over to the charts, we are using these statistics to define our operational levels:
📍 Entry and Stop Loss: We are placing a limit entry within the Supply Zone 1h (Red/Grey Band) .
The stop loss is tucked a few pips outside the zone to protect against structural invalidation.
🏁 Statistical Take Profit: Instead of an arbitrary target, we are leveraging the Compound Extension .
We project the target at 2.52x relative to the pullback zone height.
This allows us to capture the full extension projected by the algorithm. 🏆
Trade Parameters:
💰 Entry Price: 1.19116
🛡️ Stop Loss: 1.19594
🏆 Take Profit: 1.17150
⚠️ Disclaimer: This analysis is based on a proprietary algorithm and is shared exclusively for educational and didactic purposes.
It does not constitute financial advice or investment solicitation in any way. Trading involves significant risk.
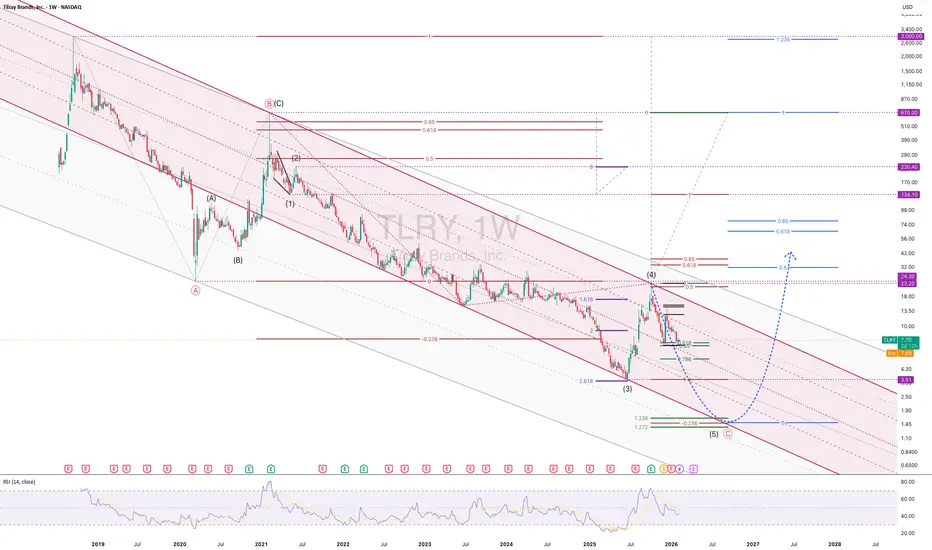
TLRY [TILRAY] EWP FIB TC ANALYSIS WEEKLY TFTLRY – Macro Elliott Wave Structure
The 2018 IPO spike to the split-adjusted $3000 represents a speculative blow-off and is not counted as part of a standard Elliott impulse. This type of parabolic launch is treated as an exogenous event, followed by a full corrective cycle.
The true Elliott structure begins after the collapse from the IPO high into the 2019–2020 lows:
• Cycle / Primary A: 2018–2020 impulsive liquidation from IPO mania
• Cycle / Primary B: 2020–2021 corrective recovery (ABC structure, bull trap)
• Cycle / Primary C: 2021–present extended decline, now in its final stages
Primary C is subdividing into Intermediate (1)–(5). Intermediate (3) likely terminated near 3.51, followed by the current Intermediate (4) relief rally. The advance from 3.51 remains corrective (overlapping internals, no Wave-3 acceleration, RSI flattening), supporting the view that Intermediate (5) is still ahead.
Primary C has not yet achieved typical Fibonacci symmetry versus Primary A. Confluence for Intermediate (5) termination currently clusters at $1.50
Base case (~70%):
Intermediate (5) completes into the $1.50 region, finishing Primary C and setting up a multi-month reversal.
Post-C expectations:
• Initial rebound: 3.2–3.6
• Larger retrace: 6–8 (0.382–0.5 of Primary C)
• Sustained acceptance above 13–15 would confirm a higher-degree trend change.
Alternate (~30%):
Only a clean impulsive advance (5 up on lower TFs) with acceptance above former resistance (~6) and expanding momentum would allow 3.51 to be reconsidered as the Primary C low.
Timing (rough guide):
Based on channel symmetry and prior C-wave duration, Intermediate (5) is likely to resolve within 4–12 weeks, with volatility expected to increase into termination.
Until impulsive upside structure appears, rallies are treated as corrective moves inside Primary C.
Like and follow for more charts like this.
GOLD - Consolidation above 5000. Awaiting NFP...CAPITALCOM:GOLD consolidates above $5,000 in anticipation of key data from the US. Economic data may set the medium-term tone for the market. A long squeeze before the move cannot be ruled out...
Central banks continue to buy metal, expectations of a more dovish Fed policy weaken the dollar. Easing tensions in the Middle East and growing risk appetite in global markets support the gold trend.
Ahead of us are the Employment Report (NFP) on Wednesday and
Inflation Data (CPI) on Friday .
These data will determine further expectations for Fed rates and the direction of the dollar.
Gold is in a state of equilibrium ahead of the release of critical data. A sustained breakout from the current range ($5000-5100) is likely only after the release of US employment and inflation reports, which will clarify the trajectory of the Fed's monetary policy.
Resistance levels: 5047, 5098, 5100
Support levels: 4946, 4902, 4811
The zone of interest and liquidity within the current movement is the 4950-4940 area. There is a possibility that during the transition from the European to the US session, the market will test this area before growing. However, a premature breakout of 5047 and a close above 5050 could trigger a rally to 5150-5250.
Best regards, R. Linda!

EURUSD - Breakthrough of consolidation resistance. Growth?FX:EURUSD is ending its correction. A breakout of resistance and bullish momentum are forming. If the market maintains its current direction, the price could reach 1.197-1.210 in the medium term.
The dollar is falling due to the rise of the Japanese yen after early parliamentary elections, the impact of which may be medium-term.
After the dump, the currency pair formed a consolidation that stopped the local downtrend. The weakening of the dollar triggered a breakout of resistance. The exit from consolidation and the bearish wedge is a fairly strong bullish signal. The market may form a retest of 1.1829 before breaking through 1.1875. If the bulls break through resistance, the medium-term bullish trend may continue.
Resistance levels: 1.1875, 1.1972
Support levels: 171829, 1.1778, 1.1769
After consolidation, the market has entered a distribution phase. Given the current trend, the weak dollar, and the current market phase, there is potential for continued growth.
Best regards, R. Linda!

GOLD before Non-Farm: Sideways or a Trap?🌍 Macro Background
Continuing to monitor U.S. – Iran tensions and whether escalation occurs.
Japan: maintaining a weak JPY → USD remains supported.
A heavy news week ahead:
FED speeches (today)
Labor market data
Inflation data later this week
👉 Market sentiment remains cautious, waiting for a clearer directional catalyst.
📈 Trend & Structure
Overall price structure remains unchanged: Gold is in the final phase of a corrective rebound.
Upside momentum still exists, but limited, while reversal risk is increasing.
Price is consolidating near resistance → sideways conditions are favored.
🔴 Resistance – 🟢 Support
🔴 Resistance: 5,050 – 5,100
🟢 Near support: 4,980 – 4,950
🟢 Additional support: 4,930 – 4,936
🟢 Deeper support: 4,880 – 4,850
📊 Trading Scenarios
✅ Primary scenario (higher probability): Sideways – range trading
Sell reactions around 5,050
Condition: rejection candles / bearish confirmation
Buy technical pullbacks at support zones
Focus on M15 – H1, quick and disciplined trades.
⚠️ Alternative scenario (lower probability): Bullish breakout
Mandatory condition: H1 close clearly above 5,100
Only then consider buying the breakout.
🧠 Risk Management
Avoid holding large positions during:
FED speeches
Labor market & inflation releases
No FOMO — wait for candle confirmation.

NQ Power Range Report with FIB Ext - 2/10/2026 SessionCME_MINI:NQH2026
- PR High: 25395.50
- PR Low: 25328.00
- NZ Spread: 151.0
Key scheduled economic events:
08:30 | Retail Sales (Core|MoM)
Session Open Stats (As of 12:45 AM)
- Session Open ATR: 499.95
- Volume: 34K
- Open Int: 259K
- Trend Grade: Long
- From BA ATH: -5.4% (Rounded)
Key Levels (Rounded - Think of these as ranges)
- Long: 26691
- Mid: 25544
- Short: 23372
Keep in mind this is not speculation or a prediction. Only a report of the Power Range with Fib extensions for target hunting. Do your DD! You determine your risk tolerance. You are fully capable of making your own decisions.
BA: Back Adjusted
BuZ/BeZ: Bull Zone / Bear Zone
NZ: Neutral Zone

Gold at Key Resistance — Is This the End of the Correction?Gold( OANDA:XAUUSD ) is currently moving near its resistance zone($5,191-$5,097).
From an Elliott Wave perspective, it appears Gold is completing the microwave 5 of the main wave C, with the corrective upward structure likely a Zigzag correction (ABC/5-3-5).
Also, we can see a negative Regular Divergence(RD-) between two consecutive peaks.
I expect that upon entering the resistance zone($5,191-$5,097), gold will likely resume its decline and reach at least the targets I’ve identified on the chart.
First Target: $4,953
Second Target: $4,827
Third Target: $4,703
Stop Loss(SL): $5,221
Points may shift as the market evolves
What’s your view on gold’s trend this week? I’d be happy if you share your thoughts in the comments!
💡 Please respect each other's opinions and express agreement or disagreement politely.
📌 Gold Analyze (XAUUSD), 1-hour time frame.
🛑 Always set a Stop Loss(SL) for every position you open.
✅ This is just my idea; I’d love to see your thoughts too!
🔥 If you find it helpful, please BOOST this post and share it with your friends.
