DOGEUSDT → Correction to 0.246. The hunt for liquidity BINANCE:DOGEUSDT.P attempted to realize its potential after breaking out of the downward resistance. After updating the local maximum to 0.27, the price entered a phase of correction and consolidation...
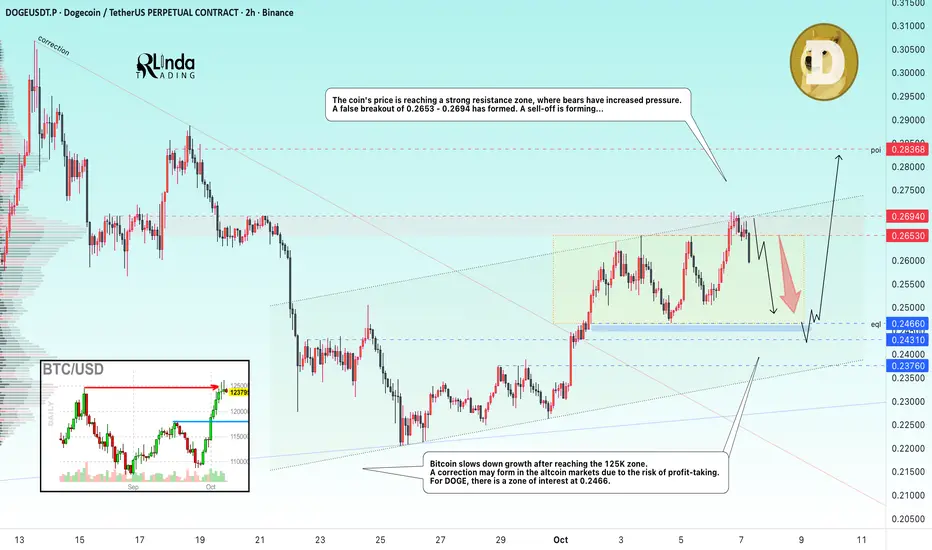
Bitcoin slows down its growth after reaching the 125K zone. A correction may form in the altcoin markets due to the risk of profit-taking. For DOGE, there is a zone of interest at 0.2466
The price of DOGE has reached a strong resistance zone, where bears have increased pressure. A false breakout of 0.2653 - 0.2694 has formed. A sell-off is forming...
Resistance levels: 0.2653, 0.2694
Support levels: 0.2466, 0.2431, 0.2376
Against the backdrop of market correction, a downward rally associated with panic selling is forming. The support zone that is of interest to the market is 0.2466, and this zone is quite capable of stopping the decline. A false breakdown and holding the price above 0.246 - 0.243 may renew interest in growth.
Best regards, R. Linda!
Fibonacci Retracement
Can NASDAQ Hold 24,600 and Push to New Highs?Hey Traders, in tomorrow’s trading session we are monitoring NAS100 for a potential buying opportunity around the 24,600 zone. NASDAQ remains in an uptrend and is currently in a correction phase, with price approaching a key support/resistance level at 24,600.
Structure: The broader trend is bullish, with price moving within an ascending channel.
Key level in focus: 24,600 — a critical support area aligning with the lower boundary of the channel.
Next move: Holding above this level could set the stage for a rebound toward 25,100, which represents the channel’s upper resistance and potential higher high formation.
Trade safe,
Joe.

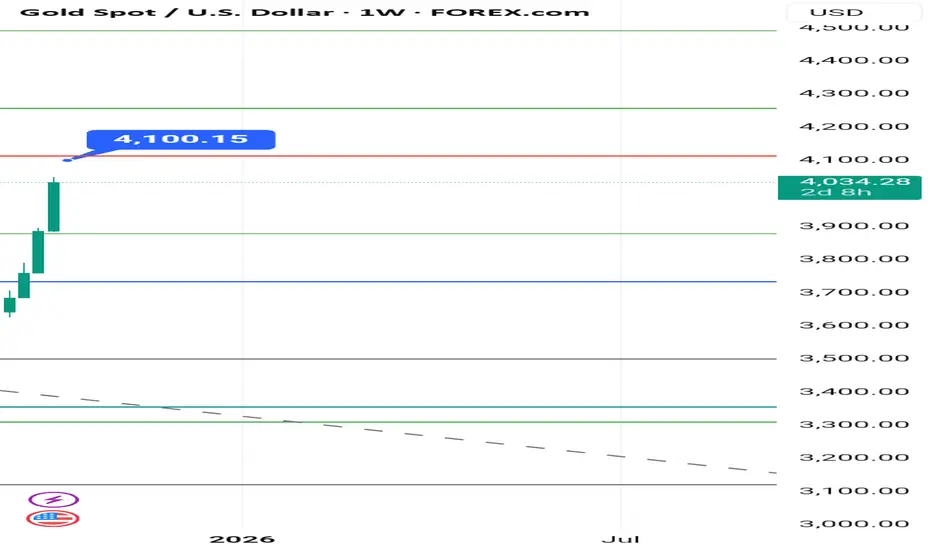
Gold Next Target: $4,100 — Key Level Ahead!The next key zone — and possibly the next target for gold — is $4,100. Let’s see how the price reacts to this level
ETHFIUSDT → Correction to support consolidation. Rally?BINANCE:ETHFIUSDT is correcting after updating its local maximum to 1.9382. The breakout of the 1.6775 zone is an attempt to start distribution after a long consolidation. Will the bulls hold this zone?
Bitcoin is correcting after a false breakout of resistance. Against this backdrop, the entire cryptocurrency market is declining. However, the trend is bullish and the fundamental background is positive. The end of the correction may resume growth in the market.
ETHFI on the daily timeframe is trying to move into a distribution phase after 5-6 months of consolidation. The trend is upward, and after breaking through resistance, a correction to the liquidity zone of 1.6775 is forming. A false breakdown, a change in market imbalance, and consolidation above 1.6780 could increase buyer interest, which in turn could lead to growth.
Resistance levels: 1.8980, 1.9382
Support levels: 1.6775, 1.5343
The chart shows two key levels - 1.6775 and 1.5343. If the bulls hold their ground above the nearest level of 1.6775, this could lead to a rebound and growth, which in turn would confirm the continuation of the distribution phase. Otherwise, the market may test the POC zone at 1.5343, and liquidity capture may in turn trigger growth.
Best regards, R. Linda!

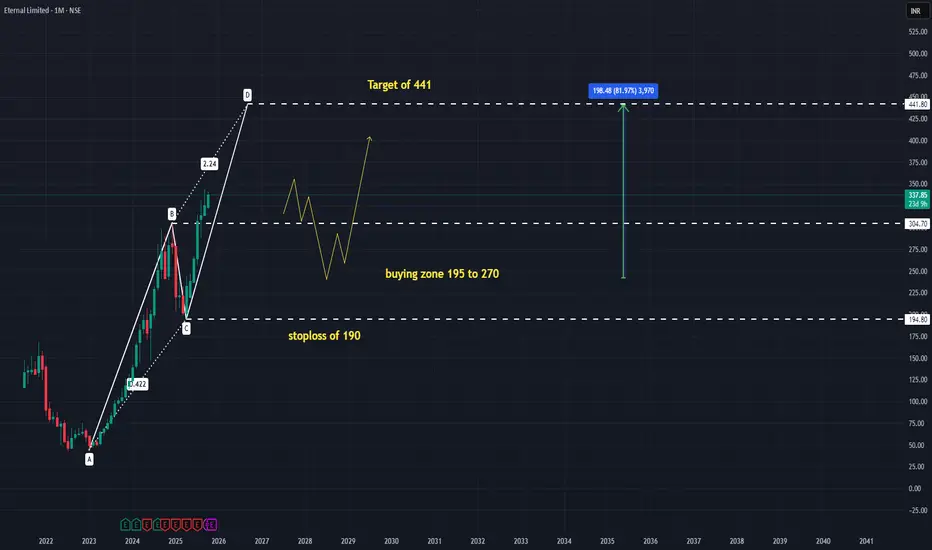
ETERNAL ABCD LONG PATTERN ACTIVATEDCORRECTION REQUIRED FOR SAFE ENTRY
and small stoploss,
entry will be updated the proper price structure if correction happens
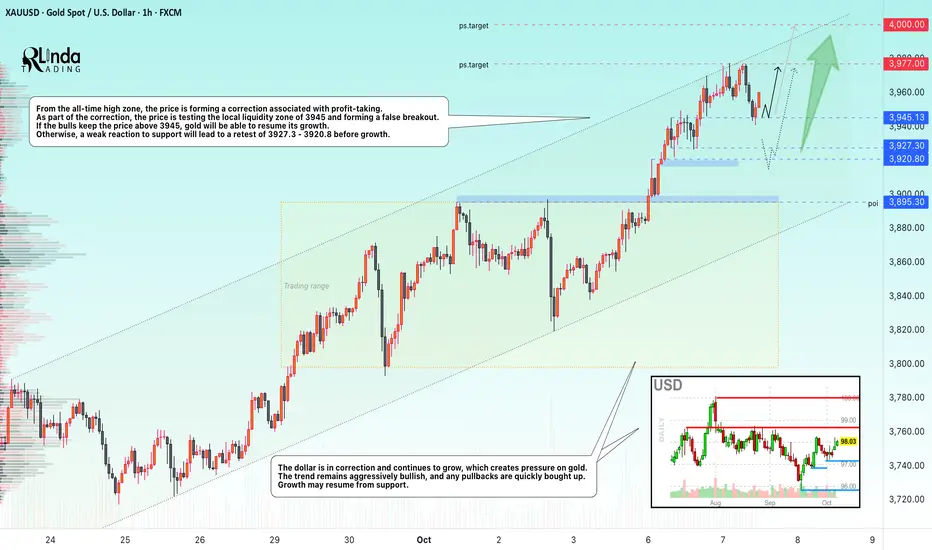
GOLD → The correction will trigger growth to $4,000.FX:XAUUSD hit a new record high of nearly $3,977 and entered a correction phase to build up potential before further growth. Despite the local strengthening of the dollar, the upward trend continues thanks to a combination of macroeconomic and geopolitical factors.
Key supporting factors: Ongoing US government shutdown: The Democrats' fifth unsuccessful attempt to resolve the issue increases uncertainty. Markets expect two interest rate cuts before the end of the year.
China has been increasing its reserves for the 11th consecutive month, and global central banks bought +15 tons in August.
No bearish triggers: Any correction is seen as a buying opportunity.
Gold maintains its upward momentum. Breaking through $4,000 seems a matter of time if current drivers remain in place. Key risks are an unexpected resolution to the shutdown or hawkish signals from the Fed.
Resistance levels: 3977, 4000
Support levels: 3945, 3927, 3920
Technically, a false breakdown of support could lead to continued growth. A retest of 3945 is possible; a weak reaction could trigger a deeper correction, for example to 3927, before further growth.
Sincerely, R. Linda!
AUDUSD Eyes 0.65900 as Gold Nears Record HighHey Traders, in the coming week we are monitoring AUDUSD for a potential buying opportunity around the 0.65900 zone. AUDUSD remains in an uptrend and is currently in a correction phase, with price moving toward this key support/resistance level.
Structure: The broader bias is bullish, with price retracing toward trend support.
Key level in focus: 0.65900 — an important area where buyers may look to re-enter.
Fundamentals: Gold continues to rise and is nearing a fresh ATH, supported by a bearish US Dollar bias. Given the positive correlation between AUDUSD and Gold, further upside on the pair remains likely.
Next move: Monitoring price reaction at 0.65900 to assess whether the trend resumes higher.
Trade safe,
Joe.

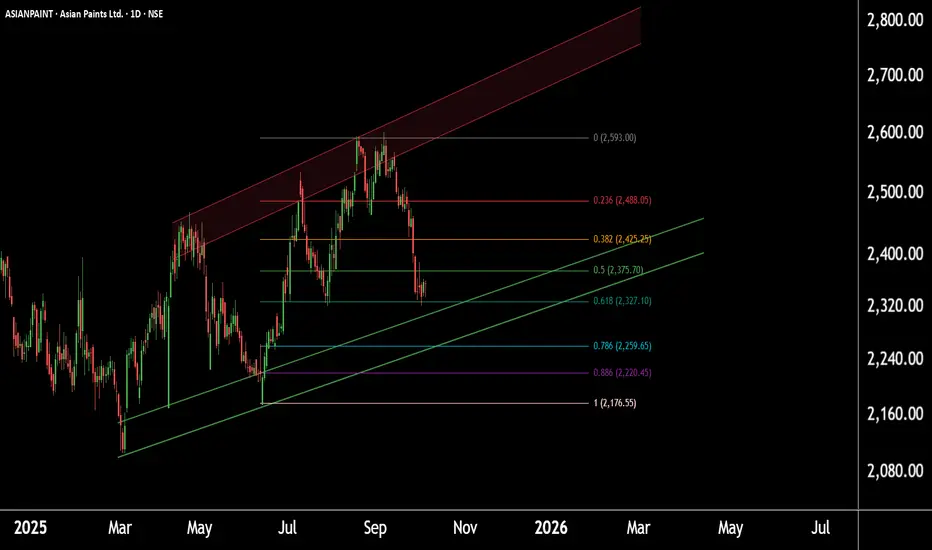
Asian Paints at Demand Zone —Eyes on a Potential Reversal Setup!Asian Paints – Daily Chart Analysis
Chart Timeframe: Daily chart observation.
Current Price Zone: Trading near the Fibonacci golden zone around 2320.
Support Zone: Strong support identified between 2240–2260, aligned with the channel base and Fibonacci retracement.
Technical Confluence: Both channel and Fibonacci levels confirm 2260 as a crucial support level.
Outlook: If these two zones hold, we may see higher prices in Asian Paints in the upcoming sessions.
Thank you.
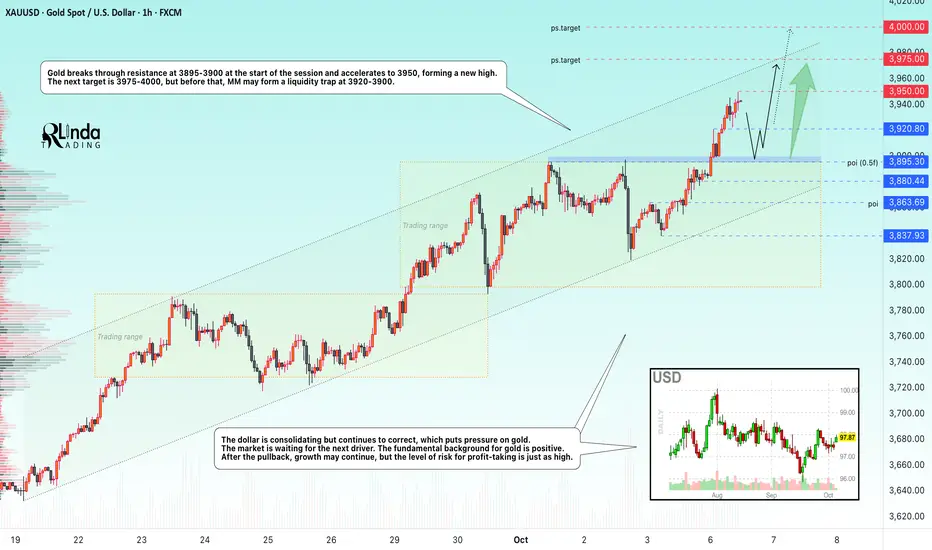
GOLD → Rally to the psychological target of $4,000FX:XAUUSD hit a new all-time high of $3,950 (+1.7% for the day at the time of writing), continuing its move toward the psychological $4,000 mark. The growth continues despite the strengthening of the dollar and the rally in the stock markets.
Key drivers: The ongoing US shutdown (now in its seventh day): The lack of progress in negotiations and the risk of mass layoffs of civil servants are increasing demand for safe havens.
The probability of a rate cut in October is 100%, and in December, 94%. Weak labor market: Trump's statements blaming Democrats for job losses are fueling pessimism.
Fundamentally, gold remains on an upward trend thanks to the perfect combination of US fiscal risks and soft monetary policy. A breakout to $4,000 seems only a matter of time if the shutdown is not resolved.
Resistance levels: 3,950, 3975, 4000
Support levels: 3920, 3900, 3880
Technically, before reaching the 4000 mark, MM may form a liquidation, especially against the backdrop of the FOMC meeting on Wednesday and the Fed on Thursday. Key areas of interest before growth: 3920 and 3900, behind these areas lies a pool of liquidity that will not prevent the accumulation of energy before the next bull run.
Sincerely, R. Linda!
USDJPY → Gap and retest of resistance on a neutral trendThe Japanese yen opens with a gap in the Asia-Pacific session and forms a distribution, within which it tests the resistance zone of 149.93 - 150.79.
The dollar is rebounding again, provoking a corresponding reaction in the markets. However, based on fundamental data, the decline may continue after the pullback.
Gap in USDJPY, distribution and entry into the resistance zone at high speed, there may not be enough potential for continued growth. There is no trend, the price is in a sideways market. A false breakout of 149.93 may trigger a correction towards the lower boundary of the gap.
Resistance levels: 149.93, 150.79
Support levels: 148.76, 148.09
If the currency pair is unable to continue growing, then a false breakout of resistance can be considered. A return of the price to the range on D1 may trigger a decline to support.
Best regards, R. Linda!

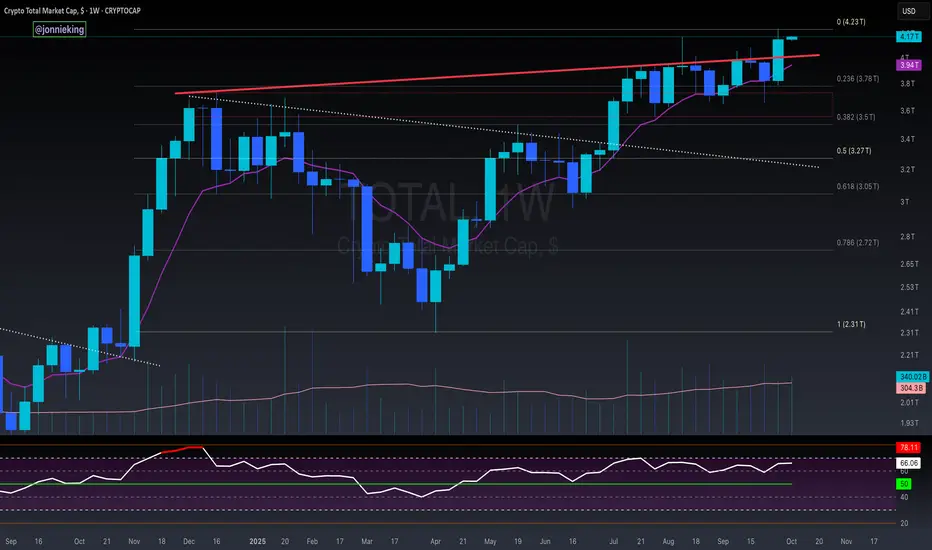
$TOTAL Crypto Market Cap Closes Week ATHCrypto CRYPTOCAP:TOTAL Market Cap Closes the Week at ATH.
Bulls need to close these next couple weeks above
$3.9 - 4.1T to really build momentum.
Falling Soon To 0.618 Fibonacci W LevelNow the market is over-extended on the 1 Week time-frame, so i suggest to open a short possition (here i share mine). We have confirmations of this scenario at technical indicators, such as: 1 Day RSI, 4 Hours Ichimoku Clouds, 1 Hour TEMA-Supertrend, and 1 Day Bollinger Bands. I used Fibonacci retracement to measure this fall to the most probable level. I had in consideration that this a new market and that it has been growing a lot without any important correction since 5 weeks ago on the 1 Week time-frame.
Setup:
Break Even: 0.1295
Liquidation: 0.1360
Stop Loss: 0.1308 (1.00%)
Take Profit: 0.0860
If Concluded Successfully:
33.59% of ROI

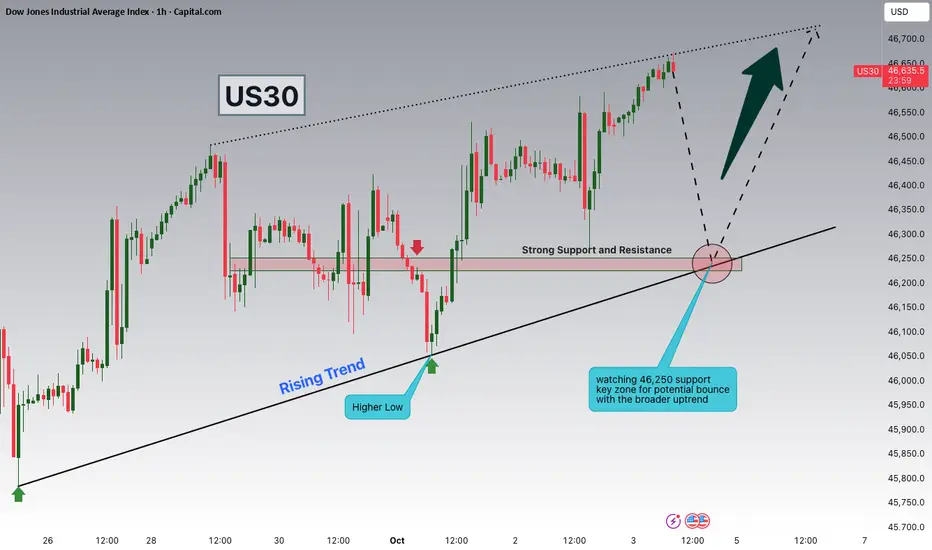
Dow Jones Watching 46,250 Support for Potential ContinuationHey Traders, in today’s trading session we are monitoring US30 for a potential buying opportunity around the 46,250 zone. The Dow Jones is trading in an uptrend and currently in a correction phase, with price moving toward this key support/resistance level.
Structure: The broader trend remains bullish, with pullbacks serving as corrections within the uptrend.
Key level in focus: 46,250 — an important support zone where price could stabilize and attract buyers.
Next move: Holding above 46,250 could open the door for continuation toward higher highs, while a breakdown would suggest a deeper retracement.
Trade safe,
Joe.
BTCUSD 1W chart review• Currently BTC is at ~ USD 123,000 (+1.97%).
• Strong support visible in the area of 113 400 USD and USD 106,800.
• The next resistance is USD 124,500, and the next important is USD 133,500.
2. Trend:
• You can see the growing trend line (orange), which supports increases.
• The weekly candle is green and quite strong - suggests that the demand persists.
3. Medium walking (SMA / EMA):
• SMA 50/200 shows the Golden Cross (EMA CROSS 50/200), which is a long -term bull signal.
• SMA (red) is below the price → pro-rectification signal.
4. RSI (Relative Strength Index):
• Currently approx. 60 → Neutral-BYCZECZE territory.
• Not bought yet (> 70), so there is space for further increases.
5. MacD / Histogram:
• The histogram begins to grow green - growth moment is growing.
• This confirms that the buyers are taking over the initiative.
⸻
📈 Scenarios:
1. Bull (greater likelihood at the moment)
• If BTC pierces and stays above USD 124,500, the goal may be USD 133,500.
• Breaking over 133K opens the road even to around 140k.
2. Bear
• If the price does not pierce 124.5k and reject the resistance, it may drop to $ 113,400.
• Punction below this zone will give a signal of declines up to USD 106,800.

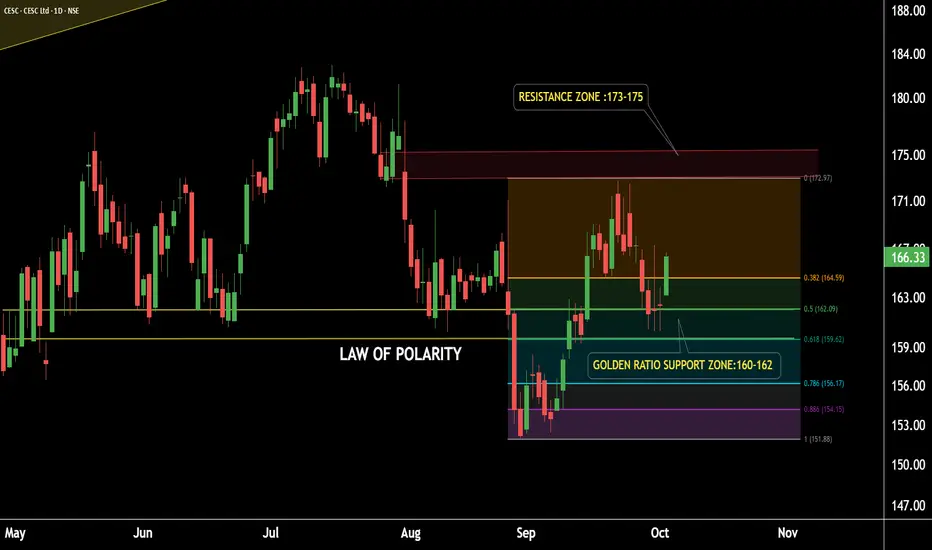
CESC on Fire - Strong Momentum Building !CESC Daily Timeframe Analysis
CESC is sustaining above its Law of Polarity (LOP) after a breakout.
The stock has successfully retested the LOP and is showing strength.
This level also aligns with the Golden Ratio Zone of Fibonacci Retracement, representing a strong support zone around 159–162.
Potential Upside Target: 172–175.
If the support zone sustains, we may see higher prices in CESC.
Thank you!
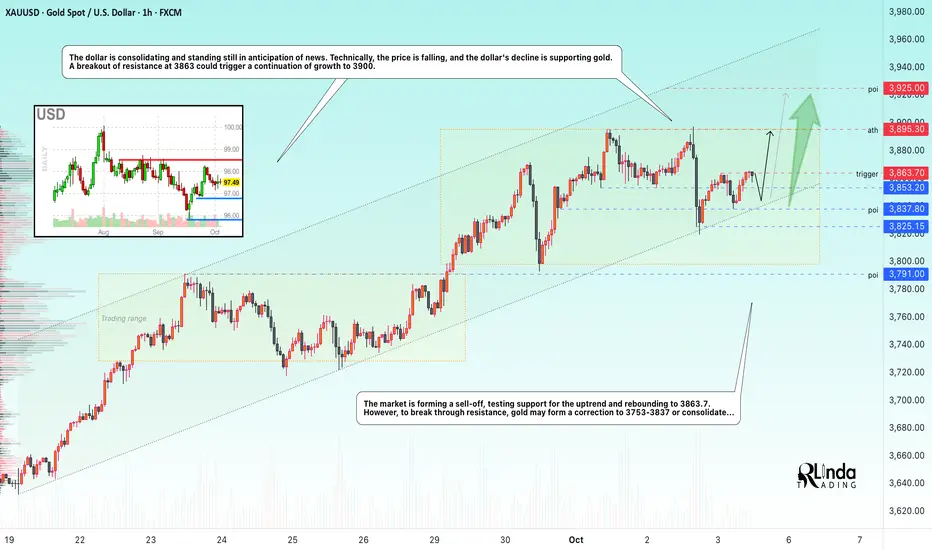
GOLD → Consolidation before continued growth. Trigger 3863FX:XAUUSD is consolidating in the range of 3837.8 - 3863.7, preparing for its seventh consecutive week in positive territory. Despite a correction from a record high of $3897, the metal remains supported by a combination of the Fed's dovish policy and geopolitical risks.
Key supporting factors: Expectations of Fed easing: Dovish sentiment continues to fuel interest in gold. Geopolitical tensions and tougher G7 sanctions against Russia. The ongoing shutdown is delaying the release of US data, increasing uncertainty.
Important: If markets ignore the shutdown, gold may face a correction.
US services data (ISM Services PMI) and Fed speeches: May adjust rate expectations.
Resistance levels: 3863.7, 3900
Support levels: 3853, 3837, 3825
Focus on the current consolidation range of 3863 - 3837. Before attempting a breakout, a retest of support may form within the consolidation. The trend remains bullish, as does the sentiment at the moment.
Best regards, R. Linda!
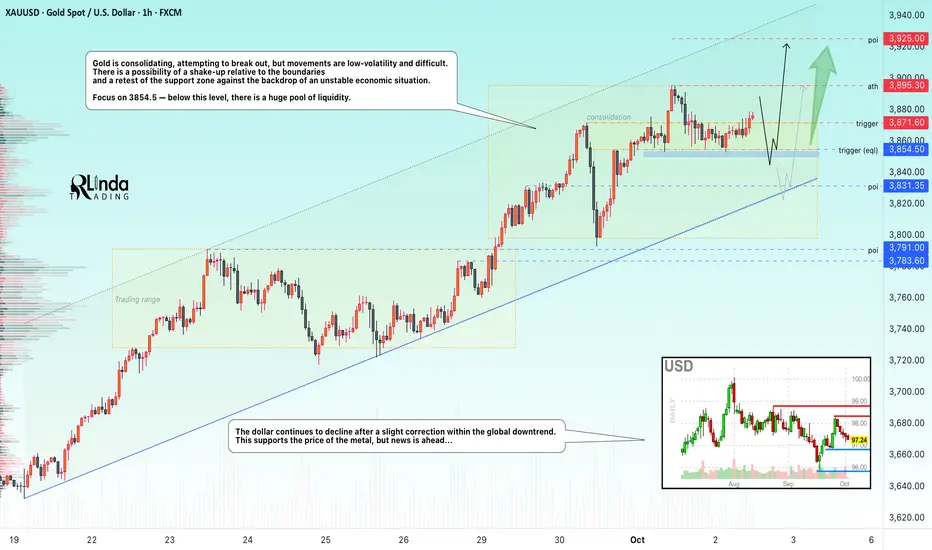
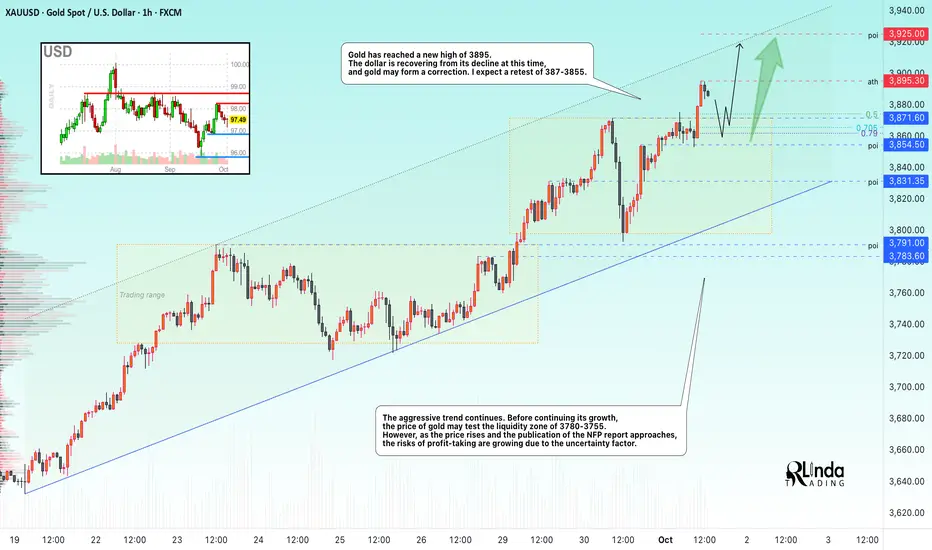
GOLD → Consolidation before growth FX:XAUUSD is correcting from 3895 and forming consolidation with a key support area at 3854, below which lies a huge pool of liquidity. A deep correction is unlikely due to ongoing risks.
The suspension of NFP publication due to the shutdown and inflation creates uncertainty for Fed policy, as does weak employment data...
However, the resumption of government work will allow the publication of data on unemployment claims and factory orders, so increased volatility in the markets is to be expected on Thursday/Friday...
The correction in gold is a temporary pause. As long as US fiscal risks, labor market weakness, and geopolitical tensions remain, the uptrend will remain intact. The $3850 level is the nearest support.
Resistance levels: 3871.6, 3895, 3900
Support levels: 3854.5, 3831.3
The most likely scenario at the moment is a long squeeze in the 3854.5 liquidity zone before continuing to rise beyond 3900...
Best regards, R. Linda!
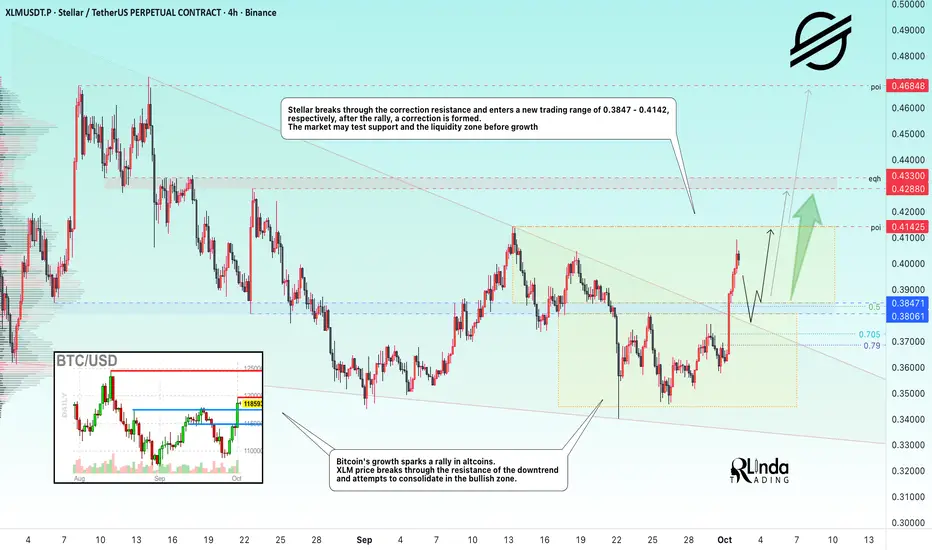
XLMUSDT → End of correction. One step away from a rally BINANCE:XLMUSDT follows the flagship currency in forming a rally and breaking out of the correction. The trend is bullish, but news is ahead. Will the bulls be able to keep the price above the risk zone?
Bitcoin's growth is provoking a rally in altcoins. The price of XLM is breaking through the resistance of the downtrend and trying to consolidate in the bullish zone.
Stellar is breaking through the resistance of the correction and entering a new trading range of 0.3847 - 0.4142, respectively, after the rally, a correction is forming. The market may test support and the liquidity zone before rising.
Resistance levels: 0.4142, 0.4288, 0.433
Support levels: 0.3847, 0.3806
As part of the correction, I expect a retest of the 1/2 zone of the formed impulse or the support zone of 0.385 (previously broken consolidation and descending wedge border).
If the bulls keep the price from falling even after the news, the coin may continue its medium-term bullish run to 0.4685.
Best regards, R. Linda!
LINKUSDT 12H1. Trend Structure
The price is in a descending channel (marked in orange) – the upper line acts as resistance, the lower line as support.
Currently, the price has rebounded from the lower boundary and is approaching the middle resistance levels.
2. Key Levels
Support:
21.73 USDT (the closest local support – already broken upwards, now being retested).
20.17 USDT (stronger support that previously halted the decline).
18.10 USDT (bottom of the channel – the main defense for the bulls).
Resistance:
23.22 USDT (local resistance, the price is very close to this level).
24.14 USDT (important horizontal resistance).
25.54 USDT (key level, a breakout of which could negate the descending channel).
3. Indicators (Stoch RSI)
The Stoch RSI is in the overbought zone (>80).
This suggests that upward momentum is slowly fading and a correction or consolidation near resistance levels (23–24 USDT) is possible.
4. Scenarios
Bullish:
If the price breaks and holds above 23.22 USDT, the next target will be 24.14 USDT, followed by 25.54 USDT (the upper boundary of the channel).
A break above 25.54 USDT could signal the end of the downward channel and a transition to a sideways/upward trend.
Bearish:
If the price rejects the 23.22 level and the Stoch RSI begins to decline, we could return to 21.73 USDT.
Losing this level will reopen the road towards 20.17 USDT and even test the lower limit of the channel (around 18-19 USDT).

USDJPY Testing 147.800 as US Govt Shutdown Pressures DollarHey Traders, in today’s trading session we are monitoring USDJPY for a potential selling opportunity around the 147.800 zone. USDJPY is trading in a downtrend and currently in a correction phase, with price approaching this key support/resistance level.
Structure: Market bias remains bearish after the recent trend shift, and the current pullback could set up continuation lower.
Key level in focus: 147.800 — acting as resistance within the correction.
Fundamentals: The US Government has officially entered a shutdown, a development that historically weighs on the US Dollar. This event adds to bearish USD pressure and could further favor downside in USDJPY.
Trade safe,
Joe.

GOLD → Correction before growth and breakthrough of 3900...FX:XAUUSD has reached a new high of 3895. The dollar is recovering from its decline, and gold may form a correction. As prices rise, economic risks associated with NFP and the US government shutdown are increasing
The suspension of NFP publication deprives the Fed and markets of a key benchmark for the labor market, increasing demand for defensive assets. The probability of a rate cut in October is estimated at 100%. Mixed JOLTS data (weak hiring) and fiscal risks are weighing on the USD, which in turn supports gold.
Thus, the shutdown creates ideal conditions for gold to rise — uncertainty about Fed policy, a weaker dollar, and a flight to safety. Breaking through the $3900 level seems a likely scenario.
Resistance levels: 3900, 3925
Support levels: 3871, 3854, 3831
A correction is forming after a small rally in the European session. Before continuing its growth, the market is entering a correction/consolidation phase. I have indicated the key support levels on the chart. If the bulls manage to keep the price above these zones, then we can expect continued growth in the short and medium term
Best regards, R. Linda!
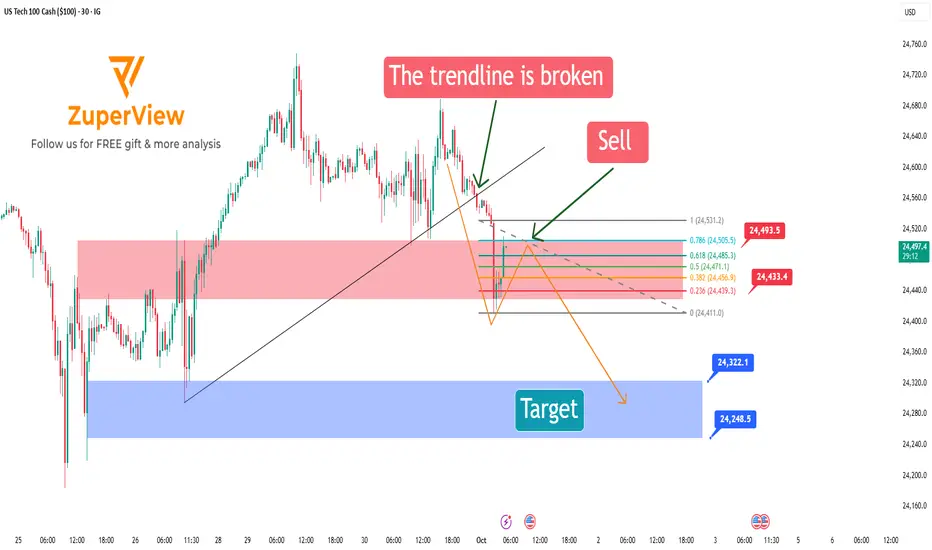
US100: Short setup using fib levels from flash candleIG:NASDAQ m30 chart analysis: short action!!
The chart signals a potential short opportunity after breaking the previous bullish structure and printing a strong bearish flash candle. The strategy focuses on shorting the pullback using fibonacci retracement measured from that candle.
🔺 1. Structure break and flash candle confirmation
The price broke below the rising trendline supporting the bullish move from sep 26 to sep 30.
Immediately after, a large bearish flash candle appeared — signaling strong selling pressure and a potential trend reversal.
This candle becomes the reference point for measuring the retracement and anticipating a continuation to the downside.
📏 2. Measuring fibonacci from the flash candle (high → low)
Apply fibonacci from the high to the low of the flash candle.
This technique identifies potential resistance zones within the context of that specific bearish move.
Key fibonacci levels to watch:
0.5: 24,472.0 | 0.618: 24,486.4 | 0.786: 24,506.9
🎯 3. Ideal entry zone: from 0.382 to 0.786
After a strong bearish flash candle, price often pulls back moderately before continuing lower.
The optimal short zone is between fibo 0.382 and 0.786:
This respects the integrity of the bearish impulse.
A retracement smaller than 0.382 may be too shallow to confirm a strong rejection.
A retracement beyond 0.786 might indicate loss of bearish momentum and invalidate the flash candle setup.
🎯 4. Bearish scenario and targets
If price reacts at the 0.382–0.786 zone and resumes downtrend, a potential ABC bearish correction forms:
A: Flash move down
B: Pullback to fib zone
C: Next impulsive leg down
Suggested take-profit levels:
🎯 Target 1: 24,322.1
🎯 Target 2: 24,248.5
🛡️ Stop-loss: above the flash candle’s high (around 24,533)
✅ Summary
After a structure break and a decisive bearish flash candle, us tech 100 is showing a clear bearish setup.
Using fibonacci measured from the high to low of the flash candle helps identify high-probability pullback zones.
📌 Entry zone: between 0.382 and 0.786 retracement — outside this range, the flash candle's power may be invalidated.
This is a momentum-following trade with defined entry, stop loss, and take profit zones.
Wait for confirmation from price action within the fib levels before entering.
Please like and comment below to support our traders. Your reactions will motivate us to do more analysis in the future 🙏✨
Harry Andrew @ ZuperView
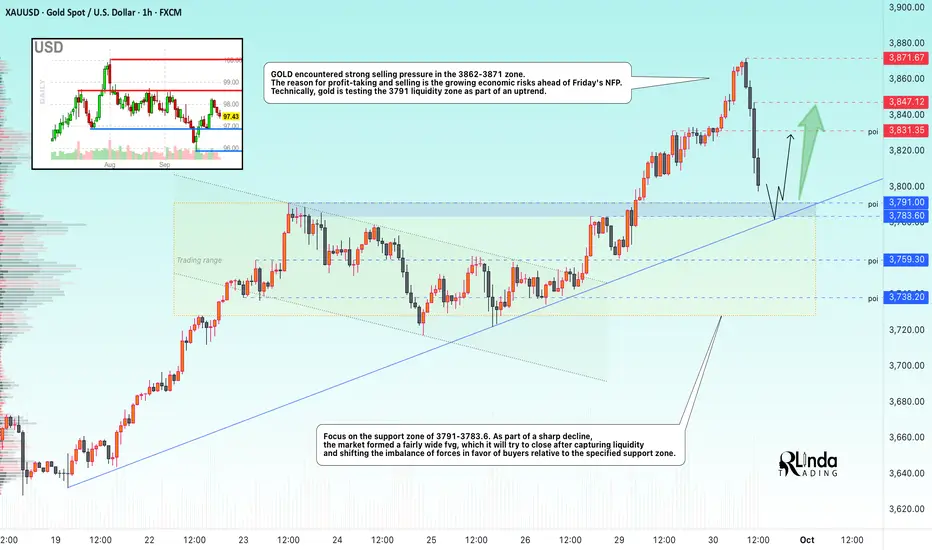
GOLD → Liquidation, but there is still a chance for growth...FX:XAUUSD has reached a new all-time high of 3871.6, marking its best month in 14 years (+12% in September). However, against the backdrop of high risks, the market is experiencing profit-taking and a deep correction. What next?
The high probability of a shutdown from October 1 is weighing on the dollar. The probability of a Fed rate cut in October is 90%, despite cautious comments from the Fed.
New tariffs on timber and furniture (from October 14).
Data from China: PMI growth (Manufacturing to 51.2). All this supports the bullish trend in gold. However, the end of the quarter, anticipation of NFP (but in the event of a shutdown, the publication of employment data will be suspended).
Technically, as part of the correction, the price is testing the upward support line, and the price reaction to the 3790-3780 zone will give hints about further movement...
Support levels: 3791, 3783
Resistance levels: 3831, 3847
A false breakdown and the formation of a reversal pattern relative to the specified support zone could trigger a recovery phase within the bullish trend. However, a quick return to support could trigger an attempt to break through and correct to 3759-3738.
Best regards, R. Linda!