Long Tia/usdtThe long correction on LSE:TIA might finally be over.
The price just completed a classic corrective pattern and tagged a major 4H support zone.
As long as this demand area holds, the outlook is bullish. Watching this one very closely for a long entry.
LSE:TIA #TradingSetup #nfa
Fibonacci Retracement

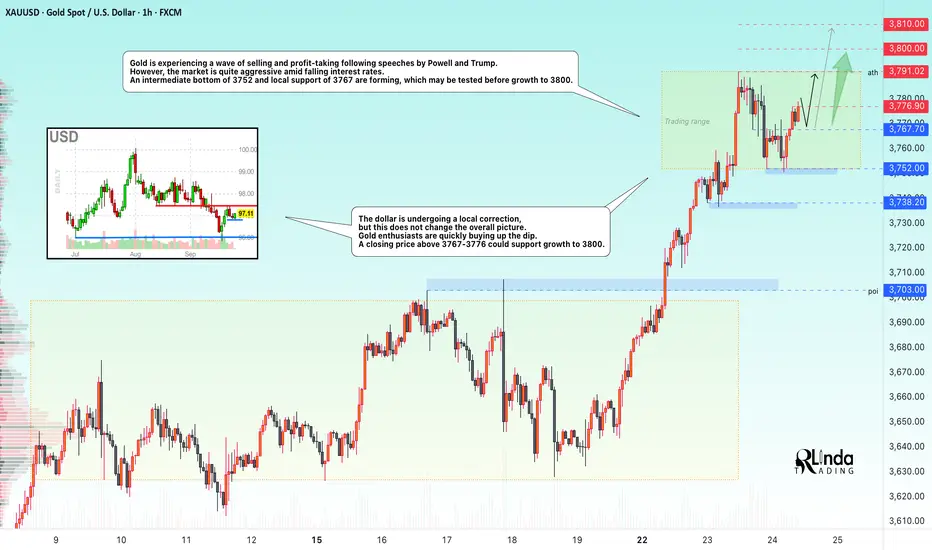
GOLD → Intermediate bottom. Consolidation before growth FX:XAUUSD is being sold off and declining amid profit-taking following speeches by Powell and Trump. However, the market is quite aggressive amid falling interest rates. After forming an interim bottom, the market quickly bought back the decline.
Gold is correcting after record growth, awaiting new signals from Fed representatives and PCE inflation data on Friday. The price remains close to historic highs, but the upward momentum has temporarily slowed, with consolidation forming at 3752-3791.
Key factors : Powell gave no clear hints about future rate cuts, noting the risks of rising inflation and a weakening labor market. The probability of a rate cut in October has risen to 92%, but the Fed's sentiment index is fluctuating somewhat...
The risk of a US government shutdown on October 1 and mixed PMI data are holding back the USD's strengthening.
Technically, gold remains in a bullish trend, but consolidation is possible in the short term. PCE data will be the deciding factor — weak figures will support the metal, while strong figures will trigger a correction.
Resistance levels: 3776.9, 3791, 3800
Support levels: 3767, 3752, 3738
The price is consolidating. Before reaching 3791-3800, there may be a retest of local support. Similarly, a retest of the ATH may also trigger a small pullback of 1/2 of the impulse before a breakout and growth to the specified targets.
Best regards, R. Linda!
BTCUSDT- 250924 - LONG - Bitstamp - Cycle Top - 1WBTCUSDT- 250924 - LONG - Bitstamp - Cycle Top - 1W
Market Cycle Top: 134k
Look to take profits around 134k

GBPUSD overhead supply keeps pressure, downside targets in focusGBPUSD once again tested the main supply zone around 1.3740, from where the market has repeatedly reversed lower. On the daily chart, the pair shows a series of lower highs, and the close below local support signals growing seller pressure.
The first downside target is near 1.3350, where initial profit-taking may occur. The next area is 1.3175, a stronger support level established earlier in the year. If bearish momentum develops further, 1.2900 becomes the key downside target to watch.
From a fundamental perspective, the pound remains under pressure due to Bank of England policy uncertainty, weak UK economic data, and the relatively hawkish stance of the Federal Reserve supporting the dollar. As long as the market trades below 1.3740, the bias remains toward the downside.

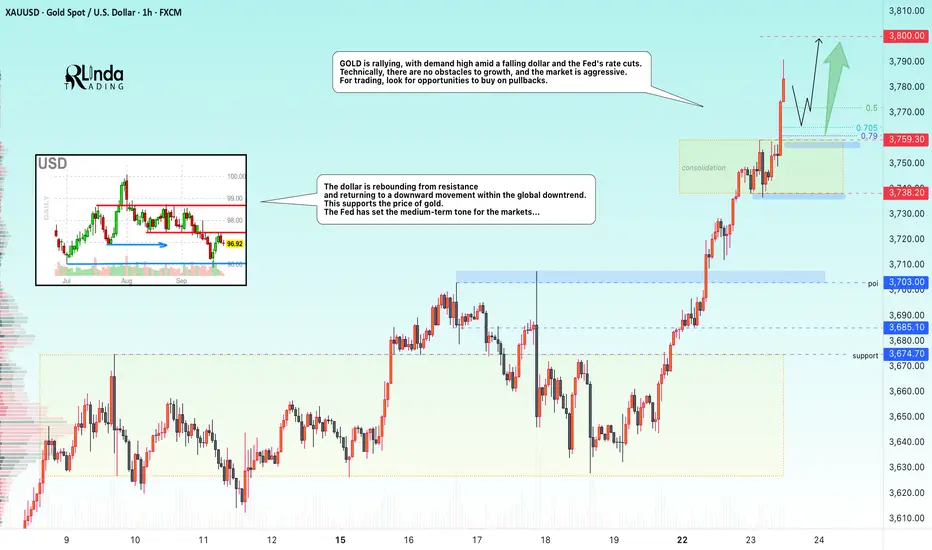
GOLD → Aggressive growth is not over. Powell's speech...FX:XAUUSD is rallying, with demand high amid a falling dollar and the Fed's rate cuts. Technically, there are no obstacles to growth, and the market is aggressive. For trading, look for buying opportunities on pullbacks.
Gold is rallying and hitting new highs as people realize what's going on (interest rates are falling). Powell's speech is coming up, and it may trigger a correction (profit-taking) amid growing risks.
Key factors: Powell's speech today, at which time the market is waiting for hints of further easing of Fed policy.
PMI data (US), weak figures will support the possibility of further rate cuts...
Demand for metal is supported by geopolitical tensions in the Middle East and Eastern Europe.
Resistance levels: 3800
Support levels: 3760
Many factors are supporting the rise in gold, and there are no compelling reasons to sell gold now. The ideal trading strategy is to wait for a pullback and retest of support levels with the formation of strong reversal points for buying.
Sincerely, R. Linda!
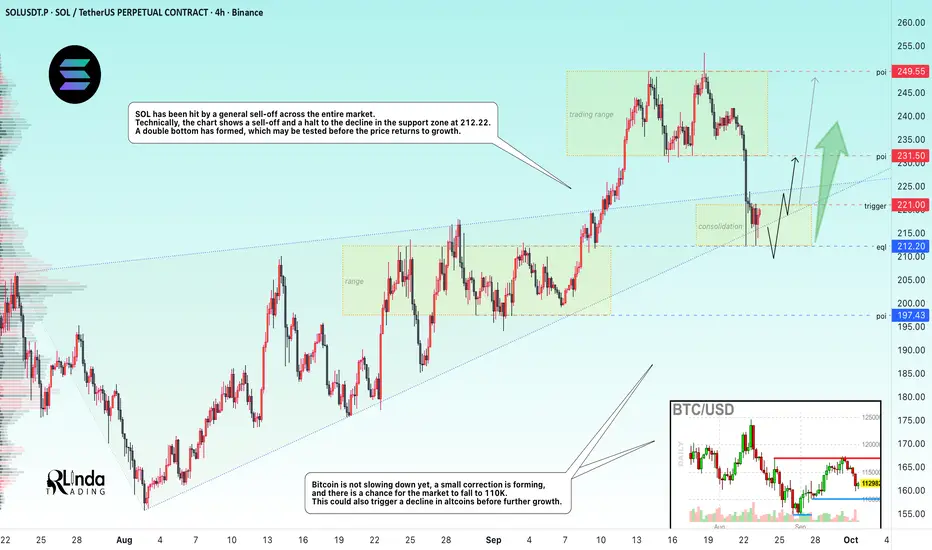
SOLANA → When will the sale end? Bullish trend...BINANCE:SOLUSDT.P is testing the key support zone of 210-215 amid a market decline. However, it is too early to say that the correction is over; additional signs are needed...
Bitcoin is not slowing down yet, a small correction is forming, and there is a chance for the market to fall to 110K. This could also trigger a decline in altcoins before further growth. SOL has been hit by a general sell-off across the entire market. Technically, the chart shows a sell-off and a halt to the decline in the support zone of 212.22. A double bottom has formed, which may be tested before the price returns to growth.
The current consolidation in the range of 212.0 - 221.0, the boundaries of which are of interest to the market, gives hope.
Support levels: 212, 200, 197
Resistance levels: 221, 231.5
A breakout of the local consolidation resistance and a close above 223.5 - 224 could trigger further growth within the bullish trend. Otherwise, MM may test the liquidity and support zone of 212.0 before the coin begins its recovery phase.
Best regards, R. Linda!
$BTC Battle of the Bulls and Bears is ON! Pretty wild day in the crypto market.
CRYPTOCAP:BTC Bears closed below the 100MA, but thankfully right above the .236 Fib and avoided the DANGER ZONE ⚠️
Bulls need a big next couple of days.
Can't hang out here for too long.
RSI is looking healthy after this reset tho.
How you feeling?
Bullish or Bearish?

BTC/USD 12H local downtrend📊 Chart structure
• BTC price: ~ 112,765 USD (decrease -2.18%).
• Trend: after prior reflection from the holes (~ 107k), BTC is approaching the resistance zone.
• Inheritance channel: The marked yellow line suggests that the price is still in a medium -term inheritance trend
⸻
🔑 levels of support and resistance
• Support:
• USD 111,461 (close to support - if it falls, a quick test below).
• USD 107,346 (key support - its loss opens the road towards 103-105k).
• resistance:
• USD 118.004 (important level of resistance).
• USD 124.619 (strong resistance - local peaks).
⸻
📈 indicators
• SMA (movable average):
• Red (SMA #1) - short -term, currently acts as dynamic resistance.
• Green (SMA #2) - average, the price fights around it.
• Blue (SMA #5) - long -term, still above the price, which means inheritance pressure.
• MacD:
• You can see a slight weakening of the growth moment. If there is no strong demand, it is possible to cut the signal down (inheritance signal).
• RSI (12H):
• fell from the level close to buying (~ 70) to ~ 45–50.
• Neutral, but with a slight tendency to further weakness.
⸻
🧭 Scenarios
1. Bullish:
• Support defense 111,400 USD → Reflection up.
• If $ 118,000 stands out, the next target is USD 124,600.
• Breaking over 125K will negate the inheritance channel and can open the road to 130K+.
2. Bearish:
• Support loss 111,400 USD → test 107,300 USD.
• If the 107K does not stand, a further decrease is possible to 103-105k.

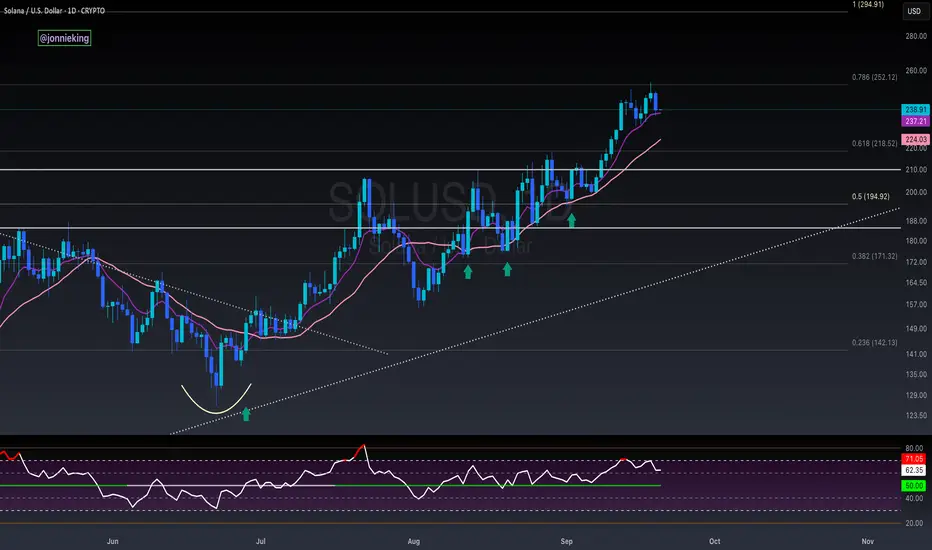
Solana's short-term pullback resets Overbought RSISolana's 1st attempt to break out from the $252 Multi-year resistance failed and triggered a short-term bearish reaction, causing the price to fall all the way to $213.87. A long wick was created due to a quick bounce from $213.87; it is also showing good support on the Fib .618 ($220.49) level.
The pullback also resets the overbought RSI of Solana, which is a healthy move, seeing it as an opportunity to gather strength for another leg up. The over-extended MA20 has also crossed the daily candle, showing another sign of good retracement gearing for another bounce.
The weekly cup-and-handle pattern was still intact, targeting a measured move of $520.
From a fundamental perspective, given that Solana has institutional adoption and pending ETF approvals in October 2025, Solana is still considered highly undervalued.

GOLD → The rally continues. We are waiting for a pullback to buyFX:XAUUSD is rallying since the opening of the trading session. The movement has been continuing since Friday, after the end of the correction. The market is realizing the potential for interest rate cuts...
The metal is showing gains for the fifth week in a row, despite the local recovery of the dollar.
Key supporting factors: The forecast of two rate cuts before the end of the year continues to fuel interest. Tensions in US trade relations with India and other sources of instability. Upcoming PCE data on Friday may confirm the need for a soft policy. BUT! Caution is needed, as a short-term correction (profit-taking) is possible after record growth.
Resistance levels: 3730, 3740, 3750
Support levels: 3703, 3685, 3674
The price is in the ATH zone, having come a long way since the opening of the session, and a correction may form. It is dangerous to sell in the current zone, and for trading within the bullish trend, it is worth waiting for a pullback to the nearest local support levels...
Best regards, R. Linda!

BTC | Buy - Let's Go!Strategy: Impulse Correction
Direction: Bullish
Moving Average: Blue above Red
Fib Retracement: 38.2 reached
MACD > 0
1st Target = 116 805
2nd Target = 118 391
3rd Target = 120 435
Entry: 115 972
SL: 114 860
Trade 8/20

GOLD → Breakthrough of correction resistance. Uptrend FX:XAUUSD entered a correction phase after the Fed meeting and interest rate cut, but by the end of the week, the market managed to recover from the decline and return to the zone of interest, breaking through the resistance of the downtrend...
The dollar is correcting after the Fed meeting on interest rates. The index is testing resistance at 97.5-98.0, and a false breakout of this zone could trigger a fall in the index, which in turn would only support the forex and gold markets...
At this time, the metal is reducing its correlation with the DXY and breaking the resistance of the downward correction, which is provoking an impulse to 3685. Technically, Friday's trading session is closing quite positively, which generally indicates a high level of demand.
I would highlight several key levels: the previously broken resistance at 3674 (below this zone there is a hidden liquidity pool) and resistance at 3685 (trigger). A retest of the lower level is possible before the price continues its growth. The target within the current movement can be considered 3700 - 3710.
Support levels: 3674, 3668, 3660
Resistance levels: 3685, 3703, 3710
If, during the Asian/Pacific session, gold consolidates without a pullback and closes above 3685, the market may continue to rise towards the specified target. However, if the market lacks potential (after the weekend), then MM may test 3674 - 3668 before the price returns to growth towards the target of 3700.
Best regards, R. Linda!

EURUSD to return bullish as it gets closer to 1.17000EURUSD is revising the bullish trendline level and is expected to continue its bullish move from there onwards.
DXY also remain bearish despite the heavy correction.
Please watch the video and let me know your thoughts.

BNB/USD 1D Chart Review UpTrend1. Trend Structure
The price was in a long-term uptrend (marked by the orange lines).
The last breakout occurred at the top of this channel, which is a strong signal of trend continuation.
A breakout from the channel usually means that the market is gaining additional momentum – not only maintaining the current growth rate, but even accelerating it.
2. Breakout Range
The height of the channel (the difference between the lower and upper orange lines) is approximately ~$300–$320.
It is assumed that after breaking out of the channel, the price can cover a distance equal to its height.
This indicates a potential target around:
$1,100–$1,150 (the first key resistance level, aligned with the green zone on the chart).
The next range is as high as $1,280–$1,300 (the upper level marked by the green line).
3. Key Technical Levels
Support (red lines):
USD 899
USD 775
USD 702
These levels are most important for potential corrections.
Resistance (green lines):
USD 1,116 (nearest target after the breakout)
USD 1,280–1,300 (full range of the channel height)
4. Oscillators and Momentum
Stoch RSI (at the bottom of the chart): heavily overbought, which may suggest a short-term correction before further upward movement.
In uptrends, overbought levels do not always lead to large declines – often only to sideways consolidation.
5. Scenarios
Bullish:
Price remains above USD 900, consolidates, and then tests USD 1,116, with a target of USD 1,280–1,300.
Bearish:
If the market fails to maintain the breakout and returns below $900, a return to the middle of the channel to the $775–$800 area is possible.
✅ Summary:
A breakout from the channel to the upside is a very positive signal, and the technical upside range reaches $1,100–$1,300. However, due to the overbought position (Stoch RSI), a correction or short-term consolidation is possible before the price continues towards the full target.

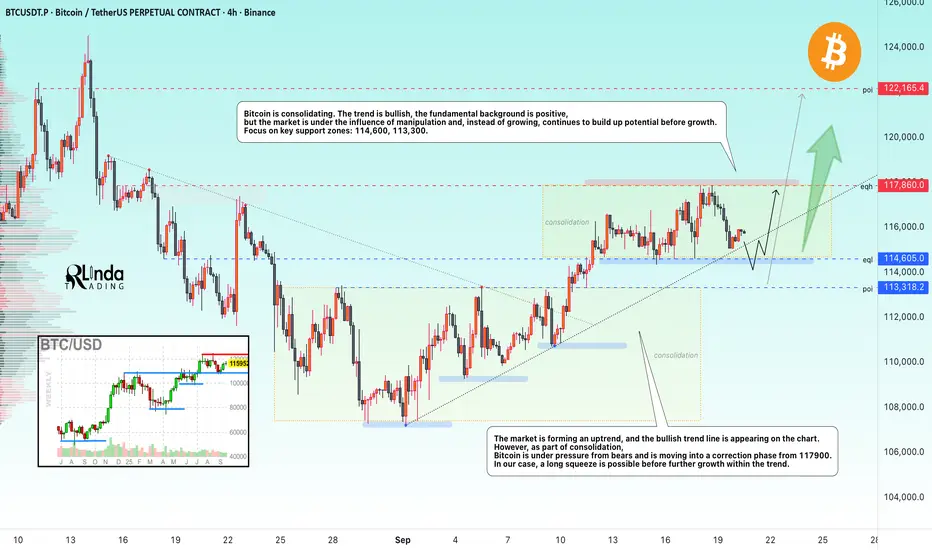
BITCOIN → Manipulation, long squeeze before growth BINANCE:BTCUSDT is in a global bullish trend. The fundamental background, following the start of interest rate cuts, is taking a positive turn, but instead of growth, the market is consolidating...
Bitcoin is showing resilience, trading within the specified trading range (above 114K) amid the Fed's policy easing. For three weeks in a row, growth has been supported by dovish signals from the central bank and growing institutional demand.
Key drivers: The Fed's 25 bps rate cut and forecasts of further easing (to 3.6% by the end of 2025) have strengthened the fundamental backdrop in the cryptocurrency market. Corporate and ETF purchases continue to fuel the bullish trend. Low rates reduce the attractiveness of bonds and increase interest in Bitcoin.
Technically, the market, influenced by manipulation rather than growth, continues to accumulate potential before growth.
Resistance levels: 117860,
Support levels: 114600, 113300
The market is forming an uptrend, with a bullish trend line appearing on the chart. However, as part of consolidation, Bitcoin is under pressure from bears and is moving into a correction phase from 117900. I expect that MM may form a long squeeze in the liquidity zone. That is, a false breakdown of the consolidation support and trend at the same time, and only then return to an upward movement.
Best regards, R. Linda!
$PUMP Battle Between Buyers and SellersWill be an interesting next couple of days to watch for NYSE:PUMP
Appeared to be forming a bull pennant but that failed and lost the 9EMA.
Now is the battle between buyers and sellers at previous ATH.
Must hold this level otherwise it will print 3 Black Crowes and retest ~.006

$SOL Maintains Uptrend With Daily CloseIgnore the noise.
CRYPTOCAP:SOL is still very much in an uptrend and has closed the day above the 9EMA.
Bulls need to maintain this, otherwise a retest of the 20MA ~$224 will be retested.
GOLD → Retest of resistance at 3660. What could happen?FX:XAUUSD is testing resistance to correction after breaking the local market structure from bearish to bullish. A breakout of 3660 could give buyers a chance...
A 25 bp rate cut to 4.25% was expected, but the forecast for further cuts came as a surprise: now two cuts before the end of 2025 (instead of one) and one in 2026.
The reason for the shift: fears of a slowdown in the labor market outweighed the risks from inflation (2.9% in August).
The dollar continues its countertrend correction (rebound) after Powell's speech and economic news. This temporary phenomenon may soon end. Gold, after a manipulative phase, may return to an upward movement if the price breaks 3660 and consolidates above this level.
The Fed preferred to support employment, risking accelerating inflation. In the long term, this will support risk assets and commodities, but in the short term, the markets have taken a pause.
Resistance levels: 3360, 3675, 3688
Support levels: 3643, 3631
Gold is not updating local lows, a cascade bottom is forming and the local bearish structure is breaking down. If the market manages to overcome the resistance of the correction, a bullish impulse may form!
Best regards, R. Linda!

SOLUSDT → Correction amid a strong bullish trend BINANCE:SOLUSDT , after updating its next high, formed a false breakout of local resistance and returned to the trading range as part of a correction. What to expect from altcoin?
The main driver of the crypto market, Bitcoin, is consolidating above 115K and facing fairly strong resistance at 117400. Earlier, the price completed a downward correction. The market is dominated by a positive technical and fundamental background.
SOL looks stronger than Bitcoin and is testing new highs...
The price of SOLANA is forming a false breakout of resistance and is entering a correction phase amid a bullish trend. As part of the correction, the price may test the local imbalance zone and the key liquidity level of 242.5.
Resistance levels: 244, 249.2, 253.5
Support levels: 242.5, 239, 231.5
Technically, the price may form a false breakdown of the nearest zone of interest at 242.5, and if the bulls manage to keep the price above the resistance zone of 242.5-244.0 after this maneuver, the coin may return to an upward movement. However, if this does not happen, I would wait for a retest of the 239.0 zone, where the trend support line is located. The medium- and long-term outlook for SOL is positive, and the price is highly likely to test the ATH 295.0.
Best regards, R. Linda!

$BTC Bullish Daily Close - HIGHERCRYPTOCAP:BTC closed just where it needed to close today, grabbing upside liquidity.
Need to hold this $117k mark and keep momentum above the 9EMA.
Still on for ATH Sept 23-30th.

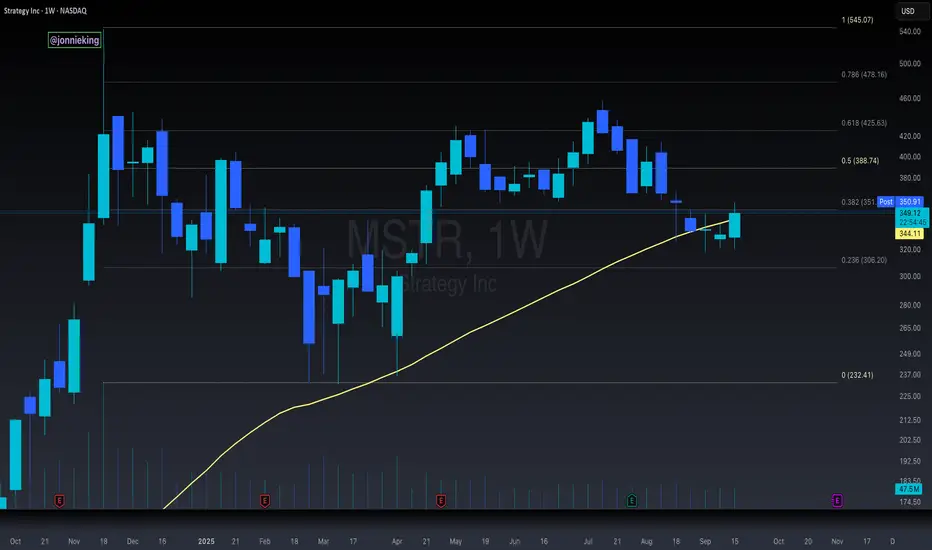
$MSTR Must Close This Week Above the 50WMA Or Else...The MicroStrategy chart is the only top signal that is somewhat cause for concern at the current moment.
You can see NASDAQ:MSTR has closed the past several weeks below the 50WMA, which signaled the start of the bear market last cycle.
Having said that, it has had a bullish rally this week and is trading above the 50WMA once again.
MSTR must close the week above this level, otherwise the stock could be in for a much deeper correction, which could negatively affect CRYPTOCAP:BTC in October.
Where have you heard that October prediction before?
Coincidence? 🥸
GOLD → Rates have been cut. Will growth continue?FX:XAUUSD , following the Fed's decision on interest rates, caused a shock, updating the ATH to 3707, then updating the minimum to 3633. Since the opening of the European session, the market has been recovering, but there is a BUT...
The Fed's Dot Plot confirmed the forecast of two additional rate cuts before the end of the year, which provides long-term support for gold.
The USD remains under pressure after the Fed's decision, despite a short-term rebound. Trump's statements and the escalation of conflicts continue to fuel demand for safe havens.
After rising to a record high of $3707, a short-term correction is possible. If today's jobless claims come in better than expected, it will temporarily strengthen the USD. As for Powell, his emphasis on “meeting-to-meeting decisions” may limit appetite for risky assets.
Resistance levels: 3674.7, 3688.6
Support levels: 3654.5, 3633, 3626.8
Technically, since the opening of the European session, gold has spent its intraday ATR reserve. From the specified resistance level of 3675 (psychological level), a correction to 3660-3655 may form before continuing to grow to 3675-3688.
Best regards, R. Linda!

GBPAUD → False breakdown. Return to bullish trend FX:GBPAUD is forming a false breakdown of support and returning to a bullish trend. The market has seen a breakdown of the local structure, signaling the end of the correction.
The pound sterling has consolidated above the consolidation resistance, thereby showing bullish signs, which has a positive effect on the GBPAUD currency pair.
False breakdown of the trend and support of global consolidation. The price returned to the range and closed in the long zone. Bulls may provoke continued growth after the formation of local patterns...
Resistance levels: 2.0746, 2.103
Support levels: 2.04788, 2.0301
Consolidation of the price above support and a breakout of local consolidation may trigger further growth. The trend is bullish, targets are indicated on the chart.
Best regards, R. Linda!
