EURUSD → Breakthrough of consolidation resistance. Rally?FX:EURUSD ends correction with a breakout of consolidation resistance. The market is waiting for a positive driver in the form of economic news that could support the growth of the euro...
A breakout of the correction (consolidation) resistance has formed. However, the momentum is being replaced by a correction aimed at consolidating in the bullish plane, which could trigger continued growth in the medium term.
The dollar looks weak, and expectations of interest rate cuts are supporting the euro. If the bulls keep the price above 1.17 - 1.172 within the current correction, the price may start to rally to highs...
Support levels: 1.173, 1.1703
Resistance levels: 1.178, 1.183, 1.190
Before continuing to grow, liquidity may be captured relative to the previously broken consolidation resistance. A false breakdown of support at 1.173-1.170 could trigger a resumption of growth towards 1.190.
Best regards, R. Linda!
Fibonacci Retracement

GOLD → As prices continue to rise, so do the risks...FX:XAUUSD continues to rise, setting new highs. New ATH 3659. Focus on current consolidation, as the structure remains bullish...
Gold hit a new record high, surpassing $3,650, amid a weakening dollar and growing expectations of aggressive Fed policy easing. However, overbought conditions and profit-taking risks may limit further growth.
The USD is at 7-week lows due to fears of stagflation and deteriorating employment data. The probability of a rate cut on September 17 is 89.4% (25 bps), with a chance of 50 bps. Markets are expecting more than two cuts in 2024.
Risks for gold: “Sell the fact”: If the NFP revision turns out to be weak (as expected), investors may start to take profits.
Technically, gold remains bullish, but a near-term correction is likely due to technical factors and a possible reaction to the data. The long-term trend remains bullish thanks to a weak USD and the Fed's dovish policy.
Resistance levels: 3657, 3675, 3700
Support levels: 3636, 3628, 3620
Gold is consolidating. At the moment, the fundamental background is stable, and no news is expected today except for those that are impossible to predict (comments, rumors, etc.). Before further growth, gold may test the support area and the liquidity hidden behind it.
Best regards, R. Linda!

1:18RR long position goldi had a successful scalp and executed good entries on the fvg and trend liquidity on gold during asians session today but with the scalp the idea was to secure profits at the PDH/ATH while i wait for NY / London session to see if gold will continue to rise like a rocket.
the whole idea here is the long position the bigger picture because with the technical analyses my anticipation has always been to see gold rising till infinity to start with $3500 and $3700.
do you think gold prices will increases to the final key levels?

GOLD → Strong bullish trend. What are the targets?FX:XAUUSD continues to rally on positive fundamentals that emerged at the end of last week. The market is pricing in an almost 100% cut in interest rates, which is weakening the dollar and supporting the metal...
Gold is holding close to its record high of $3,600 after extremely weak US employment data for August. This has reinforced expectations of a 25 bp Fed rate cut this month.
This week, attention is focused on the release of US inflation data (CPI and PPI). Inflation data in the US will confirm or adjust expectations for Fed policy easing. If inflation remains high, this could delay aggressive rate cuts and cause a correction in gold. For now, the bullish trend continues.
Resistance levels: 3615, 3634, 3650
Support levels: 3600, 3578
Technically, a strong bullish trend. Growth may continue after price consolidation above 3614-3615 or after a slight correction to support at 3600 relative to the current local rally.
Best regards, R. Linda!

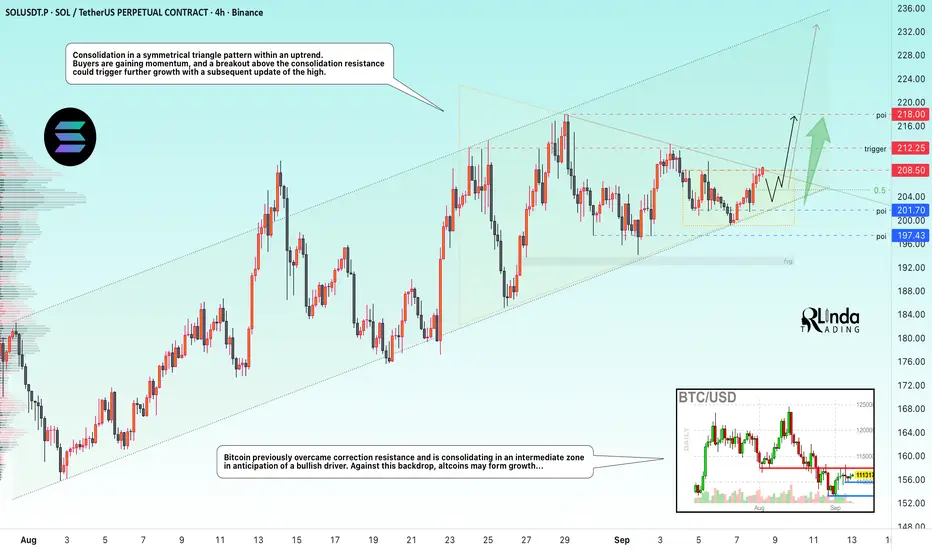
SOLUSDT → Consolidation before the rally. New high?BINANCE:SOLUSDT continues to form a bullish trend without reacting to market noise. The price is consolidating before a possible rise. Focus on the trigger...
Bitcoin previously overcame correction resistance and is consolidating in an intermediate zone in anticipation of a bullish driver, which could generally strengthen positive sentiment in strong altcoins. Against this backdrop, the market may form growth...
SOL is consolidating in a symmetrical triangle pattern within an uptrend. Buyers are gaining momentum, and a breakout of the consolidation resistance could trigger continued growth with a subsequent update of the maximum.
Resistance levels: 208.5, 212.25, 218.0
Support levels: 201.7, 197.4
Before the breakout and growth, a retest of the 205.0 - 201.7 zone may form, however, a breakout beyond the symmetrical triangle may trigger a spread. Growth targets may be 220, 245.
Best regards, R. Linda!
ENAUSDT → Attempting a trend change. Focus on 0.700BINANCE:ENAUSDT is forming an attempt to change the trend. The price breaks the descending resistance and forms a new trading range. The focus on the 0.7 support and the bulls' reaction...
Bitcoin looks quite positive after breaking the downside resistance, but there is a strong 112K zone ahead and news on Thursday / Friday. If the general backdrop maintains its bullishness, BTC's rise will support strong altcoins and the market could turn green, including the coin discussed in this publication...
ENAUSDT breaks through the downtrend resistance. Price is consolidating above the boundary and forming a trading range. The focus is on the 0.7 - 0.683 area. If the bulls keep the price above this area, it will confirm the fact of trend change, which could trigger a rally to 0.7745 - 0.853
Support levels: 0.7, 0.683, 0.668
Resistance levels: 0.736, 0.7745
Technically, there is a possible struggle between market participants for the area 0.7 - 0.668. In this case, I will not consider the return to the channel as a false breakout of the trend, as a strong upward impulse was formed earlier, which generally broke the local market structure. However, based on the technical situation, I will consider entering the position after clear signs of price holding above the key support zone.
Regards R. Linda!

LINK/USDT 12h chart🔹 key levels
• Support (red lines):
• 21.73 USDT → First strong support (tested several times).
• 20.17 USDT → Another key support (potential descent, if the price drops below 21.7).
• 18.10 USDT → deeper support (larger pullback).
• resistance (green lines):
• 23.22 USDT → The price is currently testing this level.
• 24.14 USDT → strong resistance if you manage to break 23.2.
• 25.54 USDT → Higher resistance, last local peaks.
⸻
🔹 Trend
• We see an upward trend (orange trend), which was defended at around 21.7.
• The price is currently testing the top of the channel → If the candle closes above 23.2, possible movement towards 24.1 - 25.5.
⸻
🔹 oscillators
• Stoch RSI:
• strongly bought (blue and orange line high in zone 80).
• It may suggest short -term withdrawal if there is no breakdown.
• RSI classic:
• He bounced off the level ~ 40 and grows slightly.
• Still a lot of space to grow before entering the purchase zone (70+).
⸻
🔹 Scenarios
1. Bycza (Bullish):
• Breaking above 23.2 USDT and confirmation of this level as support → Target 24.1 and 25.5.
2. Bear (bearish):
• Rejection from 23.2 and Trendline fracture down → decrease to 21.7, and then even 20.1.
⸻
✅ Summary:
The link is now at an important moment - either it will break 23.2 and will go higher (24-25.5), or will reflect and return to around 21.7. The oscillators show that there may be a small correction short -term, but the medium -term trend still looks upwards.

HYPEUSDT → Upward consolidation. One step away from a rally BINANCE:HYPEUSDT.P continues to consolidate while maintaining an ascending triangle structure. Any bullish driver, even a weak one, could trigger a breakout of resistance and distribution with an ATH update...
Against the backdrop of weak Bitcoin and falling altcoins, HYPE looks positive. The market is holding an upward support line and a bullish trend, and the update of the local maximum as a manifestation of bullish strength is a positive sign. The price is changing the local market structure to bullish and is ready to continue growing after a correction. Focus on the 46.15 and 45.5 - 45.08 areas. A false breakdown and closing above the level will confirm the readiness to continue growing.
Resistance levels: 47.78, 49.54
Support levels: 46.15, 45.08, 44.45
As part of the correction, the price may test the specified areas of liquidity and interest, which may provoke a change in the market imbalance in favor of buyers. If, after a false breakdown of key areas, the bulls keep the price above, then in the short and medium term, we can expect continued growth.
Sincerely, R. Linda!

$FARTCOIN 50% Correction IncomingSomeone opened the bathroom window and let the air out 🪟
$FARTCOIN appears to have found a local top and closed its 2nd consecutive week below the .236 Fib
If someone doesn't shut the window this week, FARTCOIN could face ~50% correction to its next support.
that stinks 💩

BITCOIN → Sale on positive news? What to expect? 100K or 130K?BINANCE:BTCUSDT.P unsuccessfully ended another attempt to break through the 112K-113K zone. The positive background (NFP) did not affect the price, and a bearish setup formed on D1...
D1 is forming a pin-bar relative to the strong resistance zone of 112K - 113K, positive news is quickly sold off, and the price, rebounding from the resistance of the trading range, closes near the bearish trigger of 110500. Bitcoin looks quite uncertain as it faces selling pressure in the 112K-113K zone. The price cannot consolidate above this area despite the previously broken correction resistance. There is logic in this maneuver... The market is betting on a more than 90% chance of interest rate cuts, and by that point, the price of Bitcoin may fall to the maximum permissible limits before further growth. Areas of interest may be 107K - 105K - 100K
Resistance levels: 111.9K, 113.3K, 117K
Support levels: 110.5K, 107.4K, 105.0K
A breakdown of the 110.5K support could trigger further sell-offs towards the support of the key trading range. Within the current downward cycle, the price may well test 105,000, which is a fairly strong liquidity zone. The fundamental background is positive, and the current sell-off may be manipulative movement before the emergence of a bullish driver...
Best regards, R. Linda!

SOLUSDT | 1 DAY | SWING TRADING Hey friends!
I’ve put together a detailed analysis on Solana just for you. The harmonic pattern has completed, and we’ve already seen some strong buying from that exact zone. 📈
Now, I’ve got two targets for you:
🎯 Target 1: 170.00
🎯 Target 2: 219.00
🔴 STOP: 75,81
"Just a heads-up — since this is a swing trade, the target might take some time to hit. Good to keep that in mind."
Remember, the more love and likes I get from you, the more motivated I am to keep sharing these analyses. All I ask is for a simple like to show your support. 💙
Huge thanks to everyone supporting with their likes — I truly appreciate it!

SOLUSDT → Stronger than the market. Correction before growthBINANCE:SOLUSDT updated its maximum to 218 and entered another phase of correction for consolidation. The altcoin looks quite strong against the backdrop of the rest of the cryptocurrency market...
Bitcoin continues its aggressive decline after yesterday's trap (false breakout of the trend line). Despite relatively positive fundamental and technical developments, the cryptocurrency market is in the red. Against this backdrop, SOL stands out as a strong altcoin compared to Bitcoin, which has been falling for two weeks. SOL updated its maximum and entered a correction phase. Within the current structure, the price may test the liquidity zone of 202.5 - 195.3 before continuing to grow to 220 - 240.
The reaction to false breakouts of local highs is weak, there is no reversal, and the nature of the current structure is “consolidation.” If the bulls keep the price above 200 during the correction, the further outlook will be positive.
Resistance levels: 216.5, 220, 244
Support levels: 202.5, 198.0, 195.3
Focus on the current correction. We need to wait for a slowdown and the end of the structure. Focus on the specified support zones, from which the market may resume bullish trading, which in turn may lead to a breakout of intermediate resistance and growth to the specified targets.
Best regards, R. Linda!

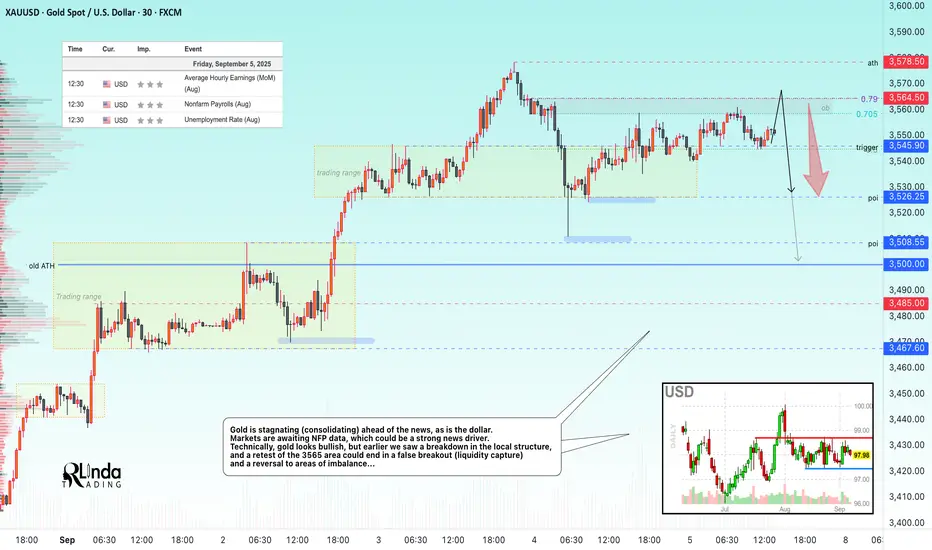
GOLD → ATH retest before NFP. High risk level...FX:XAUUSD remains in a bullish trend, but short-term dynamics depend on NFP. A break above $3578 will open the way to new highs, but profit-taking at record levels could increase volatility.
Gold remains strong ahead of US NFP data, which may confirm the Fed's policy easing. Weak data (forecast: +75K new jobs) will reinforce expectations of a rate cut and support gold. However, the risk of a correction is quite high, and any nuances could trigger liquidation. Weak employment data, namely rising unemployment and low ADP figures, are strengthening bets on a Fed rate cut, which overall only increases interest in the metal.
Resistance levels: 3564.5, 3578.5
Support levels: 3545.9, 3526, 3508
NFP data will determine the short-term trend. A weak report will lead to growth to $3600+, while a strong report will lead to a correction to 3450-3400. Technically, I expect a correction after the local bullish structure breaks down. It is not worth trading on the news; it is better to wait 20-40 minutes after the release to make decisions based on fundamental data.
Best regards, R. Linda!
EURGBP → The battle for zone 0.867. What are the prospects?FX:EURGBP is attempting to remain above 1/2 of the key trading range as part of a retest after breaking through strong resistance. The local trend is bullish, and the price has a chance to reach 0.8743.
EUR is consolidating in a wedge pattern, with the price moving away from support and attacking resistance. Against the backdrop of the expected Fed rate cut, EUR may break through the line and begin an active phase of growth, which will support EURGBP. The currency pair's price has moved beyond the lower half of the trading range and is attempting to consolidate above the bullish interest zone. If the bulls hold their defense above 0.866-0.867, the price will have a chance to test the poi
Support levels: 0.867, 0.865, 0.8635
Resistance levels: 0.871, 0.874
Against the backdrop of the news, the price may test the order block in the 0.865 zone. A false breakdown and consolidation of the price above 0.867 will confirm the bulls' intentions, allowing the price to move towards the specified target.
Best regards, R. Linda!

ETHUSD - 250905 - LONG - Binance - Algo Target - 1WTake Profit: $5,800 - $6,000
Likely Market Cycle Top

SOLUSDT- 250905 - LONG - Binance - Algo Target - 1WSOLUSDT- 250905 - LONG - Binance - Algo Target - 1W

GOLD → The uncertainty factor before the news. Down / up?FX:XAUUSD after updating another high to 3578 went into the phase of profit taking before two busy news days. The trend is aggressively bullish, but the risks of correction are quite high due to the uncertainty factor....
The price pulled back from record highs amid profit taking and reduced panic in the bond market. The dollar stabilized, but remains under pressure due to expectations of Fed rate cuts this year. The key event will be the publication of US employment data (NFP) on Friday.
A correction after a sharp rise is a natural reaction, but the expectation of Fed policy easing is supporting the metal's price.
Geopolitics: Trade risks (Trump's tariffs) mitigate gold's fall.
Gold's correction so far looks like a pause before further movement. The main driver is NFP data, which will determine Fed rate sentiment and USD direction. But, today all eyes are on ADP Nonfarm, Initial jobless claims, and ISM data. Unexpected data may intensify the sell-off....
Resistance levels: 3546, 3559, 3563
Support levels: 3526, 3508
It is difficult to determine the news reaction in advance, we will have to orient ourselves after the fact. Technically, I expect a deeper correction for a healthy market. I expect a retest of the 3560 zone and further decline to local liquidity zones.
Regards R. Linda!

$SOL Rotation IncomingNow that the CRYPTOCAP:ETH hype has calmed,
it’s almost time for CRYPTOCAP:SOL
to rip the haters face off...
once again🎃

GOLD → Consolidation in the ATH zone. Risk zone...FX:XAUUSD hit a new all-time high of around $3,550 as investors worldwide rushed to safe-haven assets. As prices rise, the risk of profit-taking increases, especially with news coming up...
The key driver is the crisis in the bond market: long-term government bond yields are rising sharply in the UK and Japan. This is boosting demand for gold as a safe haven. We should also not forget about expectations of Fed easing: weak employment data could increase bets on a rate cut in September.
However, strong US employment data (starting with JOLTS today) could support the USD and limit gold's growth.
Correction: Record levels could trigger profit-taking, especially given that the price has come a long way since the last pullback, rising nearly 6% (7 days of growth).
Key factor: US labor market data (JOLTS today, NFP on Friday). Weak figures will strengthen gold, strong ones may cause a correction.
Resistance levels: 3546, 3550, 3575
Support levels: 3526, 3508, 3500
Technically, a retest of resistance at 3342-2246 could lead to a breakout and further growth. However, since the price has stopped updating its highs locally, I do not rule out the possibility of a retest of support at 3529-3526 before further growth. However, a weak reaction to support could lead to the formation of a pre-breakdown base, and a breakdown of support could trigger a decline to 3500.
Best regards, R. Linda!

GBPNZD → Retest 2.276 before resuming the bullish trend FX:GBPNZD is testing a key support level as part of a correction after breaking through consolidation resistance. The trend is bullish, and liquidity capture could resume the upward movement.
GBPNZD is testing a strong support level within the uptrend during the correction phase. Against the backdrop of the long-term decline of the NZD, the currency pair has every chance of continuing to grow.
On the daily timeframe, we have a fairly strong upward structure, with the previously broken consolidation resistance and the 0.5f area playing a key role. This tandem hides a liquidity area that could become a driver for the market. A false breakdown of 2.276 could trigger a resumption of growth.
Support levels: 2.276, 2.2682
Resistance levels: 2.2983, 2.3215
The bullish trend may support the main trend. The current correction is a healthy movement within an uptrend that may continue after a pullback and consolidation.
Best regards, R. Linda!

50% retracement from the top. BNL Analysis
Closed at 89.48 (01-09-2025)
It bounced from 93 till 103 - 104.
Though it has broken its HL but Bullish Divergence is there & also
50% retracement from the top.
Now if the current level is not honored as a Good Support (couple of Bullish
Candles Required), we may witness 72 - 73.
Upside Immediate Resistance is around 104 - 105 (as mentioned earlier.)

$BTC.D Head and Shoulders Topple to 42%If I were a betting man, this is what the future holds for ₿itcoin Dominance.
A head and shoulders pattern could very well be the eventual topple for CRYPTOCAP:BTC.D as we see it make it's way down to 42% which follows previous cycle's trend.
the RSI shows room for correction back up for one more push.
the 20WMA bearish crossing below the 50WMA will be the nail in the coffin.

Bearish Momentum for Bitcoin!Looking at the Daily Time-frame, we can see that the market structure has been broken. The high formed in the 14th of July, where liquidity was resting, was taken out and immediately price began its down-ward spiral! Within a period of 9 days, the low formed on the 2nd of August was taken out, qualifying that level as a breaker, but a more decisive move took place on the 25th.
Thus we can see, by the unwillingness of price to go above the breaker level, that the market is bearish! Right now, I am waiting for price to reach the 111,855 level to see how price will react.
All the best with your trading.
