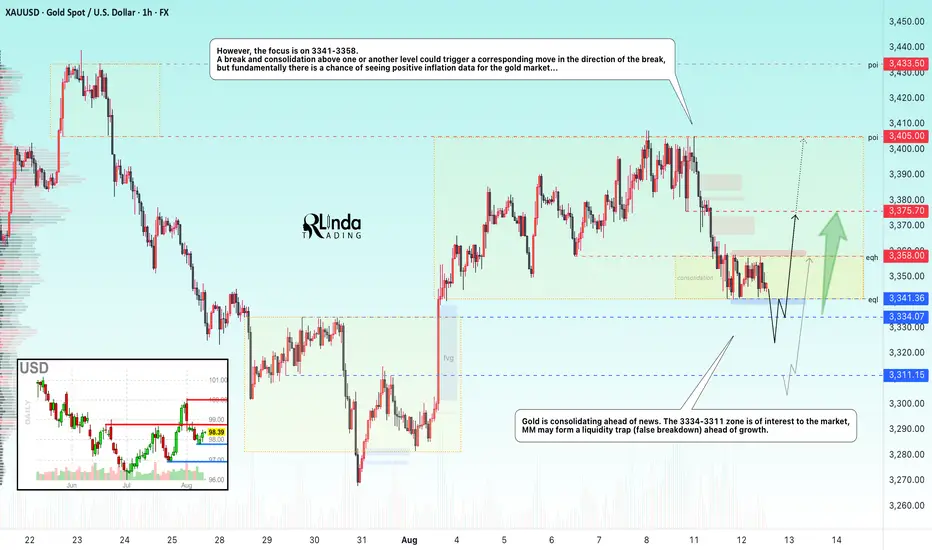
GOLD → Consolidation ahead of CPI data...FX:XAUUSD is consolidating ahead of news. Inflation is on the horizon, and further developments for the dollar and gold will depend on the data. Globally, gold is in a bullish trend, but locally we are seeing a correction...
Gold is rebounding slightly from $3,341 ahead of US CPI data for July and against the backdrop of the extension of the US-China trade truce until November. Investors are assessing the prospects for a Fed rate cut, expecting inflation to remain within 2.8% (core inflation is 3%). Weaker-than-expected data could cause the dollar to fall and support gold, while stronger data could resume the downward trend.
Technically, on D1-H4, gold is consolidating in a symmetrical triangle pattern and the price is in the support zone. There is a possibility that Trump may not make a mistake with inflation data, as he did with employment data...
Support levels: 3341, 3334, 3311
Resistance levels: 3358, 3375, 3405
The 3335-3310 zone attracts MM with an open FVG, which the market may partially close, forming a liquidity trap before continuing growth. However, it is also worth watching the boundaries of the current local consolidation, as a breakout of one or the other boundary could trigger a strong impulse.
Best regards, R. Linda!
Fibonacci Retracement
USDZAR. The USDZAR is ready to rally but the daily equal lows are suspect. It would be great to see them swept before it rallies, but that will depend on how they use the news.

Ethereum Struggles to Complete above the 0.786 Bearish 5-0 ZoneWhile on the intra-bar price action on ETH has gotten pretty excited above the 0.786 it is still worth considering that ETH has not completed any bars above the 0.786 since the breakout and that at a moments noticed much of the current price action above the main 0.786 PCZ could later find itself being filtered out of the Renko charts as a whole depending on how many Average True Ranges above the 0.786 PCZ ETH possible move.
Based on the fact that the current candle is simply still in the projection phase I'd caution longs here and remain accumulative of longer dated puts. There is also a 2x leveraged ETF of ETH called ETHU which has OTM monthly call options trading at 20-40 dollar premiums. I'd consider farming off of those premiums in the form of Bear Vertical Spreads as a way to hedge off the costs of holding the long puts.
Overall, we are still trading at the PCZ of the Bearish 5-0 which seems to also be in the similar shape of a Bearish Head and Shoulders pattern; the measure move of which could take ETH down to around $355 upon the break of $1,600

BTC/USD 1D1. Price Structure and Patterns
Medium-Term Trend: Since mid-June, the price has been consolidating between ~$112,000 and ~$121,000, but with a slight upward slope.
Upward Channel: Marked with orange lines – the current candlestick is near the top of this channel.
Triangle Breakout: The white dashed line indicates an upward breakout from the converging triangle (symmetrical) formation, which could signal continued growth.
2. Support and Resistance Levels
Nearest Support:
USD 117,009 (Fib. Level 0.236 and local low)
USD 115,912 (SMA200 – red line)
USD 112,167 (lower consolidation boundary and prior support)
Nearest Resistance:
USD 121,151 (Fib. Level 0.382)
USD 123,966 (Fib. Level 0.5 – key psychological and technical resistance)
USD 126,781 (Fib. Level 0.618 – strong resistance)
USD 130,788 (Fib. Level 0.786 – breakout target)
3. Technical Indicators
MACD: The MACD line is beginning to intersect with the upside signal line – suggesting the beginning of upward momentum.
RSI: 59 – rising, but not yet in the overbought zone (above 70). This means there is room for further growth.
Moving Averages:
The SMA50 (~$114,020) and SMA200 (~$115,912) are below the price – a bullish pattern.
The price has rebounded from the SMA50, which is often a good starting point for further growth.
4. Scenarios
Bullish (more likely at this point)
If the price holds above $118,000 and breaks $121,151, a quick move to $123,966 and then $126,781 is possible.
Confirmation – the daily candle closes above $121,151 on increasing volume.
Bearish
If the price falls below $117,000, a retest of $115,912 is possible, followed by $112,167.
A break of $112,167 could signal a downtrend reversal.
5. Key Observations
Volume is increasing on bullish candles → a sign of accumulation.
The price is near strong resistance at $121,000–$122,000 – a correction is possible here.
Longer term (Fib from the March low), there is potential for a move towards $130,000–$135,000 if the trend continues.

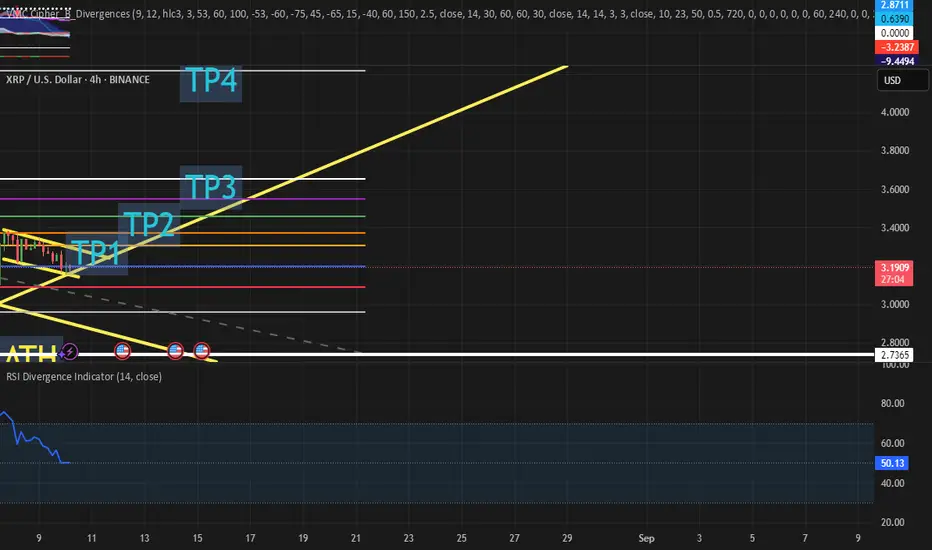
XRP long.. plan 8/10Xrp bouncing off the trend line from the most recent bounce from $2.72.. that was the 618 fib from April. strong level.. so its make it or break it from this $3.16/17 range. easy Sl under the wicks.. If it fails Id be looking for a $3.00 XRP.. would need to watch for conformations maybe a fail retest.. but well see .. Using the Fib levels as Tps.
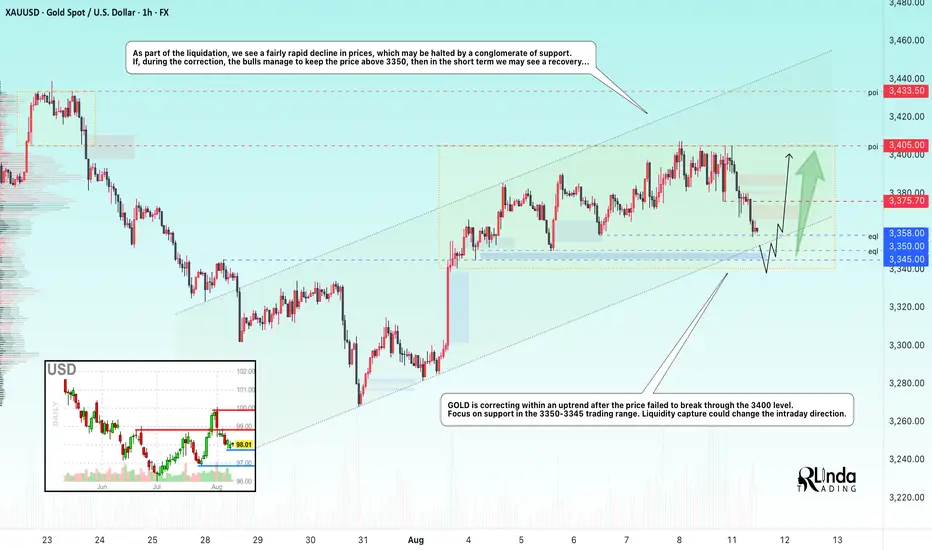
GOLD → Retest of support within an uptrendFX:XAUUSD is forming a liquidation phase as part of the previously mentioned bullish wedge pattern. Bulls were unable to break through the 3400 mark, and due to uncertainty, the price has entered a correction phase...
On Monday, gold fell to $3350, echoing the bearish sentiment in Asian trading, as $3400 remains an unattainable level. The pressure is intensified by weak data from China (PPI −3.6%), profit-taking and expectations for the US inflation report, as well as uncertainty in US-China trade negotiations and microchip policy. Optimism is being held back by expectations of Fed policy easing after negative statistics and forecasts of rate cuts, as well as possible meetings between US and Russian leaders. All this reduces demand for gold as a safe haven asset.
The focus is on the local trading range of 3400-3350. Before a possible rise, the market may test a strong support zone...
Resistance levels: 3376, 3405
Support levels: 3358, 3350, 3345
At the moment, we are seeing a retest of 3358 and a false breakdown, with a fairly weak reaction to the zone. In the short term, gold may test 3350-3345. A false breakdown and the bulls holding the price above this zone could bring the price back up...
Best regards, R. Linda!
$LINK Golden Cross Confirmed on DailyChainlink is looking extremely bullish here.
Closed above the 50% Gann Level and just had a GOLDEN CROSS.
Normally we see a pullback once this happens, but no sign of slowing down yet from CRYPTOCAP:LINK
Also worth noting LINK is breaking above the 50DMA against ETH.
This was added confirmation for the breakout with ETH / BTC.
Remember the rotation for Alt Season:
BTC > ETH > LARGE CAPS (pending) > Mid Caps > Micro Caps

ETHUSDT 12H chart uptrend1. Breaking out of the downward channel
• Black lines show an earlier inheritance channel.
• The course struck the mountain and it is quite dynamically, which is a strong upward signal.
2. Current price
• ETH is around USD 4,274, just below the resistance at USD 4,304.
• Another resistance is 4,484 USD (potential target if the upward trend persists).
3. Support
• The next support: 4,048 USD - if the course is corrected, then there may be the first "test".
• stronger support below: USD 3,930, $ 3,709, $ 3,487.
4. Indicators
• MacD: MacD line strongly above the signal, the histogram is growing - confirms the upward trend.
• RSI: around 75 - close to the purchase zone, which can mean a short -term correction, but with a strong RSI trend can stay high for a long time.
5. Scenarios
• Bull: Punction and maintenance above USD 4,304 can open the road to 4,484 USD and possibly higher.
• Bear: rejection from USD 4,304 and a descent below 4,048 USD may cause a deeper correction in the direction of $ 3,930 or even $ 3,709.
📌 The short -term market is warmed up, so a small pullback is possible, but the structure looks very bullshit after this burst from the downward channel.


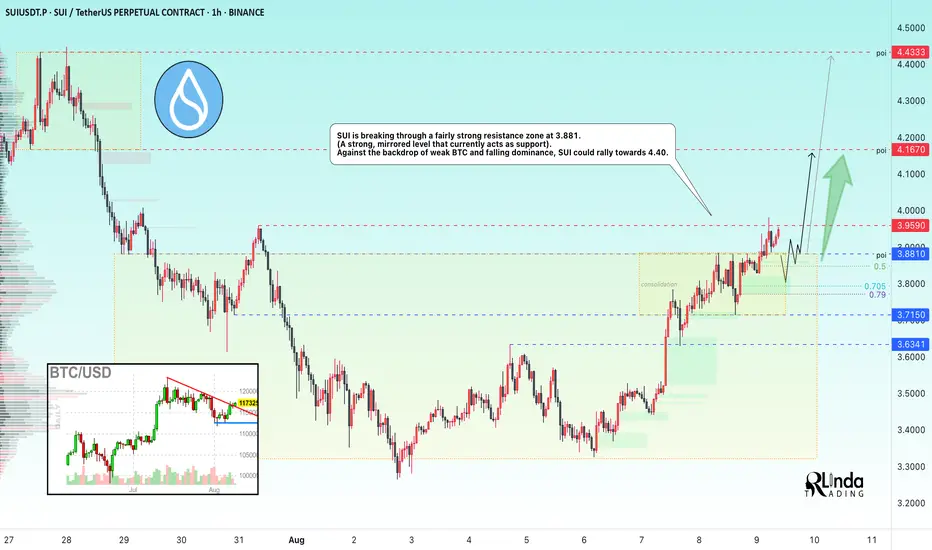
SUIUSDT → Resistance breakout and entry into the buying zoneBINANCE:SUIUSDT is breaking out of its trading range and local consolidation upward. Consolidation above the mirror level could trigger a continuation of the rally to 4.4 - 5.0.
Bitcoin has been trading in the red since the start of Saturday's session, but is gradually recovering. At this time, the altcoin market is rallying, while the Bitcoin dominance index is updating its decline
As for SUI, the coin is in a bullish trend both locally and globally, but ahead lies the 4.45 barrier, which separates the price from a rally to ATH. The coin is breaking through a fairly strong resistance zone at 3.881. (A strong, mirror level, which currently acts as support).
Resistance levels: 3.959, 4.167
Support levels: 3.881, 3.715
Since the price has entered the buying zone, there is a possibility of a retest of the mirror level and the liquidity zone that has formed below the specified support. If the bulls hold their defense above 3.88 - 3.9, then in the short and medium term, the price could show good growth...
Best regards, R. Linda!
ETH/USDT 12h chart1. Punction of the downward trend
• The black inheritance trend line has been broken up - this is a strong signal of Bycza.
• Breaking was confirmed by a strong candle movement and high growth dynamics.
⸻
2. Key levels of support and resistance
• Support:
• 3930 USDT - previous resistance, now the defensive zone with possible correction.
• 3709 USDT - deeper support.
• 3488 USDT - critical support, below which the upward trend would be negated.
• resistance:
• 4048 USDT - current local resistance (the candle touched and lightly reflected).
• 4304 USDT - another strong resistance.
• 4484 USDT - long -term resistance and potential goal when continuing to grow.
⸻
3. RSI
• RSI is around 70 - close to the purchase zone.
• suggests the possibility of a short correction or consolidation before the upward trend continues.
⸻
4. Scenarios
Bycza (continuation of growth)
• Maintenance above 3930 USDT.
• Breaking over 4048 USDT opens the road to around 4300–4480 USDT.
Bear (correction)
• Rejection to USDTT 4048 and a decrease below 3930 USDT may bring a rate to around 3709 USDT.

GOLD → A stalemate situation - a bullish wedgeFX:XAUUSD is unable to break through the resistance level of 3400. However, an ambiguous “bullish wedge” pattern is forming on the chart...
The price of gold retreated from a two-week high on profit-taking. The correction intensified after the US imposed tariffs on imports of gold bars (1 kg), which could disrupt supplies from Switzerland and London.
Key supporting factors: Escalation of trade conflicts, concerns about the US economy and pressure on the Fed, questions about the Fed's independence after Trump's appointments
Risks: Short-term volatility ahead of US CPI data next week. However, fundamental drivers remain bullish.
Support levels: 3390, 3350
Resistance levels: 3405, 3435
The problem with the bullish wedge pattern is that it forms an ambiguous figure. We have an upward movement, but the pattern could easily reverse the local upward trend due to the fairly difficult resistance zone of 3390-3410.
If gold manages to consolidate above 3405, this will increase the chances of growth to 3435-3500.
BUT! There is a fairly high chance that the 3390 support level could be broken. In this case, the market could fall to 3350 before rising...
Best regards, R. Linda!

EURUSD → The correction is over. Bullish trend...FX:EURUSD is consolidating above key support from D1. The trend is bullish, and against the backdrop of a weaker dollar, the currency pair is returning to its main movement.
The currency pair is forming a local uptrend, with a fairly clear upward support line that intersects with an important support level. The price has emerged from correction and returned to the trend amid a decline in the dollar, which is mainly bearish. Given the situation with EUR/USD, I would focus on the support zone of 1.1631 - 1.1613, 1.1597. A fairly large pool of liquidity has formed in this zone. A false breakdown and the price holding in the buy zone could trigger a bullish run...
Resistance levels: 1.1676, 1.171, 1.175
Support levels: 1.163, 1.161, 1.160
If the bulls keep the price in the buying zone, i.e. above the key support zone mentioned above, then in the medium term, the currency pair may continue to rise with the possibility of updating local highs...
Best regards, R. Linda!

GBPUSDNo surprises. As you know, cable and fibre move together! What we need to see is about a 50 pip move to reach the highlighted FVGs. The BoE was used to trigger the move and I still expect it to see it got higher, clearing the 1 hour equal highs!
Stay safe and don't blow your account!

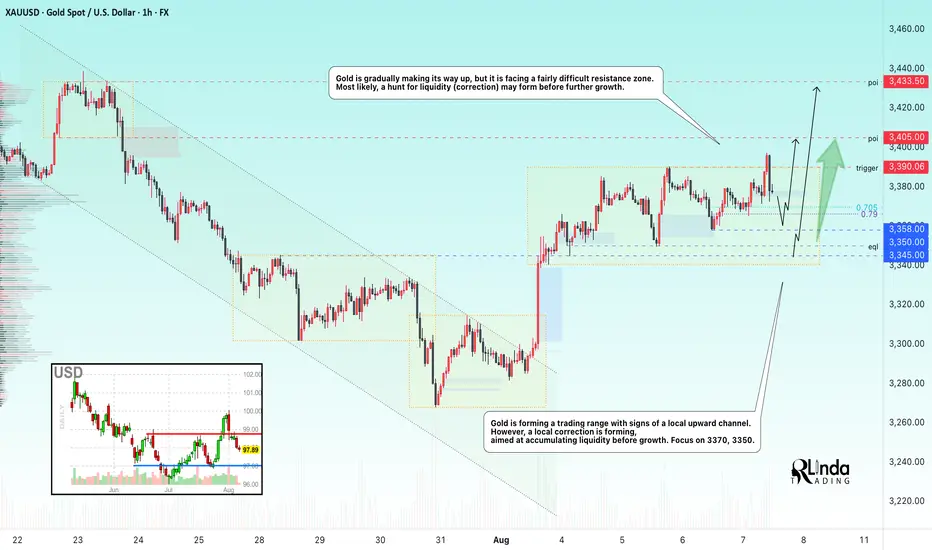
GOLD → Correction before a breakout and rallyFX:XAUUSD is gradually making its way upward, but it faces a fairly difficult resistance zone. Most likely, a long squeeze may form before further growth.
Gold is rising amid uncertainty: Expectations of key US labor market data (unemployment claims, labor costs), the possibility of a Fed rate cut in September after weak employment and services data, new trade threats (possible 15% tariffs on Japanese imports and restrictions on Russian oil supplies to China)
Key risks:
Trump's decision on Fed appointments (replacement of Kugler and Powell) and further escalation of trade conflicts could increase volatility. For now, dovish expectations and demand for safe-haven assets are supporting gold.
Technically, the focus is on the local range of 3390-3335 (3350). A false break of support could trigger growth...
Resistance levels: 3390, 3405, 3433
Support levels: 3365, 3358, 3350
The fall of the dollar is supporting the already bullish gold... However, before continuing its growth, the price is forming a correction, and a false breakout of support and liquidity capture could have a positive effect on the market for further upward movement...
Best regards, R. Linda!
BITCOIN → Retest of resistance in the bearish trading rangeBINANCE:BTCUSDT.P is consolidating in the range of 115,600 - 113,500. The price is testing resistance, relative to which a huge pool of liquidity has formed, which bears are likely to defend quite aggressively...
Idea from July 22: expectation of a decline from 120K to 112K. Target achieved
Bitcoin is correcting on D1, the price previously broke through the support level of 115650 and formed another trading range, with the previously broken lower boundary of the consolidation acting as resistance. The market has not yet tested the zones of interest at 110K and 105K, and therefore the possibility of a further decline remains relevant. A liquidity pool has formed relative to the resistance of the trading range at 115678. There is a high probability of a short squeeze before the decline.
Resistance levels: 115678, 116370
Support levels: 113530, 112660, 110K
In the short term, I expect a retest of resistance and a capture of liquidity. If the market is unable to continue its upward momentum and returns the price below the level, a false breakout will form, which may trigger a decline to the indicated areas of interest.
Best regards, R. Linda!

EURUSDPrice recently plunged into the deep and has now returned for fair value. We are already in a significant area, on a higher time-frame(1D), so any moment from now they can collapse it, much like last week! Be on the look-out like a meerkat!
1.1680 and 1.1720 are institutional price levels and price tends to have strong reactions in these areas. I expect to see that play out tomorrow.
The following reports will be used to trigger this move:
BoE Monetary Policy Report.
Continuing Jobless Claims 4-Week Average.
Initial Jobless Claims.
Unit Labour Costs.
Nonfarm Productivity.
Stay safe!

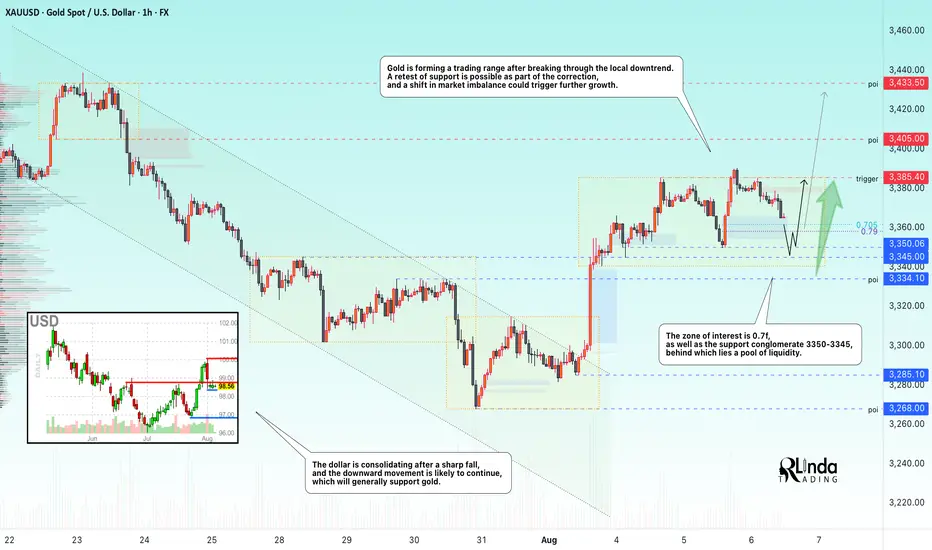
GOLD → Long squeeze of support ahead of possible growthFX:XAUUSD is entering a consolidation phase after a rally. The market is forming a trading range, and a retest of support could end in growth...
Gold pulled back from an 8-day high ($3391) on profit-taking ahead of Trump's Fed appointments. Weak ISM services data (50.1) and a pause in the dollar's weakening added pressure, although expectations of Fed policy easing in September remain supportive.
The market focus is on key events: Fed appointments (including a possible replacement for Powell) and Trump's trade statements. These factors could provide new momentum after the current correction, as long as the fundamental drivers for growth remain in place.
Resistance levels: 3385.4
Support levels: 3358, 3350, 3345
Technically, the price has confirmed resistance after a false breakout, and the market needs to build up potential for a possible continuation of growth. At the moment, the most likely scenario is a long squeeze (false breakdown) before growth continues. Focus on the key support zone.
Best regards, R. Linda!
USDCAD → Short squeeze for further declineFX:USDCAD is forming another short squeeze relative to the global price range ahead of a possible decline within the global downtrend.
After breaking through the resistance of the global trading range, USDCAD was unable to continue its upward momentum. The price returned to the range, under strong resistance, and is forming a pre-breakdown base for a possible decline. The trigger in our case is support at 1.3762. The dollar is stagnating, trading below strong resistance. A decline in the dollar could trigger a fall in USDCAD
Support levels: 1.376, 1.3695, 1.3629
Resistance levels: 1.3774, 1.3809
The market structure is quite weak, both globally and locally. In addition, against the backdrop of an expected rate cut, the dollar may continue its downward global trend, which may also affect the price of the currency pair, which has formed a false breakout of resistance...
Best regards, R. Linda!

Major U.S. News Ahead—Will EURUSD Pivot?Good morning, my friends 👋
Here’s my EURUSD market analysis 📉
Currently, the pair is in a downtrend. I expect this downward move to end around 1.14899 or 1.14536, where a potential buying opportunity may emerge. I personally plan to enter a buy position once price reaches those zones 💼
Also, keep an eye on major U.S. economic reports being released today—they could trigger increased volatility 🔔
Every like you send is a huge source of motivation for me to keep sharing high-quality analysis 🙏 Thanks to everyone supporting the channel 💙

USDCAD's Opportunity Bell Is Ringing — Don’t Miss Out!Hey there, my valued friends!
I’ve prepared a fresh USDCAD analysis just for you.
📌 If the 1.37245 level breaks, the next target will be 1.38000.
Every single like you send my way is the biggest motivation behind sharing these analyses.
🙌 Huge thanks to each and every one of you who supports me!
Would you like to add a visual or a catchy headline to boost engagement even more? I can help with that too.

Volatile Times for GBPJPY: What’s Going On Behind the Moves?Good morning, Guys,
I’m anticipating a new short opportunity on GBPJPY once the pair reaches my sell zone level. From there, my target is set at 197.934.
Every like from you is what truly motivates me to keep sharing these insights.
Massive thanks to everyone who shows love and support!

Dow Jones Potential DownsidesHey Traders, in today's trading session we are monitoring US30 for a selling opportunity around 44,300 zone, Dow Jones is trading in a downtrend and currently is in a correction phase in which it is approaching the trend at 44,300 support and resistance area.
Trade safe, Joe.
