HOW TO WATCHLIST ADVANCED VIEW PART-2 IN TRADINGVIEW1️⃣ Open Advanced View in the Watchlist
Open Trading-View.
On the right side, open the Watchlist panel.
If it is hidden → click the small arrow on the right edge.
At the bottom of the watchlist, click the icon that switches to Advanced View
(it looks like a more detailed/grid style layout).
Your watchlist will now show a table-style advanced view with multiple columns.
2️⃣ Open the Column Selector (where all tools live)
In Advanced View, move your cursor to the top header row (where the column names are).
Look for an option like “Add Column” or a “+” (plus) icon.
Click it → a panel or list opens with different categories:
Price
Financial
Risk
Technical
(names can appear as sections or tabs in the column selector window).
All four tools you mentioned are basically column groups you can add to the advanced view.
3️⃣ How to Use the Price Tool (Price Columns)
In the column selector, click on “Price”.
You will see different price-related fields, for example:
Last Price
Open
High
Low
Close
Change
Change %
Click on the fields you want to use (for example: Last Price, Change %).
These price columns will appear in your Advanced View table.
You can now:
Sort by a price column → click on the column name (e.g., “Change %”) to sort ascending/descending.
Reorder the column → drag the header left or right.
This helps you quickly see which symbols are moving the most in terms of price.
4️⃣ How to Use the Financial Tool (Fundamental Columns)
Open the column selector again → click “Financial”.
You will see fundamental / financial fields, for example (depending on symbol type):
Market Cap
P/E Ratio
EPS
Dividend Yield
Revenue, etc.
Click on the financial fields you want to add.
These financial columns now appear in the Advanced View.
You can:
Sort by any financial column (e.g., Market Cap to find largest companies).
Reorder the columns to keep important financial data together.
This is useful when you are comparing stocks by fundamentals, not just price.
5️⃣ How to Use the Risk Tool (Risk Metrics Columns)
In the column selector, click “Risk”.
Trading-View may show risk-related metrics such as (depending on symbol and your plan):
Volatility
Beta
Average True Range (sometimes under technical/volatility)
Other risk-style metrics, if available
Select the risk fields you want to track.
These risk columns appear in your table.
Now you can:
Sort by risk column (for example, volatility) to see which symbols are more active or more stable.
Combine risk columns with price columns to filter out too volatile instruments if you want.
This helps you understand how aggressive or calm each symbol is from a risk point of view.
6️⃣ How to Use the Technical Tool (Technical Metrics Columns)
Open the column selector → click “Technical”.
You’ll see technical-related fields, for example:
RSI value
Moving Average status (like “Price above/below MA”)
Overall technical rating (e.g., “Strong Buy / Buy / Neutral / Sell”)
Other built-in technical summary metrics.
Click on the technical fields you want to add.
These technical columns appear in Advanced View.
You can:
Scan quickly which symbols have strong technical rating.
Sort by RSI or rating to find overbought/oversold or technically strong/weak symbols.
This turns your watchlist into a mini technical scanner.
7️⃣ How to Reorder, Remove, and Clean Up Columns
🔹 Reorder Columns
Click and hold any column header (Price, Financial, Risk, Technical field).
Drag it left or right.
Release to place it where you want.
🔹 Remove a Column
Hover on the column header you want to remove.
Click the three-dot menu (⋮) or right-click (depending on layout).
Select “Remove Column”.
The column disappears from Advanced View.
8️⃣ Switch Back to Normal Watchlist View
At the bottom of the watchlist, click the List View icon (or original watchlist icon).
The watchlist will return to the compact standard view.
Advanced View settings are usually remembered, so when you come back, your columns are still there.
🔁 Short Recap (Good for on-screen text)
Open Watchlist → Switch to Advanced View
Click Add Column (+) → choose from Price / Financial / Risk / Technical
Add the fields you want → Columns appear in table
Sort by clicking column names
Drag to reorder, menu to remove
Switch back using List View icon
Financials

$UPST- A Black Friday SpecialUpstart chart is simple.
Channel held. Interest rates will continue to fall and will increase Upstart revenue. The effects of the interest rates will lag so it will take 3-6 months for the stock to reflect in price.
Targets:55,87, and 112
Time to final target: end of Q1 2026/ early Q2 2026
#SPY #QQQ #interestrates #financial

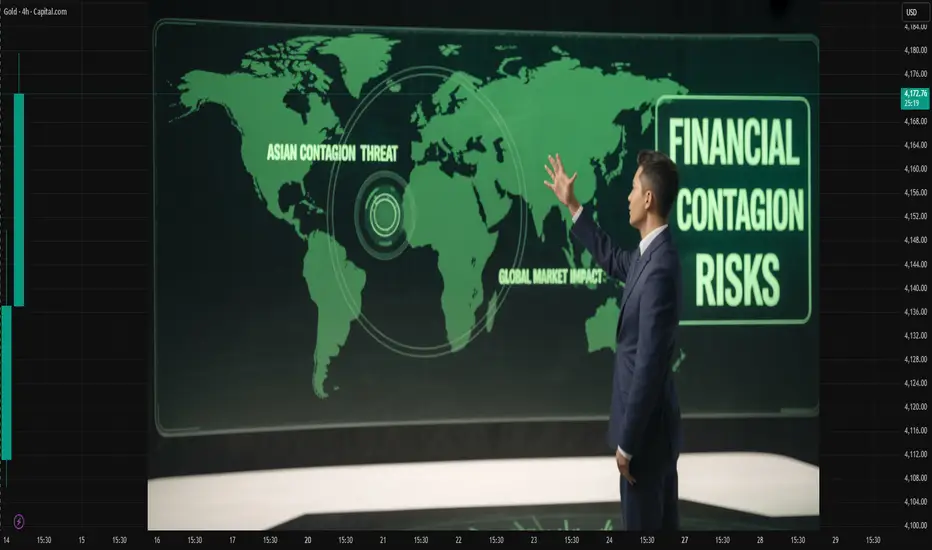
Financial Crises, Contagion, and Systemic Risk1. Introduction
Financial crises have been recurring features of the global economy, often bringing devastating consequences to nations, markets, and households. The 2008 Global Financial Crisis (GFC), the 1997 Asian Financial Crisis, and the 1930s Great Depression are stark reminders of the fragility of financial systems. These crises are not isolated events but often spread across markets and borders through interconnected channels—a phenomenon known as financial contagion. Underlying these episodes is the concept of systemic risk, which captures the potential for a local shock to destabilize an entire financial system.
Understanding the dynamics of financial crises, contagion, and systemic risk is vital for investors, policymakers, and regulators. This essay explores the causes, mechanisms, and implications of financial crises, the pathways of contagion, and the nature of systemic risk in the modern, globalized financial landscape.
2. Understanding Financial Crises
2.1 Definition and Nature
A financial crisis occurs when financial markets or institutions experience a sharp loss of value and functionality, leading to disruptions in credit flows, liquidity shortages, and sharp declines in asset prices. Crises can arise in various forms—banking crises, currency crises, sovereign debt crises, or asset price bubbles.
According to economists Carmen Reinhart and Kenneth Rogoff, financial crises share a “this-time-is-different” mentality, where excessive optimism blinds investors and policymakers to risks. Typically, a period of financial boom, high leverage, and speculative investment precedes a crisis, which eventually ends in panic and market correction.
2.2 Historical Context
The Great Depression (1929–1939): Triggered by a stock market crash in the U.S., it led to global economic contraction, massive unemployment, and bank failures.
The Asian Financial Crisis (1997–1998): Began in Thailand with the collapse of the baht and spread rapidly across Southeast Asia due to investor panic and capital flight.
The Global Financial Crisis (2008): Originating in the U.S. housing market and subprime mortgage sector, it spread worldwide due to the interconnectedness of global finance.
Each episode demonstrated how vulnerabilities in one part of the financial system can trigger chain reactions across sectors and borders.
3. Causes of Financial Crises
Financial crises arise from a combination of microeconomic behaviors and macroeconomic imbalances. Major causes include:
3.1 Excessive Leverage and Risk-Taking
Financial institutions often increase leverage—borrowing more relative to their equity—to amplify returns. However, when asset prices decline, leverage magnifies losses, threatening solvency. In 2008, investment banks like Lehman Brothers were highly leveraged (30:1), making them extremely vulnerable to market downturns.
3.2 Asset Bubbles
Speculative bubbles occur when asset prices rise far beyond their intrinsic value due to investor exuberance. When expectations reverse, the bubble bursts, triggering widespread losses. Classic examples include the dot-com bubble (2000) and the U.S. housing bubble (2006–2007).
3.3 Maturity and Liquidity Mismatch
Banks typically fund long-term loans with short-term deposits. When confidence erodes, depositors may withdraw funds en masse—a bank run—leading to liquidity crises. The collapse of Northern Rock in 2007 exemplified this mismatch.
3.4 Poor Regulation and Moral Hazard
Financial liberalization without adequate regulation often encourages excessive risk-taking. Moral hazard arises when institutions believe they are “too big to fail” and expect government bailouts, thus engaging in reckless behavior.
3.5 External Shocks
Global events—such as sharp oil price changes, geopolitical tensions, or pandemics—can also trigger financial crises by affecting investor sentiment, capital flows, and market stability.
4. Contagion: The Spread of Financial Crises
4.1 Definition and Mechanisms
Financial contagion refers to the spread of financial shocks from one institution, market, or country to others. It represents the “domino effect” in financial systems, where panic or losses in one region transmit rapidly across the globe.
Contagion operates through both real and financial channels:
Real channels involve trade linkages—declining demand in one country affects exports of trading partners.
Financial channels involve capital flows, asset correlations, and investor behavior.
4.2 Channels of Contagion
Common Investors: International funds holding assets in multiple countries may sell holdings across markets during crises, causing synchronized declines.
Bank Linkages: Global banks with cross-border exposures transmit shocks through the interbank lending market.
Exchange Rate and Interest Rate Movements: Currency devaluations in one country can pressure neighboring countries to devalue or raise interest rates.
Investor Herding and Panic: Behavioral contagion occurs when investors mimic others, driven by fear and uncertainty.
Information Asymmetry: Lack of transparent information leads investors to generalize risk across regions, withdrawing capital indiscriminately.
4.3 Examples of Financial Contagion
Asian Financial Crisis (1997): Thailand’s currency collapse spread rapidly to Malaysia, Indonesia, and South Korea, even though fundamentals differed.
Global Financial Crisis (2008): The fall of Lehman Brothers triggered global panic, freezing credit markets and causing stock markets worldwide to plunge.
European Sovereign Debt Crisis (2010–2012): Fiscal problems in Greece affected bond markets in Portugal, Spain, and Italy due to shared eurozone exposure.
4.4 Empirical Evidence
Empirical studies show that contagion tends to intensify during crises due to rising correlation between asset returns. For instance, during 2008–2009, correlations among global equity markets surged, reducing diversification benefits and amplifying systemic risk.
5. Systemic Risk: The Core of Financial Fragility
5.1 Definition
Systemic risk is the risk that the failure of a single financial institution or market segment will cause cascading failures, threatening the stability of the entire financial system. It arises from interconnectedness, complexity, and common exposures across institutions.
According to the Bank for International Settlements (BIS), systemic risk embodies “the risk of disruption to financial services caused by impairment of all or parts of the financial system, with potential serious negative consequences for the real economy.”
5.2 Sources of Systemic Risk
Interconnected Financial Networks: Banks, hedge funds, and insurers are linked through lending, derivatives, and payment systems.
Too-Big-to-Fail (TBTF) Institutions: Large institutions like JPMorgan or Citigroup can cause systemic collapse if they fail, leading to government intervention.
Shadow Banking System: Non-bank entities engaged in credit intermediation (e.g., money market funds, securitization vehicles) lack regulatory oversight but carry significant risk.
Procyclicality: During booms, leverage and asset prices rise together, but when the cycle reverses, the same mechanisms amplify losses.
5.3 Models of Systemic Risk
Network Models: Analyze how financial linkages transmit shocks. A dense network can either absorb small shocks or spread large ones rapidly.
CoVaR (Conditional Value at Risk): Measures how much one institution contributes to system-wide risk.
SRISK: Estimates the capital shortfall a financial institution would face during systemic crises.
5.4 Examples of Systemic Risk in Action
Lehman Brothers (2008): Its bankruptcy triggered a liquidity freeze across the global financial system, forcing governments to rescue other institutions.
AIG (2008): The insurer’s exposure to credit default swaps (CDS) required a $182 billion U.S. government bailout to prevent global contagion.
Long-Term Capital Management (1998): A hedge fund with massive leveraged positions almost caused systemic failure before coordinated central bank intervention.
6. The Role of Central Banks and Governments
6.1 Lender of Last Resort
Central banks play a critical role in crisis management by providing emergency liquidity to solvent but illiquid banks. The U.S. Federal Reserve’s interventions in 2008—such as the Term Auction Facility and quantitative easing—helped restore liquidity and confidence.
6.2 Fiscal Support and Bailouts
Governments may provide capital injections, guarantees, or nationalizations to stabilize critical institutions. The Troubled Asset Relief Program (TARP) in the U.S. and European Stability Mechanism (ESM) in the eurozone exemplify such efforts.
6.3 International Cooperation
Institutions like the International Monetary Fund (IMF) offer financial assistance and policy advice during crises. Coordination among central banks (e.g., swap lines) helps stabilize global liquidity.
7. Preventing and Managing Systemic Crises
7.1 Macroprudential Regulation
Regulators now focus on systemic stability rather than individual institutions. Tools include:
Countercyclical capital buffers
Liquidity coverage ratios
Stress testing
Leverage limits
7.2 Resolution Mechanisms
The creation of resolution frameworks ensures that failing institutions can be wound down without taxpayer bailouts. The Dodd-Frank Act (2010) in the U.S. introduced “living wills” for large banks to manage orderly failures.
7.3 Transparency and Risk Monitoring
Improved data sharing and disclosure reduce information asymmetry. The Financial Stability Board (FSB) monitors global systemic risks and coordinates regulatory reforms.
7.4 Role of Technology and Big Data
Advanced analytics, AI, and blockchain enhance risk detection and transaction transparency. Regulators use RegTech to monitor real-time financial stability indicators.
8. Behavioral Aspects of Financial Crises
Human psychology plays a pivotal role in creating and amplifying financial instability:
Herd Behavior: Investors follow the crowd, ignoring fundamentals.
Overconfidence: Market participants overestimate their ability to manage risk.
Loss Aversion: Fear of losses causes panic selling during downturns.
Moral Hazard: Belief in bailouts encourages risk-taking.
Behavioral finance highlights that market irrationality often drives asset bubbles and panic phases, making crisis prediction difficult.
9. Globalization and the Amplification of Contagion
The integration of global markets has intensified interdependence. While globalization facilitates capital mobility and diversification, it also magnifies vulnerabilities:
Cross-border banking linkages transmit shocks rapidly.
International investors move funds instantly in response to news.
Emerging markets are especially exposed to capital flow reversals and currency volatility.
Digitalization and high-frequency trading have further increased the speed of contagion—financial panic now spreads in hours rather than weeks.
10. Lessons from Past Crises
Transparency is crucial: Hidden leverage and off-balance-sheet risks often trigger crises.
Capital adequacy must be maintained: Stronger buffers help absorb shocks.
Global coordination matters: Isolated national policies cannot address global contagion.
Moral hazard must be controlled: Regulation should prevent excessive risk-taking by large institutions.
Crisis preparedness: Regular stress tests and crisis simulations enhance system resilience.
11. Future Outlook and Emerging Risks
As financial systems evolve, new forms of systemic risk emerge:
Cyber Risk: Cyberattacks on banks or payment systems could paralyze global finance.
Climate Risk: Physical and transition risks from climate change may impact asset valuations.
Crypto and Decentralized Finance (DeFi): Lack of regulation and interconnectivity between crypto assets and traditional finance can generate new contagion channels.
Artificial Intelligence and Algorithmic Trading: Automation could amplify volatility during shocks.
Regulatory frameworks must evolve continuously to manage these emerging threats while balancing innovation and stability.
12. Conclusion
Financial crises, contagion, and systemic risk are deeply interwoven aspects of modern finance. The complexity and interconnectedness of global markets mean that localized shocks can rapidly escalate into systemic events, endangering economies and livelihoods. While improved regulation, technology, and international cooperation have strengthened financial systems since 2008, vulnerabilities persist—especially amid globalization, digitalization, and geopolitical uncertainty.
To prevent future crises, policymakers must adopt a macroprudential and forward-looking approach, balancing innovation with stability. Understanding the mechanisms of contagion and the roots of systemic risk is essential not only for regulators but for investors and societies at large. Ultimately, financial stability is not merely a technical issue—it is a cornerstone of economic and social resilience.
Overtrading: Understand Now to Avoid Mistakes!Hey everyone! 👋
I know that in the world of trading, it’s easy to let emotions take over, especially after a losing streak. Overtrading is one of those invisible enemies that you need to identify and avoid as soon as possible.
1 | What is Overtrading? 💡
Overtrading happens when you take too many trades, usually driven by emotions, especially when you feel the need to "recover" losses from a losing streak. At this point, your decisions are no longer based on technical analysis or your strategy; instead, they are impulsive reactions that lead you to take on more risk.
2 | Psychological and Financial Consequences 😞
Psychological:
When overtrading, you start to feel stressed, exhausted, and lose mental clarity for decision-making. Feelings of disappointment creep in, and gradually, you lose confidence and patience, leaving space only for anxiety.
Financial:
Overtrading also quickly drains your account. Increased transaction fees, prolonged losses, and lack of discipline wear down your capital. Over time, you could lose trust in yourself and compromise your financial stability.
3 | How to Protect Yourself? 💪
To avoid overtrading, the key is having a strict trading plan. Limit the number of trades you take each day, set specific trading hours, and establish clear objectives. Learning patience is crucial — sometimes, the best move is not to trade at all!
Remember: When you have a clear plan and stick to your discipline, you’ll be able to control your emotions and avoid impulsive decisions.
Wishing you all successful and smart trading! 💥
If you found this article helpful, don’t forget to share it and leave your thoughts in the comments. Let’s keep learning and growing together every day! 🙌
Don’t let emotions control you. Let reason guide your trading!
American Financial Pulse: U.S. Markets Shape the Global Economy1. The Rise of U.S. Financial Dominance
After World War II, the world needed stability — and the United States provided it. The Bretton Woods Agreement (1944) established the U.S. dollar as the central pillar of the international monetary system. With the world’s gold reserves concentrated in America, other countries pegged their currencies to the dollar.
Even after the gold standard ended in 1971, the dollar’s dominance remained intact. U.S. financial markets grew deeper, more liquid, and more sophisticated than any other. Investors from around the world began to see U.S. Treasury securities as the safest asset, and corporations preferred raising funds through American capital markets.
By the 21st century, Wall Street had become the nerve center of global finance, home to some of the largest and most influential institutions — Goldman Sachs, JPMorgan Chase, Morgan Stanley, Citigroup, and others.
2. Wall Street: The Barometer of Global Sentiment
When the New York Stock Exchange (NYSE) or NASDAQ moves, the world pays attention. Wall Street’s performance often sets the tone for markets across Asia and Europe.
Bullish sentiment in the U.S. can lift markets worldwide, signaling economic optimism and boosting commodity prices.
Bearish or volatile trends, on the other hand, can spark global risk aversion, leading to sell-offs in emerging markets.
For instance:
The 2008 Global Financial Crisis, which started with the collapse of U.S. housing markets, triggered the worst worldwide recession since the Great Depression.
The tech boom of the 2010s, driven by Silicon Valley giants like Apple, Microsoft, and Amazon, created wealth and innovation ecosystems that influenced startups and stock markets globally.
In short, Wall Street isn’t just America’s financial hub — it’s the world’s emotional pulse of risk and reward.
3. The U.S. Dollar: The Global Reserve Currency
The U.S. dollar is the king of currencies — a symbol of trust, strength, and stability. Around 60% of global foreign exchange reserves are held in dollars, and most international trade and commodities (like oil and gold) are priced in USD.
This dominance gives the U.S. a unique “exorbitant privilege” — the ability to borrow cheaply, attract global capital, and wield financial sanctions effectively.
When the Federal Reserve raises or cuts interest rates, it doesn’t just affect the U.S. — it reshapes capital flows globally. A stronger dollar often leads to:
Capital outflows from emerging markets,
Currency depreciation in developing economies, and
Higher import costs for countries that rely on dollar-denominated trade.
Conversely, a weaker dollar can boost global liquidity and commodity prices, supporting international growth.
4. The Federal Reserve: The World’s Central Bank
The Federal Reserve (Fed) is not just America’s central bank — it’s the de facto central bank of the world.
Its policies on interest rates, inflation control, and money supply influence nearly every financial market globally. When the Fed tightens or loosens monetary policy, it sets off a chain reaction:
Bond yields shift across continents.
Exchange rates fluctuate.
Stock markets either rally or crash.
Take 2022–2023, for example: the Fed’s aggressive rate hikes to fight inflation caused global investors to flock to the dollar, leading to currency depreciation in Europe, India, and Japan. Developing nations faced capital outflows and rising borrowing costs, proving once again how America’s monetary policy reverberates worldwide.
5. U.S. Tech Giants and Their Global Economic Influence
Beyond monetary policy, corporate America also drives global trends. Tech companies such as Apple, Microsoft, Amazon, Google, Meta, and Tesla not only dominate U.S. indices like the NASDAQ but also shape global consumer behavior, innovation cycles, and investment trends.
Their market capitalization exceeds the GDP of many countries.
Global funds benchmark their performance against these companies.
Even non-U.S. economies depend on their supply chains and technologies.
For instance, Apple’s supply chain decisions in China or India influence local employment, manufacturing, and even government policy. Similarly, Tesla’s electric revolution has pushed automakers worldwide to accelerate their shift toward EVs.
These corporations make the American economy a key driver of global innovation and productivity.
6. The U.S. Bond Market: The Global Safe Haven
The U.S. Treasury market, valued at over $27 trillion, is the most liquid and trusted debt market in the world.
In times of global uncertainty — wars, pandemics, recessions — investors rush to buy U.S. bonds, driving up their prices and lowering yields. This phenomenon is known as a “flight to safety.”
For example:
During the COVID-19 pandemic, despite global chaos, demand for U.S. bonds surged.
Even amid geopolitical tensions like the Russia-Ukraine conflict, U.S. Treasuries remained the go-to safe asset.
This trust reinforces the U.S. government’s financial supremacy, allowing it to borrow at low rates and sustain high fiscal spending without immediate repercussions.
7. American Trade and Global Supply Chains
America’s financial strength isn’t just about Wall Street — it’s also about trade and consumer power. The U.S. is one of the largest importers and consumers in the world.
When American demand rises, exporters from China, India, Germany, and others benefit. When it slows, global trade suffers.
For instance:
The 2020–21 pandemic recovery in the U.S. boosted demand for goods, lifting export economies.
But slowing U.S. consumer spending in 2023–24 led to reduced factory orders worldwide.
Thus, the American consumer acts as the ultimate engine of global trade — their spending decisions echo through factories, ports, and currencies around the world.
8. U.S. Sanctions and Financial Power as a Tool of Diplomacy
One of the most significant, yet often overlooked, aspects of America’s financial influence is its ability to use economic sanctions as a form of global control.
Because the U.S. dollar dominates international transactions, most global banks and businesses rely on access to U.S. financial systems like SWIFT. When the U.S. imposes sanctions on countries like Iran, Russia, or Venezuela, it effectively isolates them from global finance.
This demonstrates the geo-financial power of America — the ability to influence political outcomes through control of money flow, rather than military force.
9. U.S. Market Crises and Global Shockwaves
History shows that financial turbulence in America often triggers worldwide crises:
1929: The Wall Street crash led to the Great Depression, spreading poverty and unemployment globally.
1987: Black Monday caused global stock market collapses within hours.
2008: The subprime mortgage meltdown triggered a global recession.
2020: The COVID-induced crash saw trillions wiped out globally within weeks.
Each time, recovery depended heavily on U.S. fiscal stimulus and Federal Reserve actions — highlighting both the risks and the resilience of America’s central role.
10. America’s Role in Emerging Market Dynamics
Emerging economies — such as India, Brazil, South Africa, and Indonesia — often experience boom-bust cycles tied to U.S. financial trends.
When U.S. interest rates are low, investors chase higher returns in emerging markets, driving asset prices up. But when the Fed tightens policy, capital retreats to the U.S., leaving these economies vulnerable to currency depreciation and inflation.
This cyclical dependency shows how America’s financial health acts as both an opportunity and a threat for developing nations.
11. The Future: Can the World De-Americanize Finance?
In recent years, there’s been growing talk of “de-dollarization” — the effort by countries like China, Russia, and members of BRICS to reduce dependence on the U.S. dollar.
While alternative payment systems and local-currency trade agreements are emerging, the U.S. still holds structural advantages:
Deep and transparent financial markets,
Strong legal systems,
Global investor trust, and
A culture of innovation.
Even as digital currencies and blockchain-based settlements evolve, the U.S. remains a central force in shaping the future of finance — through regulation, technological leadership, and institutional power.
12. Conclusion: The Unshakable Financial Pillar
America’s financial influence over the global market is a blend of trust, size, innovation, and history. Its currency drives trade, its markets dictate sentiment, and its policies shape growth trajectories worldwide.
From Wall Street traders to policymakers in Asia, from African commodity exporters to European bankers — all keep an eye on what happens in the United States.
While global diversification and regional powers continue to grow, the American financial system remains the spine of international economics. Its rhythm — whether fast or slow — continues to set the pace for the global financial symphony.

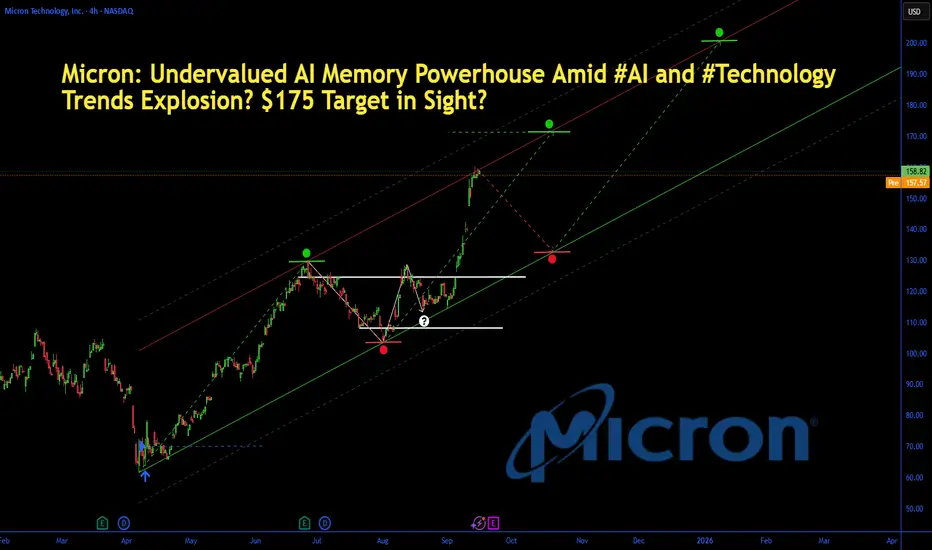
Micron: AI Memory Powerhouse Amid #AI and #TechnologyMicron: Undervalued AI Memory Powerhouse Amid #AI and #Technology Trends Explosion? $175 Target in Sight?
Micron (MU) shares hit a new 52-week high of $158.28 today, up 1.2% amid surging AI data center demand and institutional buying, with the stock soaring 86.8% YTD on memory chip tailwinds.
As Q4 fiscal 2025 earnings loom on September 23—projecting 58% EPS jump to $1.29 on $8.7B revenue—analysts have hiked targets to $175, implying 10%+ upside. Just as #AI racks up 17K mentions and #technology trends with 46K on X today (fueled by AI video generators and chip hype), Micron's HBM3E tech for Nvidia GPUs positions it as the undervalued play in the $200B+ semiconductor memory market.
But with forward P/E at 12x, is MU set to ride the AI wave higher, or will supply gluts cap the rally? Let's unpack the fundamentals, SWOT, charts, and setups for September 17, 2025.
Fundamental Analysis
Micron's resurgence is driven by AI hyperscaler demand for high-bandwidth memory (HBM), with Q2 fiscal 2025 revenue hitting $9.3B (up 93% YoY) and data center sales doubling to $2.2B.
Analysts forecast 2025 revenue of $38.5B (up 50% YoY), as HBM capacity ramps to 250K wafers amid #AI trends exploding on social media. Trading at 18% below fair value per DCF, MU's undervaluation shines with gross margins rebounding to 37%—but cyclical DRAM risks could flare if PC demand softens.
- **Positive:**
- AI boom ties into today's #technology hype, with HBM3E sales projected at $2.5B in FY2025; institutional stakes rising signal confidence.
- Q2 EPS beat of $1.18 (vs. $1.00 est.) and $1.6B FCF undervalues the stock at 12x forward earnings vs. sector 25x.
- Broader trends in edge AI and automotive chips position MU for 20%+ CAGR, amplified by #AI video generator virality.
- **Negative:**
- Inventory overhang from prior cycles could pressure pricing, clashing with #technology optimism if China trade tensions escalate.
- High capex ($8B annually) strains balance sheet if AI adoption slows amid economic jitters.
SWOT Analysis
**Strengths:** Leadership in DRAM/NAND with 20%+ market share; AI-optimized HBM tech generates 50%+ gross margins, amplified by #AI relevance in data centers.
**Weaknesses:** Cyclical exposure to consumer electronics; $7.8B net debt limits agility in a volatile #technology market.
**Opportunities:** HBM ramp to meet Nvidia/AMD demand unlocks $5B+ revenue; undervalued at 12x P/E amid 58% EPS growth and #AI boom on X.
**Threats:** Supply chain disruptions from geopolitics; competition from Samsung/SK Hynix capitalizing on #technology trends.
Technical Analysis
On the daily chart, MU is in a parabolic uptrend, breaking 52-week highs after consolidating above $140 support, with volume exploding on AI news and mirroring #AI volatility spikes. The weekly shows a cup-and-handle breakout from summer lows, now accelerating higher. Current price: $158.28, with VWAP at $156 as intraday pivot.
Key indicators:
- **RSI (14-day):** At 74, overbought but fueled by momentum—watch for consolidation amid #technology surges. 📈
- **MACD:** Bullish crossover with surging histogram, confirming AI-driven acceleration; minimal divergence. ⚠️
- **Moving Averages:** Price crushing 21-day EMA ($145) and 50-day SMA ($130), golden cross locked in.
Support/Resistance: Key support at $150 (recent breakout and 50-day SMA), resistance at $165 (Fib extension) and $175 (analyst target). Patterns/Momentum: Cup-and-handle targets $200; strong buy signals. 🟢 Bullish signals: Volume on earnings hype. 🔴 Bearish risks: Overbought RSI could pull back 5-8% on profit-taking.
Scenarios and Risk Management
- **Bullish Scenario:** Smash $165 on earnings beat or #AI catalyst targets $175 short-term, then $200 by year-end. Buy dips to $150 for entries tied to tech trends.
- **Bearish Scenario:** Breach $150 eyes $140 (200-day EMA); supply news amid #technology fade could retrace 10%.
- **Neutral/Goldilocks:** Range-bound $150–$165 if data mixed and #AI cools, ideal for straddles pre-earnings.
Risk Tips: Set stops 3% below support ($145.50) to tame volatility. Risk 1-2% per trade. Diversify with NVDA or SMH to hedge semi correlations.
Conclusion/Outlook
Overall, a bullish bias if MU holds $150, supercharged by today's #AI and #technology trends, cementing its undervalued status with 40%+ upside on memory demand. But watch September 23 earnings for confirmation—this fits September's chip rotation amid viral AI hype. What’s your take? Bullish on MU amid #AI chip trends or fading the rip? Share in the comments!
Bearish potential detected for AFIEntry conditions:
(i) lower share price for ASX:AFI along with swing of DMI indicator towards bearishness and RSI downwards, and
(ii) observing market reaction around the share price of $7.32 (open of 11th August).
Depending on risk tolerance, the stop loss for the trade would be:
(i) above the potential prior resistance of $7.50 from the open of 28th July, or
(ii) above the potential prior resistance of $7.57 from the open of 21st July, or
(iii) above the previous swing high of $7.68 from 31st July.

ETHUSD: Financial and Market ReportPremise: This report provides a detailed, professional analysis of Ethereum (ETH), the second-largest cryptocurrency by market capitalization.
Data are sourced from reliable providers such as CoinMarketCap, Etherscan, DeFiLlama, Glassnode, and web research current to 2025.
On-chain data are separated from market analysis and qualitative opinions. Citations are indicated inline for traceability.
Forecasts are based on historical trends and macro scenarios and do not constitute financial advice.
All values are in USD.
1. Asset Overview
Project Summary, Underlying Technology, History and Team / Key Contributors
Ethereum is a decentralized open-source blockchain that serves as a platform for decentralized applications (dApps), smart contracts, and ERC-20/ERC-721 tokens. The underlying protocol has used Proof-of-Stake (PoS) since 2022 (The Merge). ETH is the native network token. The chain supports the EVM (Ethereum Virtual Machine) for executing Turing-complete code.
History: Vitalik Buterin’s whitepaper (2013), ICO in 2014 raising $18.3M in BTC, mainnet launch 30 July 2015 (Frontier). Key upgrades: Constantinople (2019), London (2021 — EIP-1559 fee burning), The Merge (Sept 2022 — PoS, ~99.95% energy reduction), Shapella (2023 — staking withdrawals), Dencun (2024 — proto-danksharding for L2 scalability), Pectra (May 2025 — account abstraction and increased blob throughput).
Core contributors include Vitalik Buterin, Charles Hoskinson (ex-Cardano), and Gavin Wood (Polkadot). Development coordination is led by the Ethereum Foundation (non-profit), with contributions from ConsenSys and a global developer community.
Primary Use Case, Tokenomics and Governance
Primary use case: Layer-1 platform for DeFi (lending, DEXs), NFTs (digital art, gaming), asset tokenization and dApps (social tokens, supply chain). Dominant L1 for smart contracts with >$93B TVL in DeFi.
Tokenomics:
Max supply: Unlimited (no hard cap).
Circulating supply: 120.7 million ETH (as of Oct 2, 2025).
Emission schedule: Post-Merge issuance reduced ~90% to ~972,000 ETH/year (staking issuance). EIP-1559 burns base fees, making supply potentially deflationary during high network activity. Since 2022 4.5M ETH burned; net supply modestly up (+0.8% annualized since 2021).
Governance: Primarily off-chain via community processes (Ethereum Magicians, All Core Devs Calls) and on-chain via EIPs. No centralized control; protocol changes require multi-stakeholder consensus.
2. On‑Chain Data and Economic Metrics
Total Supply, Circulating Supply and 3‑Year Changes
Total supply equals circulating supply (120.7M ETH). From 2022–2025 supply grew ~0.8% annually despite burns, as PoS issuance exceeded burns during low activity periods. Annual snapshots:
2022 (post‑Merge): ~120.2M ETH (+0.2% net).
2023: ~120.4M (+0.17%; 1.7M issued vs 1.3M burned).
2024: ~120.6M (+0.17%; deflationary in Q1, inflationary Q2–Q4).
2025 (Q3): 120.7M (+0.08%; 540,958 ETH issued vs 465,657 ETH burned YTD).
Year Starting Supply (M ETH) Net Issuance (ETH) Burn (ETH) Ending Supply (M ETH) Change %
2022 120.0 +972,000 -1,200,000 120.2 +0.2%
2023 120.2 +972,000 -1,300,000 120.4 +0.17%
2024 120.4 +972,000 -1,400,000 120.6 +0.17%
2025 (YTD) 120.6 +540,958 -465,657 120.7 +0.08%
Sources: Ultrasound.money, Etherscan.
Key On‑Chain Metrics
Active addresses (daily): 553,404 (24h; 2025 avg ~500k).
Daily transactions: 1.82M (24h; 2025 avg ~1.5M; 2022 peak 734k/day).
On‑chain volume: ~$4–5B/day (24h recent).
Average fees: 0.65 Gwei (~$0.06/tx; 2025 average ~$3.78/tx post‑L2).
Staking rate: ~29% of supply staked (35M ETH; ~1M validators).
Usage Metrics
DeFi TVL: $93.493B (Ethereum chain).
Smart contracts deployed: ~41M (historical), ~11B interactions.
NFT metrics: Volume ~$10–15B/year (2025), with peaks on OpenSea (Wyvern protocol).
Economic Indicators
Market cap: $537.23B.
Fully diluted market cap: $536.01B.
MVRV ratio: ~2.4 (elevated unrealized profits; >3.5 = bull extremes, <1 = bear).
SOPR: ~1.05 (slight net on‑chain profits).
NVT ratio: High (~100–150), indicating premium to transaction volume (analogous to P/E).
Holder turnover: Low (~0.1–0.2/yr — HODL behavior).
% held by beacon/exchanges/whales: ~54.6% in Beacon Deposit Contract; top exchanges: Coinbase 4.93M ETH, Binance 4.23M ETH; addresses >1% supply ≈30%.
Sources: Glassnode, CoinMarketCap.
3. Market & Price Analysis
Price Performance (last 12 months) and Notable Historicals
Oct 2024–Oct 2025: price range $1,471 (Apr 2025 low) to $4,831 (Aug 2025 high), ~+35.41% YTD. Average volumes: $45.46B/24h.
2025 performance: +191% from lows, with significant Q1 volatility.
Historical Volatility and Benchmark Comparison
30‑day volatility: ~50–60% (2025), higher than BTC (~40%). Beta vs BTC: ~1.2 (ETH more sensitive to macro shocks). Outperformed crypto index (CMC 200) by ~+15% YTD.
Liquidity and Market Depth
Top exchanges by volume: Binance (5% volume, $2.27B/24h), Bybit ($640M), Coinbase ($566M), OKX ($635M).
Bid‑ask spread: ~0.025% (tight).
Depth: ~$15–16M within ±0.1% price.
OTC desks account for significant institutional flows (~20–30%).
4. Technical Analysis (Brief)
Key Support & Resistance
Daily timeframe: Support $3,900–$4,000; Resistance $4,200–$4,263.
Weekly timeframe: Support $3,825; Resistance $4,600–$4,800.
Indicators & Recent Patterns
RSI (14): 45.7 (neutral; oversold ~34; >50 bullish).
MACD (12,26): Negative (signal bearish momentum but weakening).
Moving averages: Price below EMA 20/50 ($4,263/$4,212), above EMA 200 ($3,500); recent 50/200 death cross.
Price pattern: Sideways channel $3,800–$4,500; potential volume breakout; corrective double zigzag (W‑X‑Y).
Note: Subjective analysis; not trading signals.
5. Fundamental & Network Analysis
Roadmap, Partnerships, Recent Upgrades and Audits
Roadmap emphasizes scalability (Fusaka 2025 for PeerDAS, targeted +10x L2 throughput; Glamsterdam 2026 for Verkle trees). Recent: Pectra (May 2025, account abstraction, EIP-3074 wallet functionality). Integrations with major L2s (Arbitrum, Optimism). Auditing promoted by Ethereum Foundation (examples: SEAL audits); EIP-7907 (2025) introduced DoS protections.
Direct Competitors and Competitive Position
Competitors: Solana (very high TPS, higher revenue but outages), BNB Chain (large active user base, low fees), Polygon (L2/commit-chain). Ethereum remains the dominant EVM-compatible L1 leader for DeFi/NFTs, but faces competition on speed and cost.
Specific Risks
Smart contract vulnerabilities (reentrancy, oracle manipulation — e.g., Penpie hack 2024 ~$27M).
Regulatory risk (token utility classification, scrutiny of staking/ETFs).
Centralization concerns (54.6% in Beacon Deposit Contract; top addresses concentration; centralized L2 sequencers).
Dependence on external oracles and bridges (single‑point failures, bridge exploits).
Sources: Ethereum whitepaper, audit reports, industry articles.
6. Outlook & Scenarios
Qualitative Forecasts (1–3 years)
Conservative (2026–2028): $6,000–$8,000 (slower adoption, tighter regulation).
Base case: $10,000–$12,000 (DeFi/NFT growth, ETF inflows ~$27.6B; burn > issuance during high activity).
Optimistic: $15,000+ (strong institutional adoption, Fusaka delivering throughput; TVL >$150B, staking 40%).
Trends: increased corporate staking ($7.65B), L2 scalability, RWA tokenization.
Primary Drivers
Positive: ETF inflows, scalability upgrades (PeerDAS), increased DeFi/NFT adoption, macro crypto bull cycles.
Negative: L1 competition (Solana revenue growth), low network activity (burn < issuance), regulatory/tax developments.
Risk Mitigation Strategies
Diversify into L2s and select competing L1s.
Use hardware wallets for custody; split staking from hot wallets.
Employ multiple oracles and require audits before contract deployment.
Use stop‑losses for volatility; stake portion (20–30%) for yield (3–5%).
7. Conclusion & Recommendations
Risk/Reward Summary
ETH offers high upside potential (possible +100% over 1–3 years) due to DeFi dominance and structural deflation mechanics, but carries high risk (~50% volatility, regulatory and smart contract threats). Risk/return profile: high, suited to risk‑tolerant investors.
Operational Recommendations
Investors: accumulate under $4,000 for long‑term hold (1–3 years); take‑profit target $6,000 (2026); stop‑loss $3,500.
Holders: stake 20–30% to earn yield; monitor MVRV <1 as accumulation signal. Time horizon: mid‑term bull (2026+).
Strengths & Weaknesses
Strengths: mature ecosystem (TVL $93B), L2 scalability path, EIP‑1559 deflationary mechanism potential.
Weaknesses: higher base‑layer fees, staking centralization, oracle/bridge dependencies.
Sources: CoinMarketCap, Etherscan, Glassnode, Ethereum.org, DeFiLlama, CoinDesk, arXiv, CryptoSlate.

Bearish potential detected for BENEntry conditions:
(i) lower share price for ASX:BEN along with swing of DMI indicator towards bearishness and RSI downwards, and
(ii) observing market reaction around the share price of $12.44 (open of 23rd June).
Depending on risk tolerance, the stop loss for the trade would be:
(i) above the potential prior resistance of $12.84 from the open of 11th June, or
(ii) above the potential prior resistance of $12.90 from the open of 11th July, or
(iii) above the declining 10 day moving average (currently $13.02), or
(iv) above the low of the range of day prior to the gap-down (1st September) of $13.10.

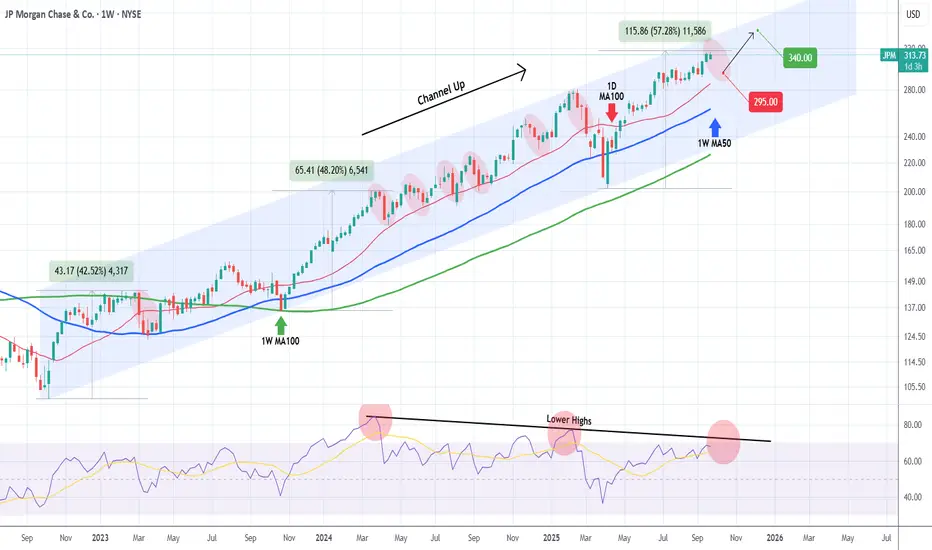
JP MORGAN In need of a relief correction.Last time we took a look at JP Morgan Chase (JPM) was 5 months ago (April 28, see chart below), issuing a strong long-term buy signal, which 2 weeks ago hit our $310 Target:
This time, having already completed a +57.28% rise from the April 07 bottom (Higher Low for the 3-year Channel Up), we expect a medium-term pull-back towards its 1D MA100 (red trend-line), which has systematically been its most common buy entry. The 1W MA50 (blue trend-line) - 1W MA100 (green trend-line) Zone has been the ultimate buy range but since March 2023 has only emerged 3 times.
As a result, given the trajectory of the 1D MA100, we expect the stock to pull-back to $295.00 and if it holds, rebound for an end-of-year rally to $340.00.
-------------------------------------------------------------------------------
** Please LIKE 👍, FOLLOW ✅, SHARE 🙌 and COMMENT ✍ if you enjoy this idea! Also share your ideas and charts in the comments section below! This is best way to keep it relevant, support us, keep the content here free and allow the idea to reach as many people as possible. **
-------------------------------------------------------------------------------
💸💸💸💸💸💸
👇 👇 👇 👇 👇 👇
Financial Market CoverageUnderstanding the Backbone of Modern Finance
Introduction
Financial markets are the lifeblood of the global economy. They provide the infrastructure for the allocation of capital, risk management, and wealth creation. However, the true power of financial markets lies not just in their existence, but in how they are observed, analyzed, and reported. This is where financial market coverage comes in—an essential mechanism that informs investors, regulators, policymakers, and the public about the constantly evolving financial ecosystem.
Financial market coverage is more than reporting stock prices or bond yields. It encompasses the analysis of macroeconomic trends, corporate performance, policy changes, market sentiment, and geopolitical events. Effective coverage ensures transparency, fosters confidence, and enables participants to make informed decisions. In this discussion, we will explore the scope, methods, challenges, and future of financial market coverage.
The Scope of Financial Market Coverage
Financial market coverage extends across multiple segments, each with its unique nuances and stakeholders. Key areas include:
1. Equity Markets
Equity markets, or stock markets, are arguably the most visible segment. Coverage here involves:
Stock Price Movements: Tracking real-time prices, indices, and market trends.
Company Analysis: Evaluating earnings, management strategies, mergers, acquisitions, and other corporate actions.
Sectoral Analysis: Comparing performance across sectors such as technology, healthcare, or energy.
Market Sentiment: Understanding investor psychology through trading volume, options activity, and news flow.
2. Fixed Income and Bond Markets
Bond markets are critical for funding governments and corporations. Coverage involves:
Yield Movements: Monitoring interest rate trends, yield curves, and bond spreads.
Credit Analysis: Assessing corporate and sovereign creditworthiness.
Policy Implications: Evaluating central bank actions and their effects on debt markets.
3. Derivatives and Commodities
Derivatives such as futures and options provide hedging and speculative opportunities. Coverage includes:
Price Volatility: Tracking commodity prices (oil, gold, agricultural products) and derivative contracts.
Market Structure: Observing open interest, options chains, and leverage trends.
Risk Indicators: Monitoring implied volatility indices like VIX.
4. Foreign Exchange and Currency Markets
The forex market is the largest and most liquid. Coverage includes:
Currency Pairs: Tracking movements in major and emerging market currencies.
Global Trade Impacts: Understanding how exchange rate fluctuations affect trade and investment.
Central Bank Interventions: Monitoring interest rate decisions and monetary policy adjustments.
5. Alternative Investments
Alternative assets such as private equity, hedge funds, and cryptocurrencies are increasingly covered due to their growing influence. Coverage examines:
Market Trends: Adoption rates, liquidity, and performance metrics.
Regulatory Risks: Monitoring government policies and enforcement actions.
Investor Interest: Tracking institutional and retail participation.
Methods and Channels of Financial Market Coverage
Financial market coverage employs multiple methods, tools, and media channels:
1. Traditional Media
Newspapers and Magazines: Financial dailies like The Wall Street Journal and Economic Times provide daily market summaries.
Television Channels: CNBC, Bloomberg TV, and local financial channels offer live analysis and expert interviews.
Radio and Podcasts: Financial talk shows provide commentary and insights for casual investors.
2. Digital Platforms
Financial Websites and Portals: Platforms like Bloomberg, Reuters, and Moneycontrol deliver real-time updates.
Mobile Apps: Trading apps and news apps provide push notifications and analytical tools.
Social Media: Twitter, LinkedIn, and specialized forums allow rapid dissemination and crowd-sourced sentiment.
3. Analytical Tools
Charting Software: Technical analysis relies on historical price charts and pattern recognition.
Financial Models: Fundamental analysis uses valuation models, discounted cash flows, and ratios.
AI and Big Data: Machine learning models analyze vast datasets to predict market trends and detect anomalies.
4. Institutional Reports
Brokerage Reports: Analysts provide in-depth research reports with buy/sell recommendations.
Investment Bank Publications: Macro and sectoral insights influence market perception and trading strategies.
Regulatory Disclosures: Filings such as 10-Ks, 10-Qs, and prospectuses provide authoritative information.
The Role of Financial Journalists and Analysts
Coverage is not just about raw data; interpretation is critical. Financial journalists and analysts bridge this gap:
Journalists: Provide context, highlight market-moving news, and summarize complex events in understandable language.
Analysts: Offer technical insights, forecasts, and actionable recommendations.
Influencers and Educators: Thought leaders shape sentiment and influence retail participation.
A balanced coverage ecosystem combines speed with accuracy, commentary with data, and local insights with global perspective.
Importance of Financial Market Coverage
1. Promotes Transparency
Timely coverage ensures that market participants have access to relevant information, reducing information asymmetry.
2. Enhances Market Efficiency
Markets respond more accurately when participants are informed, contributing to better price discovery.
3. Guides Investment Decisions
Coverage helps investors identify opportunities, manage risk, and adjust strategies in volatile conditions.
4. Supports Policymaking
Regulators and central banks monitor market coverage to gauge sentiment, liquidity conditions, and systemic risks.
5. Educates the Public
Effective reporting demystifies markets for retail investors, empowering financial literacy and participation.
Challenges in Financial Market Coverage
Despite its critical role, coverage faces several challenges:
1. Information Overload
The sheer volume of financial news can overwhelm investors, making it difficult to distinguish signal from noise.
2. Speed vs. Accuracy
In the digital age, the pressure to report first can compromise accuracy.
3. Bias and Conflicts of Interest
Analyst recommendations and media reporting may be influenced by corporate sponsorships or personal interests.
4. Complexity of Modern Markets
Derivatives, algorithmic trading, and decentralized finance (DeFi) make coverage increasingly technical and challenging.
5. Global Interconnectedness
Events in one country can trigger cascading effects worldwide, demanding comprehensive, real-time coverage.
Conclusion
Financial market coverage is far more than a reporting mechanism; it is a critical pillar of modern financial systems. It informs, guides, and protects the interests of investors, institutions, and regulators. In an era of rapid information flow, complex instruments, and interconnected economies, high-quality coverage ensures that markets remain transparent, efficient, and fair.
As technology evolves and markets become more sophisticated, the role of coverage will expand further, blending real-time data, advanced analytics, and global insights. For any market participant, understanding financial market coverage is no longer optional—it is an essential part of navigating the intricate world of finance.

Lululemon: Beaten-Down Athleisure GiantLululemon: Beaten-Down Athleisure Giant Amid #Earnings and #Stocks Trends Crash? $250 Recovery Target in Sight?
Lululemon (LULU) shares tanked 19% today to around $160 after Q2 2025 earnings missed estimates, with revenue at $2.4B (up 7% YoY but below $2.44B expected) and EPS dipping to $2.68 from $2.89 last year, prompting a slashed full-year outlook amid China slowdowns.
This extends a brutal 57% YTD plunge from $420 highs, but with a P/E now at 12x versus historical 30x averages, analysts are calling it a "screaming buy" at 40% below fair value.
Just as #Earnings racks up 8K mentions on X with post-report volatility exploding, and #Stocks trends highlight beaten-down consumer plays (e.g., LULU's RSI at 33 signaling oversold), the stock's premium brand and 15% international growth position it for a viral rebound in the $200B+ athleisure market.
But with guidance cuts, is LULU the undervalued turnaround story ready to warrior-pose back to $250, or will competition erode margins further? Let's unpack the fundamentals, SWOT, charts, and setups for September 17, 2025.
Fundamental Analysis
Lululemon's resilience shines in steady sales despite macro headwinds, with Q2 gross margins holding at 58% and international revenue surging 15%—but US softness and China inventory issues led to the outlook trim to $11.15–$11.3B for FY2025 (up 6–7% YoY from $10.7B).
Analysts forecast 2025 EPS of $14.50 (up 10% YoY), with buy ratings from 25 of 30 firms hiking targets to $250 amid #Earnings fallout creating a value entry. Trading at 40% below DCF fair value, LULU's undervaluation ties into #Stocks hype on oversold retail, but elevated inventory risks could pressure if consumer spending cools.
- **Positive:**
- Brand moat with 20%+ market share in premium yoga; $1.2B FCF TTM funds $6B buybacks, amplified by #Earnings dips as buy signals.
- International expansion (35% of sales) projects 12% CAGR, undervaluing the stock at 12x P/E vs. peers' 25x amid #Stocks rotation.
- Broader trends in wellness and athleisure (e.g., viral TikTok fitness) position LULU for 15% revenue growth rebound.
- **Negative:**
- Guidance cut reflects China woes (sales down 2%), clashing with #Earnings optimism if tariffs hit.
- Inventory pile-up at $1.5B risks markdowns, pressuring margins in a high-inflation environment.
SWOT Analysis
**Strengths:** Iconic brand loyalty and direct-to-consumer model (40% of sales) with 58% margins, amplified by #Earnings oversold bounce potential.
**Weaknesses:** US market saturation and China dependency (20% revenue); recent earnings miss exposes execution risks in #Stocks volatility.
**Opportunities:** Global store openings (50+ planned) tap #business trends; undervalued at 12x P/E amid 10% EPS growth and athleisure boom on social media.
**Threats:** Rivals like Nike/Lululemon eroding share; economic slowdown crimping discretionary spend during viral #Earnings discussions.
Technical Analysis
On the daily chart, LULU shows a sharp V-bottom after the 19% gap-down, bouncing from $155 support in a multi-month downtrend, with volume spiking on post-earnings panic and mirroring #Earnings volatility. The monthly RSI at 33 screams oversold, echoing 2009/2014 bounces. Current price: $160, with VWAP at $165 as intraday pivot.
Key indicators:
- **RSI (14-day):** At 25, deeply oversold—classic bounce setup amid #Stocks surges. 📈
- **MACD:** Histogram flipping positive post-selloff, crossover imminent for reversal. ⚠️
- **Moving Averages:** Price below 21-day EMA ($180) but above 200-day SMA ($220)—death cross avoided.
Support/Resistance: Key support at $155 (today's low), resistance at $170 (50-day SMA) and $200 (Fib retrace). Patterns/Momentum: Oversold hammer candle targets $190; fueled by #Earnings momentum. 🟢 Bullish signals: Volume exhaustion low. 🔴 Bearish risks: Break below $155 eyes $140 on further guidance fears.
Scenarios and Risk Management
- **Bullish Scenario:** Reclaim $170 on retail rotation or soft CPI data targets $200 short-term, then $250 by year-end; buy pullbacks to $155, especially if #Earnings narrative shifts to value.
- **Bearish Scenario:** Drop below $155 eyes $140 (52-week low); watch for inventory news amid #Stocks fade triggering 10% more downside.
- **Neutral/Goldilocks:** Range-bound $155–$170 if data mixed and #Earnings cools, suiting covered calls pre-holidays.
Risk Tips: Use stops at $152. Risk 1-2% per trade. Diversify to avoid correlation traps with #Earnings-linked retail like NKE.
Conclusion/Outlook
Overall, a bullish bias if LULU holds $155, supercharged by today's #Earnings and #Stocks trends, affirming its undervalued status with 50%+ upside on international rebound. But watch Q3 comps and China updates for confirmation—this fits September's value rotation amid beaten-down consumer hype. What’s your take? Warrior pose into LULU dip or sitting out the volatility? Share in the comments!

Goldman Sachs - Too Cheap to Ignore?NYSE:GS and the general financial services sector as a whole has faced extreme trauma over this past month. However, one that particularly stands out is the "bad guy" of the industry who has taken the equivalent to a roundhouse kick to the face, and the chart shows it. But does this mean that someone looking for a dip shouldn't pick up strong equity on a discount? I say no, lets be greedy while other are fearful just like that one guy said. Warren something... I don't really remember his name.
Let's examine the numbers before we do the finance equivalent of astrology. This means that value investing and it's rather elementary techniques are going to give us some sort of indicator of a buy or a sell. Here's what you need to know.
1. Sachs has an attractive dividend yield of 2.14% ($11.50/share) and a gleaming dividend payout ratio (DPR) of 21.50%.
2. It is far from its high annual EPS sitting at 41.21 sliding from its high last December at 60.35.
3. It's price to earnings ratio (PE) is lounging nicely at 14.00 meaning we are at a generally cheap share price. This metric is what we're looking for.
4. Unfortunately, it has a rather higher price to book ratio (PB) at 1.64 which somewhat contradicts the PE ratio examined in #3.
5. Other metrics to keep in mind is an EV/EBITDA at 53.90 and a PEG at 16.23 which are both considered undesirable to investors.
So as far as statistics are concerned, Goldman is sending some mixed signals making a decision difficult at the moment. This means we're going to have to examine the general sector sentiment and general outlook.
Firstly, I'd like to point out Goldman's enterprise value. Sachs' EV is currently reported at 855.93 billion, 673 billion (78.63%) being debt (long term or short). This means NYSE:GS is a debt heavy company and we all know how debt works (the entity taking on the debt owes principal + interest). Well, this means that NYSE:GS is heavily going to be influenced by interest rates even considering their strong revenue. So, if we plan on interest rates being lowered long term (which I'm sure we all do), Goldman will be able to borrow from the Fed at a cheaper interest price while simultaneously owing account holders and bond holders less in interest (or APY yield for that matter). However, in the event that inflation runs wild and the Fed raises rates, NYSE:GS will face some turmoil along with the other commercial investment banks.
Great, so now for the fun part. Let's see what the charts have to say about this and what it could be implying.
Here is the 4H chart looking back into last October.
As you can see, Goldman posted a sweet rally followed by our current pullback. However, we are being flashed with various bullish technical patterns and a strong explanation for the drop (even considering the tariffs threats and indices pullback). In summary, we are examining a stock in gradual freefall towards what appears to be several safety nets.
On a psychological level, I find that most investors in the business of "smart money" wont let Goldman drop too low before they put their boot down. I also imagine this will happen pretty soon, but we need to hold the $540 price level.
As far as the MACD is concerned, we are experiencing weakness from the buyers are the bears are clearly on offense.
And lastly, the GS implied volatility shows that options traders aren't pricing in anything particularly unusual, and the most usual movement for the market is to climb higher so that's good news.
So, what's the conclusion. In my humble opinion, I believe that Goldman Sachs' stock is trading too low to not buy. Financially, the company is not showing anything particularly concerning and may just need to show some strength before the mass cash chases this play. As of right now, I am long on NYSE:GS considering the financial statistics, general industry sentiment, and technical analysis which was used as an assistance tool. This trade could be last anywhere from 1 day to 1 year, but I am prepared to hold for much longer.

Bearish potential detected for SDFEntry conditions:
(i) lower share price for ASX:SDF along with swing of DMI indicator towards bearishness and RSI downwards, and
(ii) observing market reaction around the share price of $5.89 (open of 20th June).
Stop loss for the trade would be:
(i) above the potential prior resistance of $6.08 from the open of 4th December 2024, or
(i) above the potential prior resistance of $6.19 from the open of 3rd July 2024, depending on risk tolerance.

Potential outside week and bullish potential for CNIEntry conditions:
(i) higher share price for ASX:CNI above the level of the potential outside week noted on 4th July (i.e.: above the level of $1.795).
Stop loss for the trade would be:
(i) below the low of the outside week on 30th June (i.e.: below $1.655), should the trade activate.

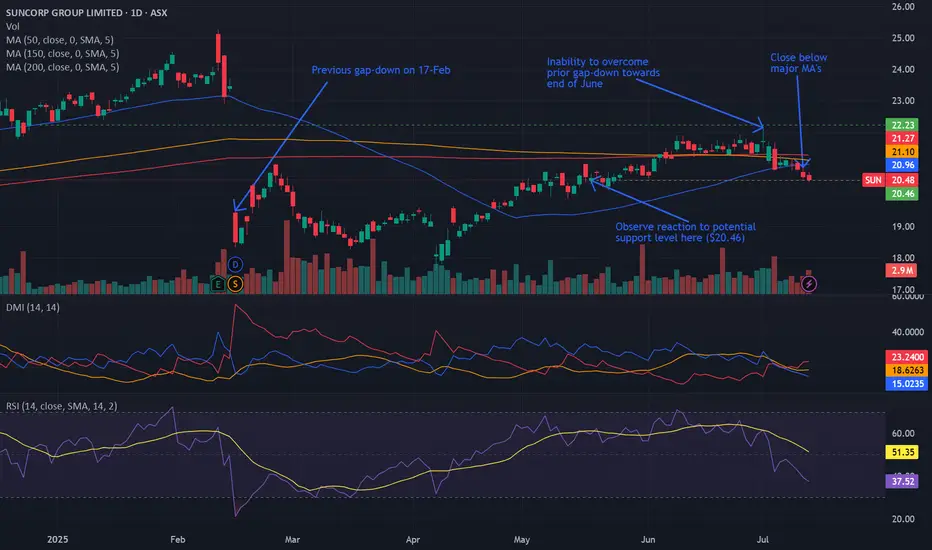
Bearish potential detected for SUNEntry conditions:
(i) lower share price for ASX:SUN along with swing of DMI indicator towards bearishness and RSI downwards, and
(ii) observing market reaction around the share price of $20.46 (open of 19th May).
Stop loss for the trade would be:
(i) above the potential prior resistance of $21.36 from the open of 5th June, or
(i) above the high of the recent swing high once the trade is activated (currently $22.14 from the high of 1st July), depending on risk tolerance.
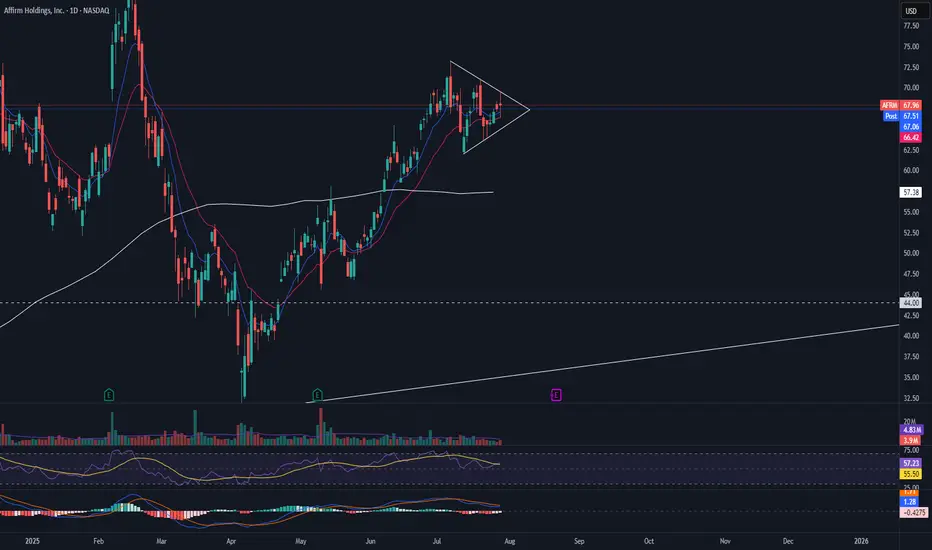
AFRM pre earnings triangleAFRM is currently in a symmetrical triangle with RSI and MACD beginning to show the pattern may come to an end. I would want to see this triangle break with volume before entering a long position.
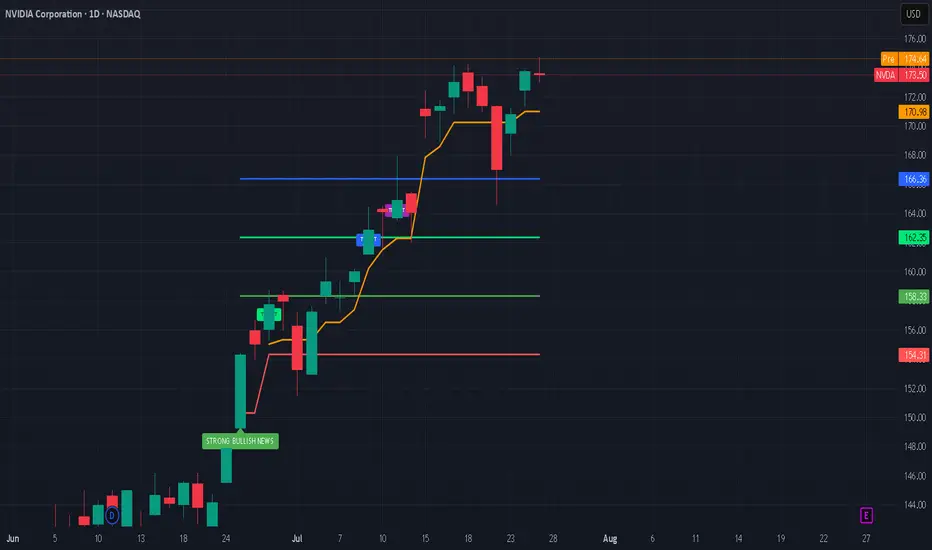
Nvidia’s Historic 2025 Stock Rally: What’s Driving It?Nvidia’s stock has once again captivated Wall Street in 2025, breaking records and fueling debates on whether its blistering momentum will continue or eventually ease. Here’s an in-depth look at why Nvidia is surging, the key drivers behind the rally, and what the long-term future could hold.
Nvidia’s Stock Rally: By the Numbers
As of July 2025, Nvidia stock has rallied more than 39% year-to-date, reaching new all-time highs above $170 and propelling the company’s market cap past $4 trillion, the largest in the world.
The stock has added nearly $2 trillion in valuation since April, outpacing tech giants like Microsoft and Apple.
Analyst price targets for the rest of 2025 vary: the average ranges from ~$174 to ~$235, with bullish forecasts up to $250 and more cautious targets down to $135.
What’s Powering the Rally?
1. Surging AI Demand:
Nvidia remains at the center of the artificial intelligence (AI) boom. Its graphics and AI accelerator chips (notably the new Blackwell AI family) are the backbone of AI infrastructure for Global Tech firms (Amazon, Meta, Microsoft, Google) and cloud service providers. This AI-centric demand has kept revenue growth robust and margins high (approaching 70%).
2. Easing China Trade Fears:
Earlier in 2025, U.S.–China export controls severely restricted Nvidia’s sales of advanced AI chips like the H20 to Chinese customers, causing a temporary selloff. However, a subsequent pause on tariffs by the U.S. and optimism about renewed China shipments reignited investor confidence, helping reverse earlier losses and extending the rally.
3. Massive Tech Investment Cycle:
The global rush to build out AI infrastructure is bringing huge investments from U.S. and international hyperscalers. Meta and Amazon alone have announced plans to pour “hundreds of billions” into AI data centers, much of it destined for Nvidia-powered hardware.
4. Strong Fundamentals and Diversification:
Nvidia sports some of the highest profit margins among mega-cap tech stocks. Its free cash flow, dominant market share, and expanding ecosystem, including platforms like Omniverse (for 3D and digital twins) and Drive (autonomous vehicles)—cement its leadership well beyond just chips.
What Could Slow Nvidia Down?
Despite the excitement, several risks linger:
Valuation Concerns: Nvidia trades at a premium (P/E above 50 for trailing earnings), raising worries of a pullback if growth slows.
Geopolitical and Regulatory Threats: Further U.S.-China tensions, new export regulations, or rising competition from rivals like AMD, Huawei, or custom silicon at cloud giants could erode growth or margins.
Cyclicality of the AI Boom: Some market watchers worry that AI infrastructure spending could prove cyclical, making Nvidia’s revenue growth more volatile in future years.
The Long-Term Outlook (2025 & Beyond)
Bullish Case: Most analysts expect continued dominance for Nvidia as AI, autonomous vehicles, robotics, and edge computing keep growing exponentially. Price targets range as high as $250 for 2025, climbing to $1,000+ by 2030 if AI adoption continues its rapid expansion.
Base Case: Moderate growth continues into 2026–2027, with a price target cluster around $180–$235 (2025) and $200–$428 (2027), assuming AI demand moderates, margins remain stable, and Nvidia fends off competitive threats.
Bearish Case: If U.S.-China relations sour and hyperscaler spending slows, the stock could retest support levels ($135–$150). However, few analysts expect a sustained collapse unless there is a fundamental change in AI or chip technology trends.
#nvda #stockmarket #finance #revenue #profit #financials #economy #technology #ai #chips
Bullish potential detected for BOQEntry conditions:
(i) higher share price for ASX:BOQ along with swing up of indicators such as DMI/RSI.
Depending on risk tolerance, the stop loss for the trade would be:
(i) a close below the 50 day moving average (currently $7.83), or
(ii) below previous swing low of $7.69 from the low of 23rd June, or
(iii) below previous support of $7.60 from the open of 12th May.

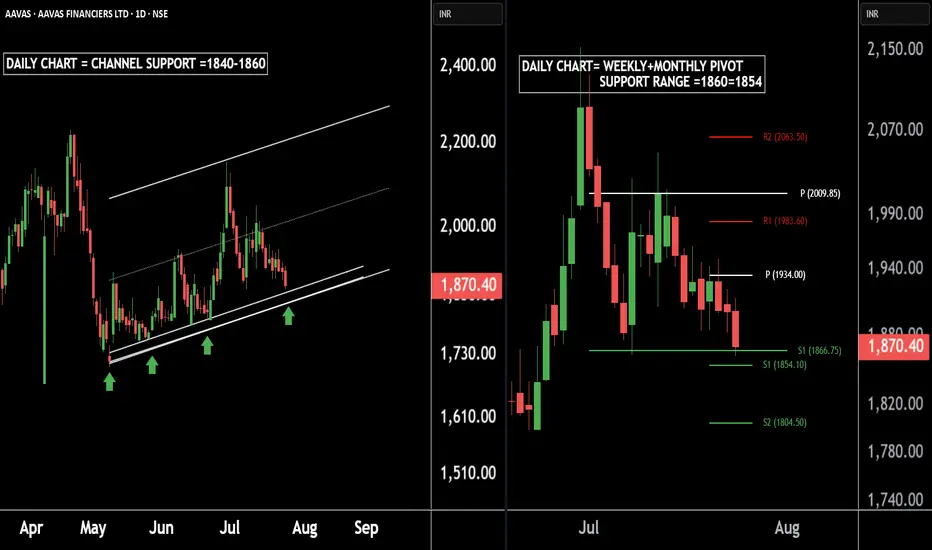
AAVAS Housing – A Hidden Gem for Medium-Term InvestorsThere are two charts of AAVAS FINANCIERS.
On the first chart AAVAS FINANCIERS is moving in a well defined parallel channel with support near at 1840-1860.
On the second chart AAVAS FINANCIERS is taking Weekly + Monthly support near at 1866-1854.
If this level is sustain ,then we may see higher prices in AAVAS FINANCIERS LTD.
Thank You !!
NewtekOne | NEWT | Long at $10.92NewtekOne NASDAQ:NEWT is a financial holding company providing business and financial solutions to small- and medium-sized businesses across the U.S. Services include Newtek Bank, business lending, SBA loans, electronic payment processing, payroll and benefits, insurance, and technology solutions. While the stock has taken a major hit recently, insiders have scooped up over $1 million in shares with an average price of $11.70. Currently trading at a P/E of 5.6x, forward P/E of 6.6x, and near book value, the stock may be poised for a move up soon with the anticipation of interest rates dropping. Revenue is up 24.93% from $271.15M (2023) to $338.73M (2024) and earnings are forecast to grow 11.63% per year, but the company does have a high debt-to-equity ratio (over 5x).
Tariffs could indirectly impact NASDAQ:NEWT by increasing costs for its small- and medium-sized business clients, particularly in industries reliant on imports (e.g., manufacturing, retail). Higher costs may reduce client profitability, increasing loan default risks or reducing demand for Newtek’s lending and payment processing services. But an interest rate reversal may greatly limit the impact (longer-term).
So, at $10.92, NASDAQ:NEWT is in a personal buy zone.
Targets into 2027:
$12.00 (+9.9%)
$14.00 (+28.2%)

Last week Bitcoin created massive liquidity at a key resistance!🚨 Bitcoin Update – A Bullish Storm Is Brewing? 💥
Last week, Bitcoin created massive liquidity at a key resistance zone, and guess what? That liquidity is still untouched. The market hasn’t fully tapped into it yet — and that’s a big deal.
Recently, BTC smashed through resistance and even left behind a Bullish Fair Value Gap (FVG), signaling strength. But hold on—after this breakout, the market is showing signs of a minor pullback, likely to retest its marked IRL (Important Reaction Level).
📉 It’s cooling off temporarily... but don’t blink. This zone could act as a springboard for the next big leg up.
💡 Here’s the kicker: there’s still a ton of liquidity waiting above. If the market wants it—and it usually does—there’s a high probability (80%+) of another bullish push.
👀 Watch this area closely. It’s a make-or-break zone.
📊 Do Your Own Research (DYOR) – this is not financial advice, just a friendly nudge from the charts.

COINBASE and it's massive inverse head and shoulders...observed in Coinbase chart formation indicates it has potential to become a trillion-dollar enterprise!
With a Logarithmic projection heading towards $4000 per shares.
#COIN has a market cap off $66 Billion right now
It has as just entered the SP 500
Is in the process of receiving a Banking Licence
And is the main custodian for all the major #crypto ETF's
Those are the drivers why this is likely to be a four figure stock in the coming years.
