CADJPY Longthis pair has been in an uptrend for the past couple of weeks and it has been breaking higher highs on the smaller timeframe
Flag

GBPCHF: Bulls Are Back 🇬🇧🇨🇭
GBPCHF finally looks bullish after a deep retest
of a recently broken daily structure.
A breakout of a resistance line of a falling channel/flag
on an hourly time frame leaves strong bullish clues.
We can expect a rise at least to 1.0654
❤️Please, support my work with like, thank you!❤️
I am part of Trade Nation's Influencer program and receive a monthly fee for using their TradingView charts in my analysis.

Hyperliquid: bull flag in play? key levels to watch aheadHyperliquid. Who’s riding this new perp beast or just watching from the sidelines? According to market chatter, the recent token launch plus growing derivatives volume keeps Hyperliquid in the spotlight, and today’s headlines about rising on-chain activity only added fuel to the narrative.
On the 4H chart we’ve got a classic post-pump chill phase: sharp vertical move, then a sideways pullback between roughly 31 and 35 that looks like a bull flag. Volume on the run-up was heavy and is now fading while RSI cooled from overbought back to the 50–60 zone - a healthy reset instead of a trend break. I’m leaning long, expecting liquidity grabs toward 32-31 and then a push through 34 with eyes on 36-38.
My plan: ✅ base case is that 31 holds as key support and price grinds higher toward 36 first, 38 if momentum returns. ⚠️ If we start closing 4H candles below 31 and especially under 29.7, I’ll treat it as a local top and look for deeper buys down in the lower green zones. I might be wrong, but I’d rather wait for the dip than FOMO into the last green candle at the highs.

Top 3 Forex Gold Setups I Will Be Trading in 2026
Among the different strategies and signals that I relied on in 2025, there were 3 exceptional setups that showed the highest accuracy and profitability.
In this article, I will explain the structure and price model of these setups and equip you with the best entry signals for trading in 2026.
Discover what worked best in Forex and Gold trading in 2025.
The first powerful setup that showed great results last year is based on an old-school price action chart pattern - double top & bottom .
But don't trade each double top & bottom that you spot.
To achieve the highest win rate, these patterns should form on specific time frames and on specific price levels.
Please, study a bullish model:
The price should test a key daily support level.
After that, a double bottom pattern should form on 1H time frame.
Your signal to buy will be a breakout and an hourly candle close above its neckline.
Set your buy limit order on a retest of that,
stop loss will lie below the bottoms,
take profit will be the closest intraday resistance.
Here is an example:
Now, examine a bearish model.
The price should test a key daily resistance level.
After that, a double top pattern should form on 1H time frame.
Your signal to sell will be a breakout and an hourly candle close below its neckline.
Set your sell limit order on a retest of that,
stop loss will lie above the bottoms,
take profit will be the closest intraday support.
Here is an example on NZDUSD forex pair:
Meeting all the required criteria, this setup achieved 76% accuracy in 2025.
The second setup that had a high win rate last year is from Smart Money Concepts trading.
It is based on a combination of liquidity zones, traps, and imbalances.
Please, examine a bullish model of that setup.
We need a t est of a daily liquidity demand zone and a bearish trap below that.
After a trap, a bullish imbalance should occur on an hourly time frame.
I suggest looking for a bullish engulfing candle and return of the price within or even above a liquidity zone with a close of that candle.
Buy the market immediately after a candle close.
Set your stop loss below the low of the trap.
Your take profit will be the closest intraday supply zone.
Please, study an example on EURAUD:
Now, study a bearish model.
We need a test of a daily liquidity supply zone and a bullish trap above that.
After a trap, a bearish imbalance should occur on an hourly time frame.
I recommend looking for a b earish engulfing candle and return of the price within or even below a liquidity zone with a close of that candle.
Sell the market immediately after a candle close.
Set your stop loss above the high of the trap.
Your take profit will be the closest intraday demand zone.
Please, check the example:
Meeting all the conditions, this setup showed 79% accuracy.
The last setup worked phenomenally well in Gold trading last year.
Because of a crazy bullish rally that the market started straight from the beginning of 2025, this simple pattern provided huge gains.
I am talking about a bullish flag pattern.
Please, note that the first 2 setups were bullish and bearish.
In a current case, we are considering only a bullish flag.
Make sure that the market is bullish .
After an update of a new high and a formation of a new higher high higher close, expect a correctional movement on a 4H time frame.
The price should start falling , forming an expanding, parallel or contracting channel - a bullish flag.
Your strong signal to buy will be a bullish breakout and a 4H candle close above a resistance of the flag and the last lower high within that.
Set your buy limit order on a retest of the broken level of the last LH,
Set stop loss below the lows of the flag,
Your take profit will be the closest psychological level above a current high.
Alternatively, you can trade this model without take profit and apply trailing stop loss.
That's the example of this price model:
This pattern achieved 69% accuracy.
But because of a strong bullish momentum, each profitable signal produced enormous gains.
If Gold continues rallying next year, and I think it definitely will, keep an eye on bullish flags as your signal to buy.
Using these 3 setups, you can successfully trade Forex and Gold in 2026.
Integrate them in your trading strategy, learn to recognize them and follow the rules that I provided.
Let these setups bring you huge gains this year.
❤️Please, support my work with like, thank you!❤️
I am part of Trade Nation's Influencer program and receive a monthly fee for using their TradingView charts in my analysis.

Is everyone too bearish on BTC? Up to $108k before down?Everyone is extremely bearish on BTC here calling for new lows, but the chart and indicators don't look like they support a move straight down.
Even though we're technically consolidating in a bear flag, I don't think we actually break to the downside (yet).
To me, it looks like we should see a large bounce first up to the $103k-108k range, then I think a larger downside move can play out down to the lower support levels.
The reason why I don't think we see a move straight down is because we're so oversold on high timeframes (weekly) and we're still above key support levels. It makes more sense to me to see a fake out move up that makes everyone bullish again before we see the large move down.
As long as we remain above that $86.1k support level, then I think this is a strong possibility of an outcome.
Let's see if we can hold that level and how it plays out.

ABOT , Bullish BiasWeekly Cup & Handle and daily Bullish Flag structures remain intact. Entries may be considered near 1,178 or on breakout above 1,310, with upside potential toward 1,450–1,800 if momentum sustains.
This analysis is based on technical structure only. Prices are subject to market risk. Manage risk accordingly and use proper position sizing.

Bitcoin Holds Heavy Support — Bullish Flag Signals Next ImpulseAs I expected in my previous idea , Bitcoin( BINANCE:BTCUSDT ) reached its targets and rose as anticipated.
Currently, Bitcoin is moving within the heavy support zone($78,260-$70,080).
From a classical technical analysis standpoint, on the 15-minute timeframe, Bitcoin seems to be forming a bullish flag pattern, which is a good sign for continued short-term upside.
From an Elliott Wave perspective, it appears Bitcoin is completing a Double Three Correction(WXY) on the 15-minute timeframe. We should expect the start of a 5-wave impulsive move next.
I expect Bitcoin to continue upward in the next few hours, at least toward the Cumulative Short Liquidation Leverage($80,100-$79,450) and possibly fill parts of the upper CME Gap($84,560-$79,660).
What’s your view on Bitcoin’s direction, at least for the next couple of days? I’d love to hear your thoughts!
First Target: Cumulative Short Liquidation Leverage($80,100-$79,450)
Second Target: $80,971
Stop Loss(SL): $76,281
Points may shift as the market evolves
Cumulative Short Liquidation Leverage: $86,170-$84,760
Cumulative Long Liquidation Leverage: $77,460-$76,600
Cumulative Long Liquidation Leverage: $75,000-$74,000
💡 Please respect each other's opinions and express agreement or disagreement politely.
📌Bitcoin Analysis (BTCUSDT), 15-minute time frame.
🛑 Always set a Stop Loss(SL) for every position you open.
✅ This is just my idea; I’d love to see your thoughts too!
🔥 If you find it helpful, please BOOST this post and share it with your friends.

ADX and DFM are Still at the Top of their Channels
Today, the market in both DFM and ADX hit the top of their ascending channels. A rejection was even seen in DFM. Although anything can happen tomorrow, I am still uncomfortable buying anything right now, knowing that there is a high probability of a reversal ahead.

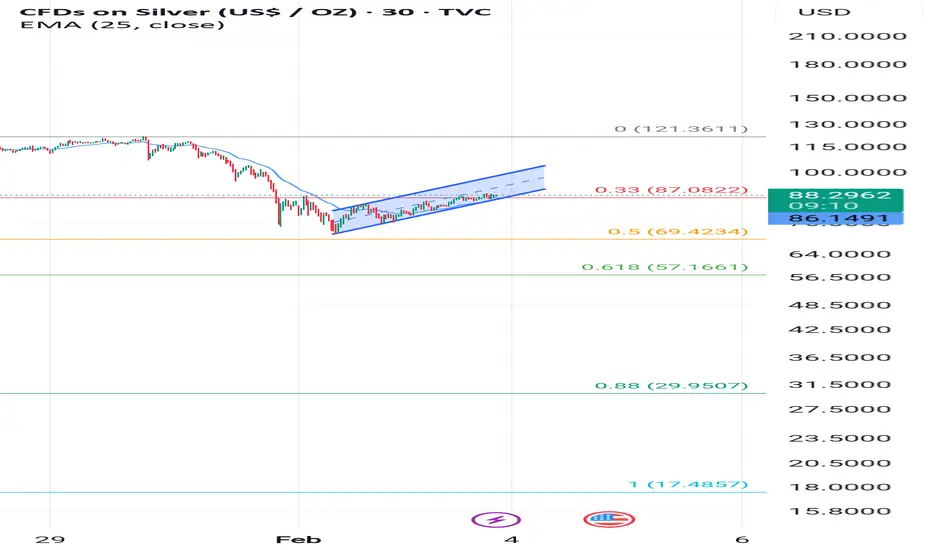
Inverse flag pattern In SILVER IT is a bearish structure, traders who are long must put strict stop loss.
Bears could take the position after the channal break down.
Which could bring the price to 62 dollars.
continuation forming on GBPUSDFX:GBPUSD if price gives so much clarity like so, I would be more than happy to take the sells. If you have any questions please do well to ask

Bullish Flag!CVX Analysis (Nasdaq)
CMP 175.26 (02-02-2026)
Bullish Flag pattern on bigger tf.
Crossing & Sustaining 188 - 190 may lead it
towards 250 & then 280+
Breaking 144 may bring more selling pressure.

USD/CHF Reversal Faces First Key TestUSD/CHF traded above 0.7800 today, reflecting a stronger U.S. dollar after news that the U.S. Federal Reserve’s leadership transition may lean toward a more disciplined policy path. That dynamic has bolstered broad dollar demand across global markets and supported pairs like USD/CHF even as precious metal sell-offs and safe-haven flows complicate sentiment. On the U.S. side, markets are also parsing domestic data releases that underscore a resilient labor market and price pressures ahead of key releases later this week, feeding into dollar strength.
In Switzerland, the Franc continues to attract interest as a haven and in response to ongoing economic narratives around inflation near the lower bound and the Swiss National Bank’s cautious stance. With limited fresh Swiss domestic data today, USD/CHF is primarily reacting to external drivers, balancing U.S. monetary outlook against persistent franc support.
In the above chart, USD/CHF rates have quickly reversed from their lowest levels since 2011, but it’s too soon to say that a low is in place. The aggressive downtrend in place from the 2025 high remains, with the series of lower highs and lower lows intact. Traders may initially see a rebound in USD/CHF as a selling opportunity following the bearish breakout in January. Before USD/CHF can even think about breaking the bearish fever, it first must contend with the area around 0.7829/77, the zone with which the pair found support from July 2025 through January 2026. A break above this area would suggest that the bear flag has failed, and a test of the 52-week long downtrend is due.

GBPJPY short ideaThe bullish trend channel has been broken, and key dow level have also been broken, indicating a change of character. After this, a very clean pattern forms that typically breaks to the downside. You can take a risky entry at the top of the pattern, but a safer approach is to wait for the confirmed break of the pattern before entering.
There is no take profit. If price reaches the very bottom of the pattern you put break even.

S&P 500 beaar It not a good signalCould be a red monday's comming
downtrend break out.
I hope it will cooling down tonight and going up tmr

ETHUSD - 6Month Chart 6Month chart shows a clear picture of a sharp upward movement with a bullflag presenting itself suggesting further bull movement is coming on this timeframe
Very bullish

Bitcoin - Must see, bear flag target 42k in 2026!Bitcoin is forming a huge bearish flag on the daily/weekly chart! This is an extremely good pattern for all bears around, but for the bulls, it's indeed not that good because the classic profit target of this pattern is 42k (by classical technical analysis of a bear flag pattern). How to measure the profit target? I did it for you on the chart, but you take the flagpole, copy it, and move it to the breakout point of the flag. But of course we are not going to go down in a straight line!
There is a minor support of 71k that can temporarily hold the price, so if you want to trade, really take profit after a few days. 42k is the main target of this bear flag, and I expect that bitcoin can reach this level at around September to October 2026. This should be the ultimate bottom for Bitcoin, so if you want to buy very cheap Bitcoin, this is pretty much your chance. But for now we are waiting for Bitcoin to hit this level.
In order to understand why in September or October, please take a look at my previous important analysis:
What about price action in the short term? Bitcoin can go up in the short term because there is some interesting price action on the 1h chart, but this is really not the point of this analysis. This is an analysis on the daily chart, and in this timeframe, I am of course bearish. But in the short term, Bitcoin can test levels of 91k - 93k before dropping down!
Write a comment with your altcoin + hit the like button, and I will make an analysis for you in response. Trading is not hard if you have a good coach! I am very transparent with my trades. Thank you, and I wish you successful trades!


Bear Flag Breakout Could Bust Down BitcoinBITSTAMP:BTCUSD could continue to fall even further after the Breakout and Retest of the Ascending Channel turned Bear Flag!
Since Price made a Breakout of the Ascending Channel last Tuesday, January 20th, BITSTAMP:BTCUSD struggled to get back within the channel and consolidated between $87,000 - $90,000.
Wednesday, January 28th, price made one last attempt to push higher and was rejected @ $90,476 and since then has been in a steep decline!
Now based on the Breakout of the Bear Flag, we can expect that price will extend as long as the Flagpole of the pattern and this extension could see price make a fall all the way down to the $50,000 - $45,000 area!!
This fall also comes after the Senate Agriculture Committee advanced the CLARITY Act for digital asset regulation. The act defines digital commodities and gives the CFTC primary authority over them while the SEC retains authority over digital asset securities.
-https://www.tradingview.com/news/tradingview:9dac026eb6ea9:0-key-facts-bitcoin-drops-6-to-83-563-356m-in-liquidations-recorded/

Bearish Divergence Playing Well!KSE100 Closed at 182338.12 (29-01-2026)
Bearish Divergence played well. Also there is Bearish Divergence in volumes.
Immediate Support seems around 179500 - 181000
Weekly Closing above blue trendline may bring some positivity in upcoming week.
Index still has the potential to touch 195,000 - 200,000 & then 210,000 but only
if it Crosses & Sustains 190000 -191500 with Good Volumes.

NZDCHF: Confirmed Bullish CHoCH 🇳🇿🇨🇭
NZDCHF completed a correctional movement and started
a new bullish wave on a 4H time frame.
A confirmed change of character indicates a highly probable growth.
Goal - 0.4676
❤️Please, support my work with like, thank you!❤️
I am part of Trade Nation's Influencer program and receive a monthly fee for using their TradingView charts in my analysis.

Bull Flag / Rectangle Continuation Pattern🔥 Bull Flag (High-tight Consolidation), Target = ~15–16%
So projected target ≈ ₹1,150–1,160
Very clean.

SUNRUN - Bullish .. Flag BreakoutSunrun --- 28-Jan-2026: CMP: 20.87..
Can enter now.50% chances of correction occurring... however can take risk....
entry price - 20.87...
target-- 27.59 (33% upside)..
stop loss --15.16
