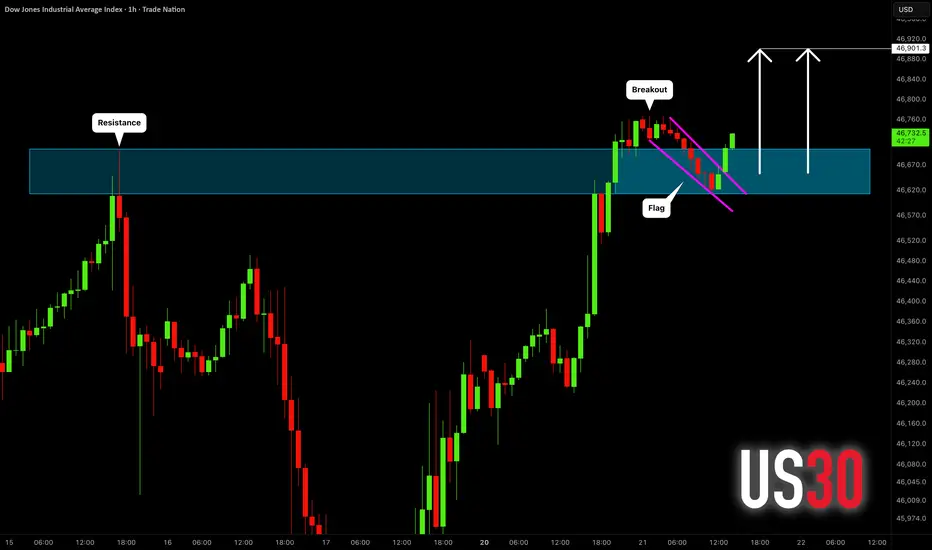
DOW JONES INDEX (US30): Bullish Continuation Confirmed
US30 index violated a major horizontal resistance yesterday.
The price started a correctional movement then, steadily
falling within a bullish flag pattern.
A breakout of its resistance line is a strong bullish signal.
Odds will be high, the index will hit 46900 level soon.
❤️Please, support my work with like, thank you!❤️
I am part of Trade Nation's Influencer program and receive a monthly fee for using their TradingView charts in my analysis.
Flag
NZDUSD: Time to Fall! 🇳🇿🇺🇸
NZDUSD may drop lower significantly, following a confirmed breakout
of a support line of a symmetrical triangle pattern.
With a high probability, the price will reach 0.569 level soon.
❤️Please, support my work with like, thank you!❤️
I am part of Trade Nation's Influencer program and receive a monthly fee for using their TradingView charts in my analysis.

ETHUSD Forming Bull Flag, Targeting $4,981 on BreakoutETH is forming a bull flag i.e. the uptrend is likely to resume
Execution
Wait for the breakout, enter if price decisively breaks above the upper flag trendline around $4,150. Avoid buying inside the flag
Take Profit
The pattern projects a target near $4,981
This is calculated by measuring the ~$800 "flagpole" rally and adding it to the breakout
Risk Mitigation
Place a stop loss just below $4,100 If price falls into the flag, the trade is invalidated

AMD clearing a daily tight flag right after a weekly C&HAfter Clearing a Weekly Cup with Handle, AMD is now clearing a tight flag on the daily chart.
Key points at the time of writing.
✣ New bull market cycle running since June 2025
✣ Market Direction is Up 90%
✣ Stock Fundamentals are good with multi-month growth except in December 2024
✣ Recent Open AI deal acted as catalyst to clear recent Cup with Handle base.
✣ Strong Institutional Interest with 2091 Buyers vs 1451 sellers TTM and a ownership of 71%
✣ Stock recently reset it's base count.
✣ TTM Performance is 53%
✣ Earnings due in 2 weeks !
If this tight flag is broken to the upside, it could be a buy opportunity and a confirmation to a more important upside move.


XAUUSD📊 XAUUSD (GOLD) – 1H Timeframe Analysis
Structure Update:
A clear Double Top has formed near the recent highs, signaling potential exhaustion after 9 weeks of continuous bullish momentum.
Price is now consolidating within a Bearish Flag, suggesting a pause before possible continuation to the downside.
📉 Outlook:
Correction looks imminent as buying momentum weakens and sellers begin to show presence near resistance.
Watch for a bearish candle confirmation and breakdown below the flag’s lower boundary to validate a short setup.
🎯 Trading Plan:
Bias: Bearish (short-term correction)
Trigger: Breakdown and close below flag support
Risk–Reward: Follow proper RR discipline
Invalidation: Break and close above flag resistance or double-top high

Breaking Down my Strategy for YM Trade46,700 to 45,700 is my prediction this week. I'm breaking down my thought process for journaling purposes.

my setupthe all chart indicator
with 1d 200 sma support
with fibo extension
with stochastics
all the way up

BTC last flight????BTC 4H divergence at volumes & RSI, didn't respect the AB=CD and retraced and touched fib lvl 0.382. At 5M broke its resistance lvl of 107951.29.
Wait for first HH at 1H for entry and SL at 102681.30.
5M at CMP with SL at 105860.

GOLD up & awayGOLD retraced perfectly at fib lvl 0.382 at 4H TF and started its upward flight. Bullish flag is at 4H which is good sign for our target. Entry could be at pole of flag and SL at start of pole, though
Dow theory is being played at 5M TF making it 1st HH, so tight SL can be placed at LL for the ride of 4H flag.
Already in trade at 4244.336 with SL at 4164.260 which was triggered at 0.382 fib lvl.

EBAY | This Retail Business Will BOOM | LONGeBay, Inc. is a commerce company, whose platforms include an online marketplace and its localized counterparts, including off-platform businesses in South Korea, Japan, and Turkey, as well as eBay's suite of mobile apps. It offers a platform for various product categories, including parts and accessories, collectibles, fashion, electronics, and home & garden. eBay generates revenue mainly through fees from sales, payment processing, and advertising. The company was founded by Pierre Morad Omidyar in September 1995 and is headquartered in San Jose, CA.

GOLD Bullrun and New ATHsI do not know whether the top is in yet or not because I have now learned to trade what I see.
And what I am currently seeing is a newly created and retested demand zone, which will highly likely result in another bullish impulse and new ATHs and this is another 2 or even 3 RR setup.

Got The GUTS For Stocks? Fractyl Health, Inc. Prints A Bull FlagNASDAQ:GUTS has printed a Bull Flag and with Price making a Retracement to the 50% Fibonacci Level @ $1.28, the Consolidation Phase of Price should be coming to and end!
This could mean its time to Buy Stock in Fractyl Health, Inc!
Once able to Breakout of the Descending Channel of the Flag, Price on Fractyl could keep pushing up!!
Currently the Analyst 1 Yr Price Target is set for $6.76, almost a 400% gain!
The company is also making great strides in weight loss study's and obesity gene therapy!

EUR/USD | Dovish Fed Repricing Lifts Euro Above SupportThe euro has found renewed demand as markets price a softer Fed stance, pushing the dollar broadly lower across majors.
Technical Lens:
EUR/USD has broken out of its descending channel and is now basing above the 1.1600–1.1620 support zone. RSI momentum is tilting higher, hinting at a potential continuation phase.
Scenarios:
If 1.1600 holds → room for follow-through toward 1.1750.
If 1.1600 breaks → a deeper pullback toward 1.1500 can’t be ruled out.
Catalysts:
Upcoming U.S. data and Fedspeak could confirm or challenge the market’s dovish repricing narrative.
Takeaway:
1.1600–1.1620 remains the key pivot for near-term direction.

NZDJPYshort position , price is continuing with the Yen strength
price formed a continuation pattern .

GOLD Another Day, Another Bull Flag and Yet Another ATHGold is bullish. That is really all there is to it.
Every pullback in this market presents an opportunity to scale and establish new long positions.
Let's keep riding the trend.

AUDJPY short This pair has had downward momentum since 4am this morning.
It is now creating a continuation pattern
A bearish flag

GBPJPYThe GBPJPY bearish setup played out perfectly (refer to my previous post). After a brief consolidation phase that initially targeted upside liquidity, renewed bearish momentum provided solid re-entry opportunities.
I’ll continue to look for short positions on lower-timeframe structures and bearish liquidity sweeps on the higher timeframes until the daily gap below is fully mitigated — or unless bullish price action begins to develop.
#Pipmultiplier #GBPJPY #TechnicalAnalysis #Forex #TradingView

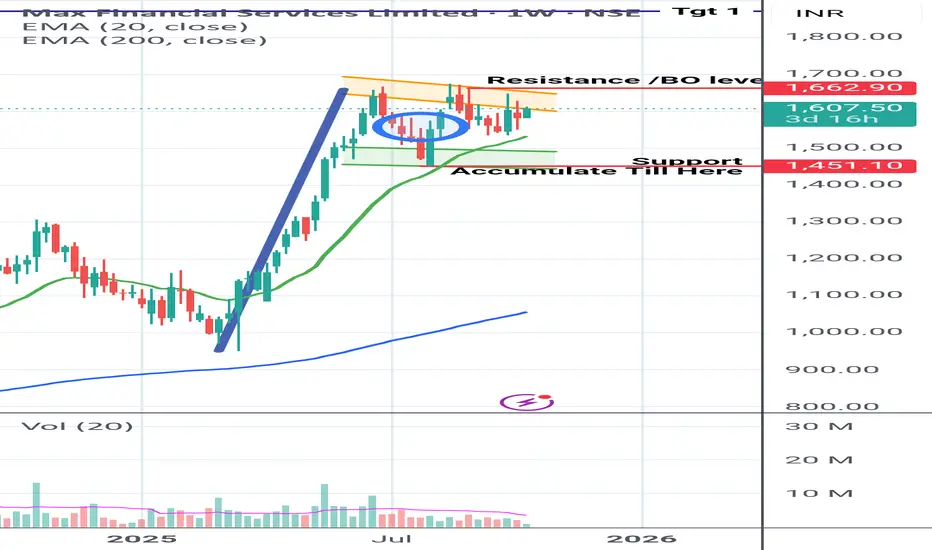
Max Financial going to serve Big# Fresh Pick
Date 13/10/25
MAX FINANCIAL SERVICE
Pattern Observed : Bullish Flag Pattern formation 🐮🇮🇳. Near Breakout stage.
On Confirmation of the breakout, we can see a good rally.
Targets/ Breakout /Support are marked in Chart.
Shared it for Reference purpose based on chart pattern.
Is Ethereum about to correct to 700 dollars?There is growing evidence for it. On the above 10-day log growth chart price action has been riding the ‘mean’ log growth line for a little over 1 year now. Throughout this whole time price action trades within an ascending channel, a bear flag. Within this bearish channel a smaller bear flag is printing.
A measured move on the smaller bear-flag confirmation would see a 40% correction in price action.
A measured move on the larger bear-flag confirmation would see a 60% correction in price action, <700 dollars. This is a fascinating level for two reasons:
1) It would be a correction to the golden ratio as was with the 2019 correction.
2) It would be a correction to the lower log growth curve, which is expected before the next bull run FOR Ethereum.
Lastly there is the Ethereum/Bitcoin chart. Two significant events:
1) The GRM (Golden Ratio Multiplier) has now failed as support (green line), a bull market requires support.
2) Price action has exited a large bear-flag.
Is it possible price action keeps rising? Sure. A convincing break of 2300-2400 would void this outlook.
Is it probable price action keeps rising? No.
For the bulls, price action must break above 2300-2400 and hold it for a 2-3 weeks.
For the bears, a correction to 1750 and under is a green light.
It is not all bad news. Would you like to Time-warp back to January 2016 and buy Ethereum for $2? It is possible and no one is talking about it. Will say elsewhere.
Ww
Weekly ETH/BTC pair.
2-week ETH/BTC large bear flag confirmation

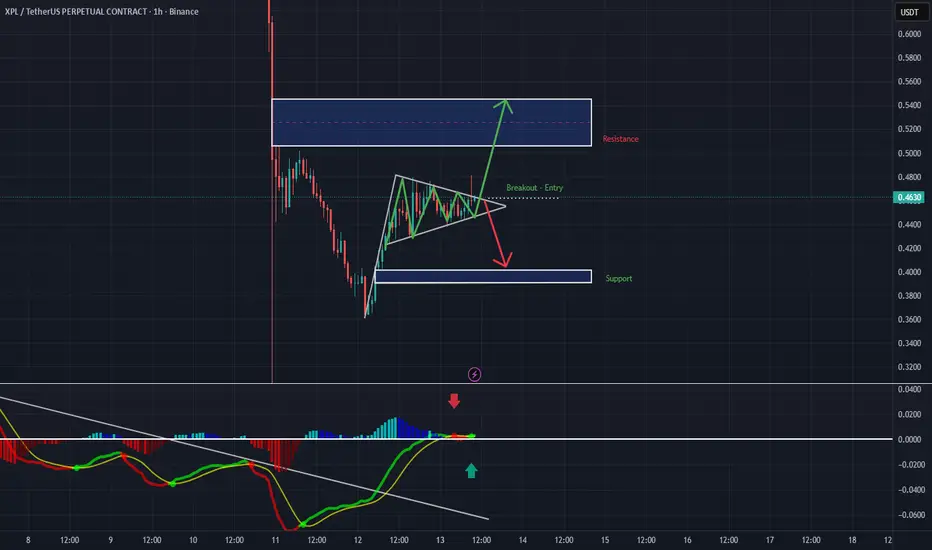
$XPL | 1H ChartPrice is consolidating in a symmetrical triangle after a strong drop volatility is loading.
Currently sitting at the breakout zone.
A decisive move is coming soon 👀
✅ Bullish scenario: Break and close above → target resistance zone $0.50+
❌ Bearish scenario: Rejection → revisit support near $0.40
Momentum indicator showing early signs of a potential reversal.
Let’s see which side wins the breakout ⚔️
#XPL #Crypto #TradingView #PriceAction #Breakout
BTC Bear Flag10/11/25 15minBTC just dropped significantly and is now in a channel on the 15 minute chart.

Bearish BTC AnalysisClearly there is liquidity sweep then falling down, that is a strong signal on the 4H TF.
Secondly, Trading in the premium zone -on the weekly chart- and that is a strong sell signal.
Third, there is no correction/retesting/retracement on the HTF since a week.
Fourth, there is big down movement with engulfing candle on the HTF.
Fifth, there is a big continuing signal with the bearish flag downward on the 1H
I anticipate this is a sell signal.
