AUDCAD short Looks like AUD weakness all across the board is coming into play.
A ITA CURRENTLY IN A DOWN TREND
it is creating a continuation pattern which is a chance to enter the downtrend
Flag

NZDUSD longthis pair has the potential to go long.
at 3am news came out weakening NZD, its spent the entire day retracing back up.
off the back of weak dollar.
price bounced at the bottom and now forming a continuation pattern.
looking to take this trade to the next high.

GBPUSD short continuing the momentum downwards.
price created a double top reversal pattern.
on the selloff
price may reject at the level stated, but also if it breaks that flag we could go all the way down to the next level.

USDCHF continuing the upward trend.
price had a strong impulse move yesterday.
correction move and now waiting on the breakout to the upside to continue the upward momentum.
also bullish flag forming.
waiting for the breakout

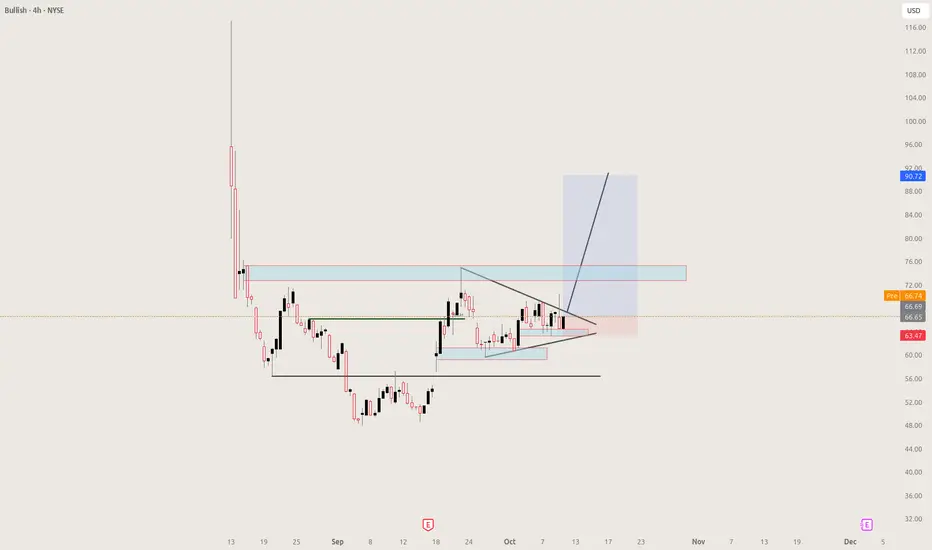
Bullish Triangle BLSH Exchange🎯 Technical Setup:
2+ month post-IPO descending triangle at APEX
Strong $60.00-62.00 support tested multiple times
Volume drying up = coiling for EXPLOSIVE breakout
Target: $92.00-100.00+ (50-70% gain minimum)
🚀 Fundamental GOLDMINE:
Regulatory Powerhouse: Fresh NYSE listing with BitLicense unlocking U.S. spot trading in 20 states
Trump Catalyst: Stablecoin law signed July 2025 supercharged crypto legitimacy, boosting regulated players 30%+
Global Expansion: MiCA license in Germany passports services across EU for institutional floodgates
Proven Volume: $1.5T+ cumulative trading since 2021, top-10 BTC/ETH exchange
💰 The Arbitrage Opportunity:
Currently valued like volatile crypto startup (8-10x EV/EBITDA)
Should be valued like compliant fintech leader (18-22x EV/EBITDA)
Potential revaluation: 150-250%!
🎪 Why This Could Be HUGE:
Industry Trend: 40% of crypto exchanges pivoting to full regulation by 2027
Institutional Wave: BlackRock & ARK poured $200M+ at IPO—more TradFi inflows imminent
First-Mover: Bullish among pioneers with tier-1 licenses in U.S., HK, Germany, Gibraltar
Backed by Legends: Peter Thiel's Founders Fund & Block.one treasury fuel aggressive growth
My Targets:
Phase 1: $80.00 (technical measured move)
Phase 2: $92-100 (regulatory revaluation begins)
Phase 3: $120+ (full institutional adoption recognized)
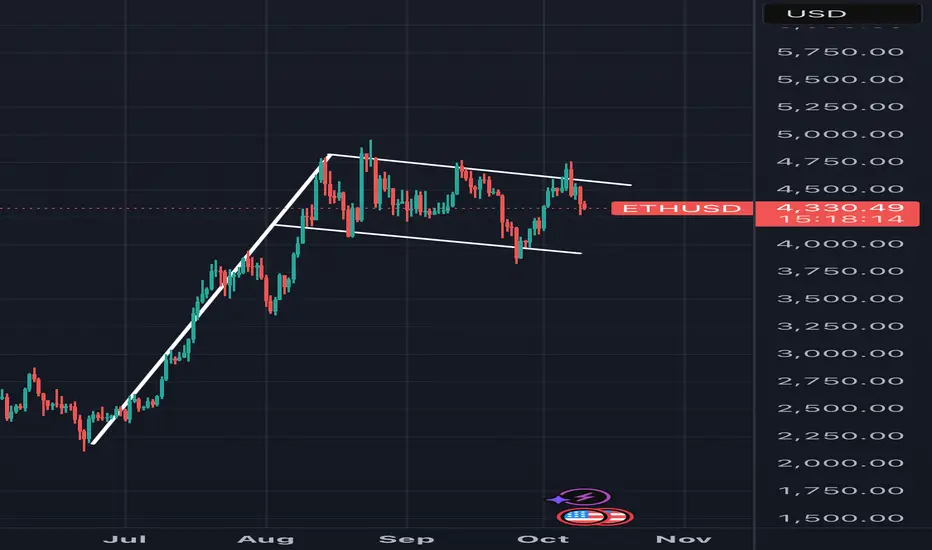
Bull flag on 1D chartThis might indicate the start of a bigger bull run for ETHUSD. Which would signal the start of the actual ALT season!
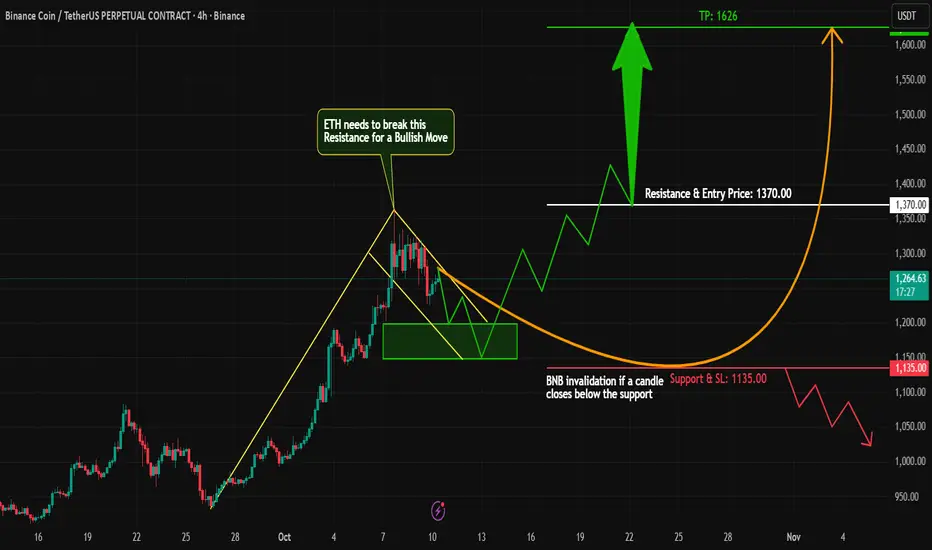
BNB Bullish Flag Formation | Next Move Towards New ATH?#BNB is showing strong bullish momentum — it’s moving in a perfect uptrend with healthy volume supporting the move.
Currently, #BNB is forming a Bullish Flag Pattern on the 4H timeframe, which often signals a continuation of the uptrend after a short consolidation.
Trade Plan:
Wait for a clean breakout above the flag structure.
On breakout confirmation, take a long position with proper risk management.
The breakout could lead us toward a new ATH (All-Time High) if momentum continues.
Key Notes:
Volume confirmation is crucial for a valid breakout.
Watch for fakeouts near resistance levels.
What’s your view on #BNB? Do you think it can reach a new ATH soon?
Let’s discuss!
#BNB #BNBUSD #Crypto #BullishFlag #TradingView #CryptoTrading #Binance #BNBAnalysis #Altcoins #PriceAction #Breakout #TechnicalAnalysis #CryptoBullRun
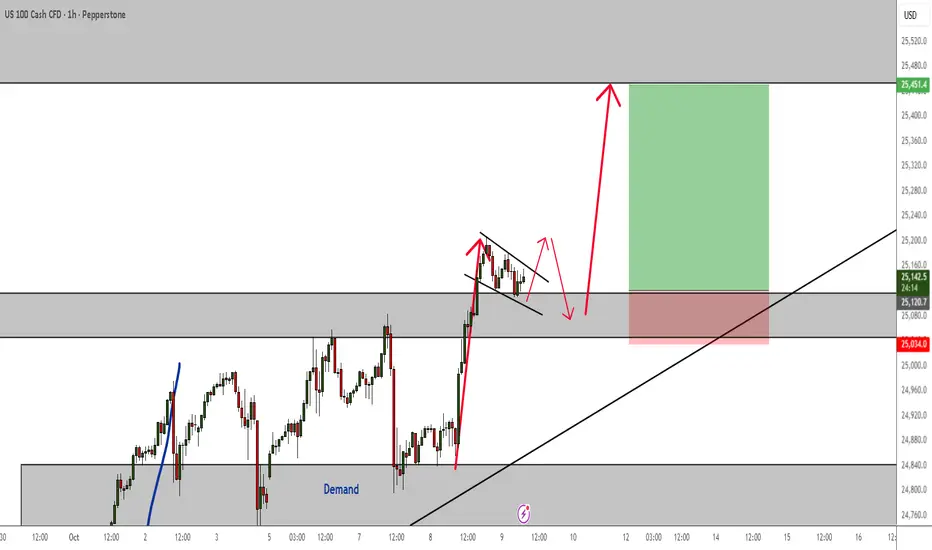
NASDAQ Bullish Continuation PatternsNAS100 is still pushing to the upside.
Currently on the H1 TF I am spotting a bullish flag. Confirmation to enter is on a breakout and a retest. Now, the thing about indices is that they love a nice false breakout, so expect the unexpected. Hence, the arrow points to the downside after the breakout and possibly retesting a support zone before we get a final bullish momentum.
Patience will pay you in this market.
The trend is still your friend.
USDJPY 4H – Reaching Psychological Correction Zone FX:USDJPY
Structure | Trend | Key Reaction Zones
Market surged with a parabolic bullish leg, now testing a major correction area (152.900–153.000).
Gap previously filled, price extended impulsively toward the psychological resistance zone.
Watching the decision area near 152.500 for possible retracement or continuation.
Market Overview
USDJPY has been on an aggressive bullish streak, pushing into a key resistance zone near 153.00 — a historically sensitive level where previous reversals occurred. While the dollar strength continues, exhaustion signs may appear as liquidity builds near the highs. A short-term pullback to 151.500–151.000 could set the stage for the next directional move.
Key Scenarios
✅ Bullish Case 🚀 → Break & close above 153.00 → 🎯 Target 154.200 → 🎯 Target 155.000
❌ Bearish Case 📉 → Rejection from 153.00 → 🎯 Target 151.500 → 🎯 Target 150.200
Current Levels to Watch
Resistance 🔴: 153.000 / 154.200
Support 🟢: 151.500 / 150.200
⚠️ Disclaimer: This analysis is for educational purposes only. Not financial advice.

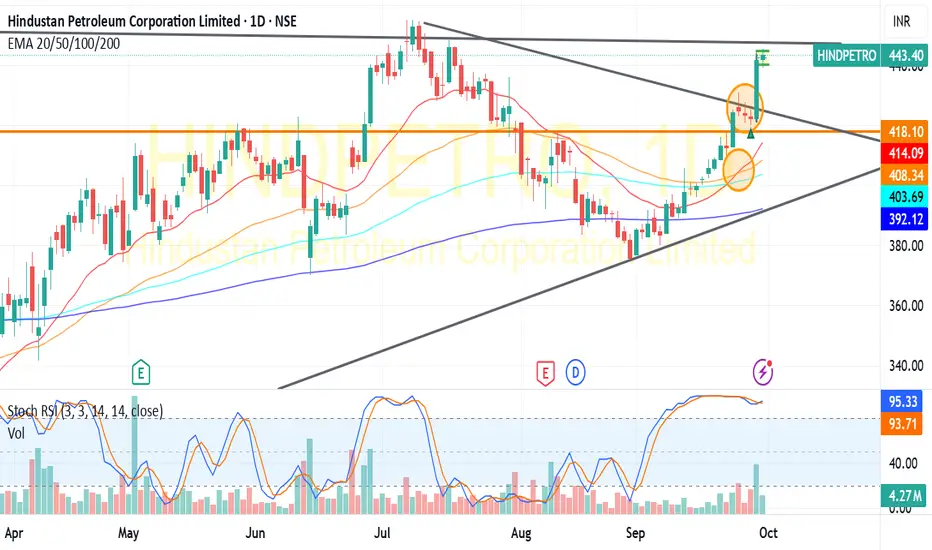
HPCL:Likely Flag Pattern Break OutHPCL:Has formed a flag pattern in daily chart and also has given Golden DEMA Cross over -20 DEMA against 50/100/200DEMA in daily chart.
Combination of the above suggests a possible15 point move -equivalent to the length of the Pole (Pole & Flag pattern break out) towards 460+(For educational purpose only)
NZDUSD | RBNZ’s Surprise 50bps Cut – Testing Channel SupportMacro Hook:
The Reserve Bank of New Zealand shocked markets with a 50bps rate cut, maintaining a dovish tone and signaling room for further easing. NZD/USD dropped over 1% following the announcement.
Technical Lens:
Price is now retesting descending channel support near 0.5750 after the sharp post-decision selloff. RSI shows oversold conditions, suggesting potential for a short-term pause if support holds.
Scenarios:
If 0.5750 holds → potential rebound toward 0.5900 resistance.
If 0.5750 breaks → opens room toward 0.5600 and extends the broader downtrend.
Catalysts:
Next RBNZ meeting in November (market now pricing another 25bps cut).
U.S. CPI and Fed commentary shaping USD direction.
Takeaway:
0.5750 is the key inflection zone — watch for confirmation if the channel base holds or gives way.

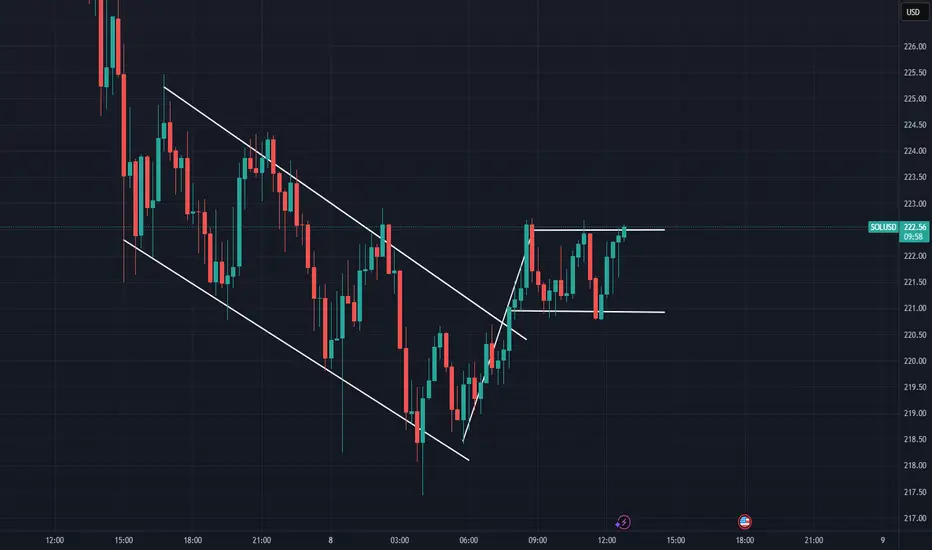
Descending channel, followed by a bullish flagSolana seemed to have stabilized again. Wondering if the bullish flag pattern will work out perfectly again. This all depends on BTCUSD and ETHUSD atm.
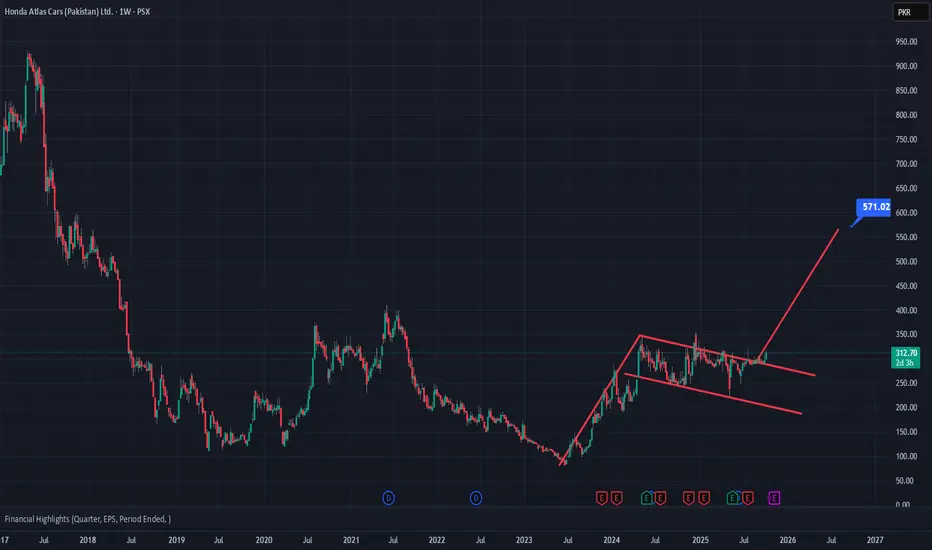
HCAR – Bullish Flag Breakout on Weekly ChartHCAR has broken out of a bullish flag pattern around the 295 level on the weekly timeframe, confirming a continuation of its prior uptrend. The breakout was supported by strong momentum, suggesting further upside potential.
Key Levels:
Breakout: 295
Current Price: ~313
Target (TP): 570
Stop Loss (SL): 260
Technical Outlook:
The price has successfully retested the breakout zone and is now holding above it. Sustaining this level may drive the next bullish leg toward the 570 resistance zone. The structure remains strong unless the price falls back below 260.
Bias: Bullish
Pattern: Bullish Flag Breakout
Timeframe: Weekly
NZDUSD short this pair broke out of the upward trending channel.
now forming a donw trend.
price confirmed it with creating a continuation pattern for entry.

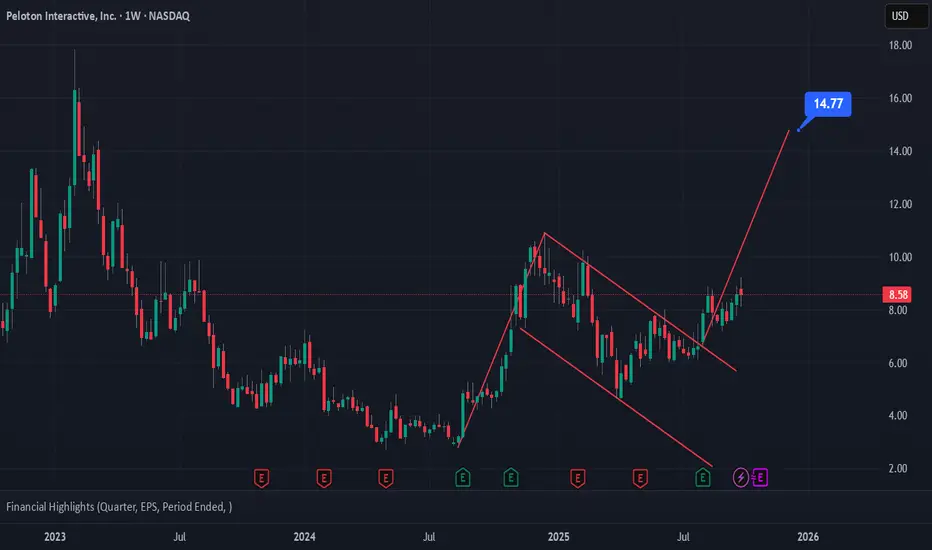
Peloton (PTON) Weekly — Bullish Flag Breakout Targeting $14.77Peloton (PTON) is forming a clean bullish flag pattern on the weekly timeframe. The price broke out from the downward channel, suggesting the continuation of the prior bullish impulse.
Pattern: Bullish flag breakout
Breakout Confirmation: Above $8.00
Current Price: ~$8.58
Target Levels: $13.80 and $14.77
Support Zone: $7.00–$7.50
Invalidation: Below $7.00
If momentum continues, a move toward $14.77 looks achievable in the coming weeks as price resumes its prior uptrend.
📈 Bias: Bullish continuation
⏰ Timeframe: Weekly (1W)
BTCUSD Bullish Confirmations Within An H4 Demand ZoneDouble Confluence within A demand zone. Price has swept liquidity within demand.
There is a double bottom rejection pattern and a bullish flag.
The trend is Still Your Friend.

54% Spot Profit ARUSDT / Arweave coinEntry Point : 5.248
Partial-exit : 5.884
Take Profit: 6.65
Stop-Loss : 4.89
A partial exit in the range of 30% to 50% is under consideration and make it free.

Visa looking for a new pumpgot out of the flag dead bounce looking to start a new cycle.
the true play is to load up over the next 3 days, hoping for green candles.
red will reverse the play but 3 greens = super bull case
we want to retest ath

FLAG!Look at this flag.
Look at the coiling after break out from flag.
This looks like it wants to jump.
For note, I own 10 shares of this company, am looking into possibly funneling some more money though into this stock for a pure scalp play.
RED LINE IS YOUR FREAK OUT LINE- DO NOT OWN BELOW THIS POINT
Otherwise, happy trading and we would WANT to aim for the 161.8% retracement level.
But if i were to be honest, im looking to get out maybe at $200

BMNR bull caseFOR REFERENCE : I AM A BULL AND OWN 300+ SHARES
NO CURRENT OPTION PLAYS
We have drawn a HUGE flag and have consolidated for quite some time.
We are far from being overbought and have finally broken out and closed green from this formation.
I am of the belief that we can and will pump this as ETH potentially reaches price discovery mode.
Shadow lines are valid as we rise up and find a potential channel between these as we trend "UP&RIGHT"
We are using the lowest level (YELLOW) as a bear case scenario.
If we are approaching, we turn bearish for near term. if we close below yellow, that means ETH is in freefall and we want to wait until we find a good place to buy back in for positive scalps.
This is a BULL PLAY today. With this trade there is no price target because of ETH price discovery. My holdings are meant to scalp and raise our STOP LOSS as we climb.
Though because of BMNR's past history, I do not put it past the ticker to reach levels like 90, 105 and 130.

Link UPDATE (1D)LINK is about to complete its accumulation phase. On the daily chart, it’s breaking out of a clearly visible bull flag pattern, and according to Elliott Wave Theory, the 5th wave is now beginning.
If LINK manages to hold above $20, it could be on its way toward a target zone between $34 and $35.

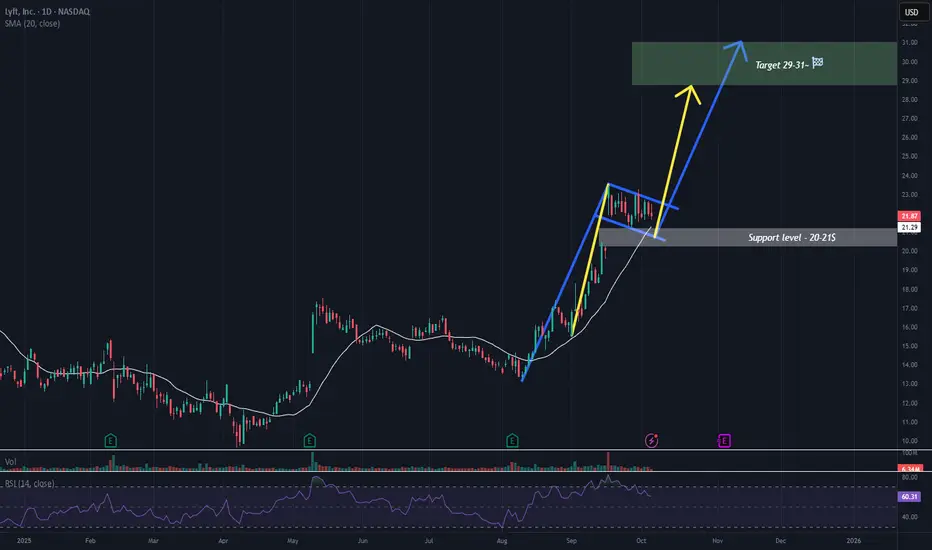
$LYFT - Bullish Momentum and Flag Formation in Higher RangesLYFT has made a remarkable upward move. The stock currently appears to be holding strong in the higher price ranges, potentially forming two bullish flag patterns, which could signal continuation toward the next target zone of $29–$31. On the downside, key support levels are identified at $21.20 and $20.00.
This is not a recommendation to buy or sell.
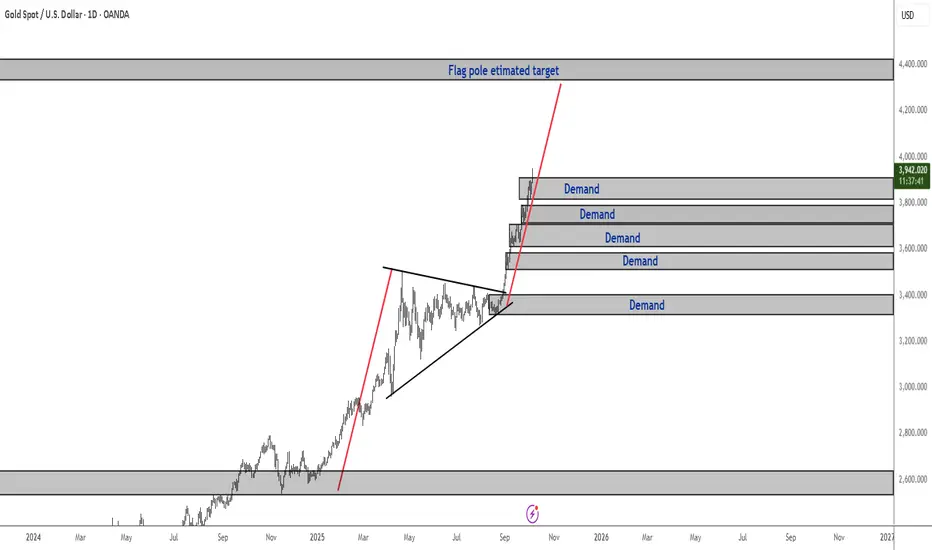
Gold Daily TF Bull Flag and Consistent Daily Demand ZonesThis is not the type of market you want to be betting on sellers just yet.
Keep riding the uptrend.