WABI/BTC Analyze !!! Hi, today I want to talk about one of the old Tokens of the market that has been in its five descending waves for a long time. maybe you can think about invest on it. The name of the token is 👉 Wabi 👈
Wabi Analyze ( WABIBTC ) Timeframe 2D ⏰
Location🌊 : Fortunately, Wabi was able to finish 5 descending waves at 0.00000929BTC , then it started to run on Big falling wedge & Descending Channel + started corrective structure by wave A that it had a Double Three corrective structure (W-X-Y) .
after wave A , it started to go down to the lower line of our Big falling Wedge , and at the same time, it finished Wave B (Structure of Wave B is ZigZag ).
The corrective structure of Wabi is Flat (3-3-5) , so we saw five impulsive microwaves (Wave C ) that ended on the upper line of our Big falling Wedge .
I was able to find another Small falling wedge inside on Big ones, it can be a key pattern for changing downtrend.
Price was able to break the Small falling wedge and Wabi started the new journey .
I think that Wabi can break Big falling Wedge too(soon) or it will rest on our Big falling wedge .
Resistance zone on Wabi's way : 0.00001843 BTC until 0.00001752BTC
Support zone on Wabi's way : 0.00000378 BTC until 0.00000237 BTC
Wabi Analyze ( WABIBTC ) Timeframe 4h ⏰
Location 🌊: as I said, Wabi was able to break a Small falling wedge and I tried to count waves after this happens. please pay attention to my analysis 👇https://www.tradingview.com/x/IGE2bc0P/
Wabi is on microwave C of main wave 4 .
End of the main wave 4 : 0.00000478 BTC - 0.0000046 BTC + TRZ ( Time Reversal Zone ), after that Wabi can start the main wave 5 or price can rest at time⏰ between 0.00000518 BTC until 0.0000046 BTC .
My Suggestion : if you want to have Wabi on your Portfolio , you can take it around 0.00000518 BTC until 0.0000046 BTC . // 🎯Target 🎯for end of August == 0.00000518 BTC until 0.0000046 BTC ( 0.00000478 BTC - 0.0000046 BTC (more possible))// Highest price of August Will 0.00000584 BTC .
Do not forget to put Stop loss for your positions (For every position you want to open).
Please follow your strategy , this is just my idea, and I will be glad to see your ideas in this post.
Please do not forget the ✅ ' like' ✅ button 🙏😊 & Share it with your friends, Thanks, and Trade safe
Flat

BTC, Major Update ! Flat Correction ScenariosBTC Shocked many analysts one more time ! What is the most possible scenarios now?
BTC proved 100 % today that those (including me) who expected a zigzag correction were completely wrong. But, this the nature of the market. Nobody can make 100 % accurate analysis and predictions.!
I see what is going on Bitcoin as a flat correction. There are three types of flat corrections : 1. regular 2. irregular and 3. Running
Regular flat correction is certainly rejected as we have a new ATH but both irregular and running are possible now and discussed below:
Right side of the chart
Irregular flat which is shown on the right side of the chart will push back the price down to below 28500 ! Is it really possible? Of course it is technically possible. Is it possible for BTC now? Of course possible but how much? I give very low chance for this scenario now but keep it in mind that every thing is possible in the market every time. Typical irregular flat correction target is 69000-74000 USD zone which is a strong resistance.
Left side of the chart:
Running flat correction will go much higher above former ATH typically up to 1.618 extension of last drop which is around 87000 USD for BTC now. If it goes there typical next correction of wave C is a decline down to previous ATH which is around 65000 USD.After that we have a new powerful motive wave which goes easily above 10000 USD. Less probable yet valid running flat scenario is to start correction after hitting 69000-74000 resistance target zone , a decline down to around 52000 and then starting a new motive wave up to above 10000 USD. Running flat correction scenarios is shown on the left side of the chart. I give more chance to typical running flat scenario now.
Hope this analysis to be useful for you my friends and wish you success in your trades


Advanced way To Trade A Flat Correction | Elliott Wave TheoryFlats are uncommonly traded correction patterns on the Elliott Waves Traders Communities. I go over The in and outs of the flat correction. Wave A is a correction, wave B is a correction, and wave C is a motive wave.

CADCHF - The Perfect Correction 🔥CADCHF is currently showing us the perfect correction. In Elliot wave theory, this correction is called a Flat correction made up of 3-3-5.
3 waves - WXY (Wave A)
3 Waves - WXY (Wave B)
5 Waves - 12345 (Wave C - we are currently in Wave C)
After the massive impulse in February 2021, price has been stuck in a parallel correction. Within that channel, we can see a number of corrective moves that could have been caught using elliot wave theory. The bigger channel is supporting the ABC corrective move.
Wave A - 3 waves. The price action to take us from the top of the channel to the bottom is the move marked WXY in red. Within that move, we can see that we had 2 minor ABC moves.
Wave B - 3 waves. was similar where we had an WXY move and within that, had a minor ABC move.
Wave C - 5 waves. We are currently in the bigger wave C now where it has 5 waves to the move with wave 3 being the biggest. We are currently in wave 1 of the bigger Wave C)
Trade Idea:
Watch for wave 2 - this will be a corrective move. Once you have identified wave 2, you can catch the big wave 3!
If you enjoyed this little breakdown, leave a like and comment what you think!
As always, trade safe.

SolanaSolana is incredibly interesting.
It seems to currently have completed a nice 5-wave impulse of +43 000% in just a year and a half.
Personally, I wouldn't mind if this here were to be a running flat correction - an ABC - to retest the primary trend line.
Given that this is on the log chart, we're still talking a nice 45-50% retracement, which should be good enough prior to being ready for the next leg up.
www.tradingview.com

CADJPY SELL IDEAI Have a bearish bias on xxxJPY . My confluence on CADJPY is the head and shoulder pattern and bearish flat

TSLA may reach around 900.40 again. 24/9/21TESLA price may reach near 900.40 again where there is a "possibility" to form flat pattern in wave 2 (Red Circled) AS Price now may trending up toward wave (B)( Cyan/ light Blue) of the flat pattern..


GBPJPY probably last leg up toward wave 5 (yellow) 2/9/21GBPJPY monthly/correction most likely will be completed at around 160 after completing its flat correction pattern with wave 5 (yellow)..Also Price level of 160 would be a confluence area of 1) Major Supply zone 2) Monthly Down Trend line .. Stop Lost for the long is 149.184

flat correction 3-3-5possible retest 1821.5 (or higher up to 1827) before dropping again (1800 or 1797 or 1787)
strong resistance at 1831 if 1831 broken see 1836 and 1844 or 1847 as next target
IMO if 1787 retest then daily candle close at 1797 or 1800++
then 1844 would be next target (and possible target higher than 1844 especially 185x zone)


CHFJPY SELL | Elliot WavesCHFJPY is expected to breakdown to wave 4 of the Elliot impulsive wave.
wait for pull down and flat correction to enter

Bitcoin Analyze (Counting Waves+Scenarios)!!!Hi, I Came back again with Bitcoin counting waves. still, I am believing that Bitcoin was able to pass Main wave B at 48800$, also, As I said in my previous post ''Bitcoin Analyze (Counting Waves at Timeframe 15min)!!!'',❗️Warning❗️: over 46822$, my counting waves will be fail. and NOW, my counting was failed (Normal, counting waves can change). So I tried to count again and find 2 Scenarios for these Days & Hours.
I don't know that did you read my previous post about Bitcoin analysis or not !? if YES, please read this post, if NO, first please read my post with the topic''Bitcoin Analyze (Road Map)!!!🗺️''.
Bitcoin Analyze ( BTCUSDT ) Timeframe 30 min⏰
Location🌊: Bitcoin was able to pass Main wave B at 48800$. now, I think that Bitcoin is resting time ⏰. after Main wave B, we save wave A that it had 3 microwaves (5-3-5 ZigZag), so the Corrective Structure of resting time can be (3-3-5 (Flat) =Scenario 1) or (3-3-3-3-3 (Triangle (probably Contracting Triangle)= Scenario 2).
At the moment Bitcoin is running on wave B. we passed microwaves a & b of Wave B that they had 3 microwaves, so wave B is a flat correction (3-3-5). now we have to find the end of microwave 5 of microwave c of wave B.
Tip: microwave 3 of microwave c of wave B is extended. If wave 3 is extended, then wave 1 and 5 are often nearly equal in magnitude and duration. If equality is lacking, a 61.8% relationship is next most likely. If microwave 1 and microwave 5 want to be equal in size, microwave 5 can continue up to 47413$ (Around the Current Price + TRZ).
As result,47413$ can be one of the targets of the end of wave B. the end of wave B can continue until 48100$ or even 49100$.
In addition: stochastic is showing the end of the movement 👇
When we can find and sure about the end of wave B, we will have 2 Scenarios :
Scenario 1: Bitcoin will complete Flat Correction (3-3-5) and probably it will break our Heavy Support (43960-43770$) == Sign for starting Main Wave C.
Scenario 2: Bitcoin will complete Triangle Correction (3-3-3-3-3), probably this triangle will be Contracting Triangle.
My Suggestion: if you have Bitcoin, you have to think about taking profit from them Soon/ if you don't have coins, Don't be FOMO, probably time will give you another chance 👍😉/ If you find the end of wave B & triggers, then you can open Short Position.
Do not forget to put Stop loss for your positions (For every position you want to open).
Please follow your strategy, this is just my idea, and I will be glad to see your ideas in this post.
Please do not forget the ✅' like '✅ button 🙏😊 & Share it with your friends, Thanks, and Trade safe

GOLD probably in wave 2 (yellow). 5 August 21GOLD Price possible forming a flat pattern now in wave 2 (yellow) ..Where price could reach at around 1785 a confluence zone of 1) Weekly Trend line Support (Cyan/Light Blue Dotted Line ) 2) Lower Trend Line Support of the Flat Pattern .. About the time of coming this Friday N.F.P...

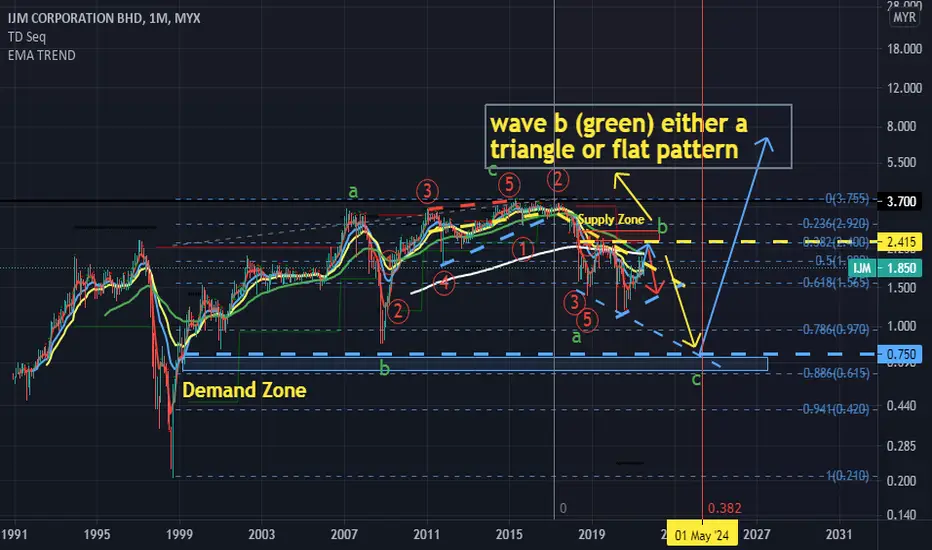
IJM probably at triangle or flat in wave a (green) 1/August/21P/S. Chart Pattern "Work"! As "Geometry Pattern" as "Face Expression"" are a form of " Reflection of Emotion " from market sentiment. It doesn't matter that "emotion" was a "Face Expression" "generated" by a "dogs. cats etc" or humans OR on Charts! IT's "nature phenomena"!! .. for us to "feel,see" the "fear. greed, euphoria " etc on the market!..
IJM probably still in ranging market either in flat or bearish triangle pattern. before trending down toward around RM 0.75 the next major demand zone and meaning Malaysia Construction Industry only recover on late 2023 or 2024??

Elliott Wave Analysis: WHEAT Is Still Looking For The BottomHello traders and investors!
Today we will talk about commodities, specifically WHEAT, in which very interesting development.
Well, as you know, commodities have been very bullish for the last year and some of them made strong and impulsive rise, but this is not the case for WHEAT, as we see slower price action and corrective wave structure from the lows.
We are talking about (A)-(B)-(C) flat correction where wave C has ended within an ending diagonal (wedge) pattern. The whole structure belongs to a higher degree wave IV correction of a bigger monthly wedge shape that can send the price back to lows for wave V before market finds the bottom.
What we want to say is that maybe it's time for a slow down in the commodity market, where WHEAT could be on of the weakest, especially after recent strong and impulsive decline back below lower ending diagonal pattern, which confirms that correction from the lows is completed, but real bears may show up below 600 region!
Be humble and trade smart!
If you like what we do, then please like and share our idea!
Disclosure: Please be informed that information we provide is NOT a trading recommendation or investment advice. All of our work is for educational purposes only.

GBPJPY on last leg up to completed flat pattern @≈160. 28/6/21GBPJPY Last updated was @ 8 May 2021 now probably on its way to completed the last leg of Wave 4 (red) Flat Pattern ..

carefull bulls, possible flat correctioncome on gold... why you like flat correction that much
Running flat Elliott wave correction.
A running flat correction subdivides into 3-3-5 internal wave pattern.
Wave 'B' breaks the beginning of wave 'A'.
Waves C tends towards 100% the length of wave A and will not break the low of wave 'A'.
The running flat correction wave can appear in any corrective position.
Again, a trader can use the starting point of wave 'a' to enter a trade, with the aim of catching the market as it re-enters the trend move again.

ETH Flat Correction Textbook pattern of elliottwave Flat correction spotted in Ethereum Chart. A-B-C structure with 3-3-5 minor structure.
I expect price to visit 2100-2200 marked with 0.618 fib level before bouncing back up

GBPUSDTF: Monthly
GBPUSD has some strong potential to drop back down from the current area over the next year or two. Looks like a classic regular flat corrective pattern.

💨𝙀𝙡𝙡𝙞𝙤𝙩𝙩 𝙒𝙖𝙫𝙚 𝙋𝙖𝙩𝙩𝙚𝙧𝙣: 𝙁𝙡𝙖𝙩🌊 ●●● 𝙁𝙡𝙖𝙩 (FL)
❗❗ 𝙂𝙚𝙣𝙚𝙧𝙖𝙡 𝙧𝙪𝙡𝙚𝙨
● A flat always subdivides into three waves.
● Wave A is always a zigzag, flat or combination .
● Wave B is always a zigzag.
● Wave C is always an impulse or a ending diagonal.
❗ 𝙂𝙚𝙣𝙚𝙧𝙖𝙡 𝙜𝙪𝙞𝙙𝙚𝙡𝙞𝙣𝙚𝙨
● Wave A is usually a zigzag.
●● 𝙀𝙭𝙥𝙖𝙣𝙙𝙚𝙙 𝙁𝙡𝙖𝙩 (Exp.FL)
❗❗ 𝙍𝙪𝙡𝙚𝙨
● Wave B always ends after the start of wave A .
● Wave C always ends past the end of wave A .
❗ 𝙂𝙪𝙞𝙙𝙚𝙡𝙞𝙣𝙚𝙨
● Wave B usually retraces 123.6 or 138.2% of wave A , less often — 161.8% .
● Wave C is often equal to 161.8% of wave A , less often — 261.8% .
● The most common type of flat.
●● 𝙍𝙪𝙣𝙣𝙞𝙣𝙜 𝙛𝙡𝙖𝙩 (Runn.FL)
❗❗ 𝙍𝙪𝙡𝙚𝙨
● Wave B always ends after the start of wave A .
● Wave C never goes beyond the end of wave A .
❗ 𝙂𝙪𝙞𝙙𝙚𝙡𝙞𝙣𝙚𝙨
● Within such a flat wave B should end well above the origin of wave A and that means wave C might reflect a 61.8% or even a 100% relationship to wave A .
● A running flat indicates that the forces in the direction of the larger trend at next higher degree are powerful.
● Wave B is usually no more than twice the length of wave A .
● Keep in mind that a running flat is rare.
●● 𝙍𝙚𝙜𝙪𝙡𝙖𝙧 𝙛𝙡𝙖𝙩 (Reg.FL)
❗❗ 𝙍𝙪𝙡𝙚𝙨
● Wave B never goes beyond beyond the start of wave A .
● Wave B always retraces at least 90 percent of wave A .
● Wave C always ends past the end of wave A .
❗ 𝙂𝙪𝙞𝙙𝙚𝙡𝙞𝙣𝙚𝙨
● The rarest type of flat.
Elliott Wave Principal 2005 & QA EWI .
