GBPUSD - Trade Plan Heading into NY SessionTaking a look at GBPUSD on the 1 hour timeframe, I'm expecting to see a retest of around the 1.35 handle. Once price action reaches that zone, I'll simply be looking to implement my scaling short sell strategy. I'll likely enable my Expert Advisor for MT5 to manage this trade.
Forexsignals

GBP/USD Set to Drop to 1.03600SPREADEX:GBP / AMEX:USD (3W)
The British Pound (GBP) is under siege, and the setup for GBP/USD screams downside. We're seeing a confluence of weak UK fundamentals, divergent monetary policies, and speculative positioning that's stacking up against Sterling.
Elliott Wave analysis aligns perfectly with this—labeling an irregular expanded flat correction in a broader downtrend, targeting new lows below 1.03600 from the current 1.34310 spot.
Weekly COT Report Highlights:
• US Dollar (USD): Traders were net-short the US dollar by -6.1 billion (-0.5b w/w)
• European dollar (EUR): Asset managers increased net-long exposure to a 19-month high
• British pound (GBP): Large speculators increased net-short exposure by 6.2k contracts
• Japanese yen (JPY): Net-long exposure rose 12.5k contracts combined across large specs and asset managers
• Australian dollar (AUD): Traders most bearish in 16 months
• Canadian dollar (CAD): Net-short exposure increased by 12k contracts
• Crude Oil (WTI): Managed funds cut net-long exposure by -10.7k contracts, a 15-year low
Hedge funds are aggressively shorting GBP/USD:
➖ Macro funds like Bridgewater are likely involved, with IG reporting a 150% surge in short positions amid UK fiscal risks (30-year gilt yields at 5.75%).
➖ Recent news (June-August 2025) highlights UK fiscal turmoil (record £14B bond sale), stagflation risks (inflation projected at 3.6%, growth at 1.0-1.3%), and trade headwinds from US tariffs.
➖ Economic data: UK GDP +0.3% QoQ vs. US +0.8%, unemployment rising, and PMI below average. Debt-to-GDP at 96%.
➖ Rates: BoE cut to 4% (3 more cuts by 2026), Fed at 4.25-4.5% (2 cuts in 2025), widening the differential.
DXY forecast: Rebound to 98-100 by Q4, potentially hitting 100+, amplifying GBP/USD downside.
Conclusion:
GBP/USD likely to fall from 1.34310 to 1.03600, targeting 1.20-1.15 short-term.
#GBP #GBPUSD #Trading

Inflation is rising but countries are still pumping moneyGold rose amid rising global bond yields.
In the US, the 30-year Treasury yield approached 5%, while yields on UK, Australian and Japanese bonds also rose rapidly. The sell-off reflected concerns about large government spending and the risk of inflation. According to Bloomberg, the global bond yield index fell 0.4% on September 2, indicating strong selling pressure.
In addition, a series of corporate bond sales on September 2 and uncertainties related to the independence of the US Federal Reserve (Fed) increased pressure on the bond market in general.
In addition, investors are also cautious about the possibility that US stocks and many other markets will enter a period of sharp decline in September-October, which has often seen large fluctuations in the past.
Gold is entering a new bull run after several months of stagnation. Contrary to forecasts of a deep correction, the precious metal has maintained its strength and bounced back thanks to signals that the Fed may ease monetary policy under pressure from President Donald Trump.
The Fed signaled a rate cut despite inflation remaining high, near 3% instead of the 2% target of many years ago. This means that the prices of goods and services may go up, and the USD may lose value.

USDJPY possible long for 150.50#usdjpy price remain stuck withing descending wedge channel for one & half month. Ultimately price broke channel to the up side. 147.30-146.75 area of interest for long. stop loss below 146.60. target: 150.50

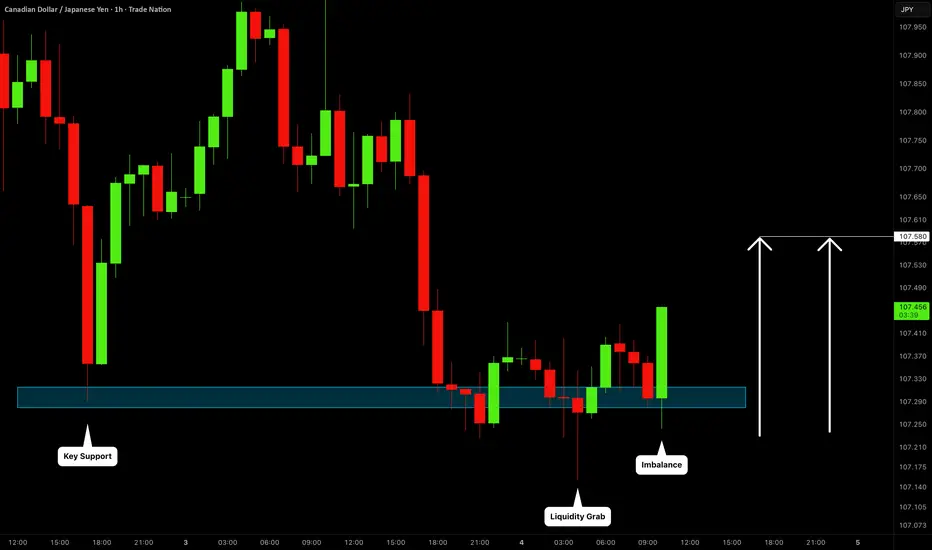
CADJPY: Bullish Move After Liquidity Sweep 🇨🇦🇯🇵
It looks like we have a confirmed bear trap after a test
of a key intraday horizonta support on CADJPY.
A formation of a bullish imbalance candle indicates
a strong bullish sentiment now.
I expect a bullish move to 107.58
❤️Please, support my work with like, thank you!❤️
I am part of Trade Nation's Influencer program and receive a monthly fee for using their TradingView charts in my analysis.
Potential bearish drop off?WTI Oil (XTI/USD) has reacted off the pivot and could drop to the 1st support.
Pivot: 64.20
1st Support: 62.48
1st Resistance: 65.62
Risk Warning:
Trading Forex and CFDs carries a high level of risk to your capital and you should only trade with money you can afford to lose. Trading Forex and CFDs may not be suitable for all investors, so please ensure that you fully understand the risks involved and seek independent advice if necessary.
Disclaimer:
The above opinions given constitute general market commentary, and do not constitute the opinion or advice of IC Markets or any form of personal or investment advice.
Any opinions, news, research, analyses, prices, other information, or links to third-party sites contained on this website are provided on an "as-is" basis, are intended only to be informative, is not an advice nor a recommendation, nor research, or a record of our trading prices, or an offer of, or solicitation for a transaction in any financial instrument and thus should not be treated as such. The information provided does not involve any specific investment objectives, financial situation and needs of any specific person who may receive it. Please be aware, that past performance is not a reliable indicator of future performance and/or results. Past Performance or Forward-looking scenarios based upon the reasonable beliefs of the third-party provider are not a guarantee of future performance. Actual results may differ materially from those anticipated in forward-looking or past performance statements. IC Markets makes no representation or warranty and assumes no liability as to the accuracy or completeness of the information provided, nor any loss arising from any investment based on a recommendation, forecast or any information supplied by any third-party.

Bearish reversal for the Kiwi?The price has rejected off the pivot and could drop to the 1st support which acts as a pullback support.
Pivot: 0.5888
1st Support: 0.5839
1st Resistance: 0.5911
Risk Warning:
Trading Forex and CFDs carries a high level of risk to your capital and you should only trade with money you can afford to lose. Trading Forex and CFDs may not be suitable for all investors, so please ensure that you fully understand the risks involved and seek independent advice if necessary.
Disclaimer:
The above opinions given constitute general market commentary, and do not constitute the opinion or advice of IC Markets or any form of personal or investment advice.
Any opinions, news, research, analyses, prices, other information, or links to third-party sites contained on this website are provided on an "as-is" basis, are intended only to be informative, is not an advice nor a recommendation, nor research, or a record of our trading prices, or an offer of, or solicitation for a transaction in any financial instrument and thus should not be treated as such. The information provided does not involve any specific investment objectives, financial situation and needs of any specific person who may receive it. Please be aware, that past performance is not a reliable indicator of future performance and/or results. Past Performance or Forward-looking scenarios based upon the reasonable beliefs of the third-party provider are not a guarantee of future performance. Actual results may differ materially from those anticipated in forward-looking or past performance statements. IC Markets makes no representation or warranty and assumes no liability as to the accuracy or completeness of the information provided, nor any loss arising from any investment based on a recommendation, forecast or any information supplied by any third-party.

Bearish drop off?The Aussie (AUD/USD) has rejected off the pivot and could drop to the 61.8% Fibonacci support.
Pivot: 0.6556
1st Support: 0.6469
1st Resistance: 0.6589
Risk Warning:
Trading Forex and CFDs carries a high level of risk to your capital and you should only trade with money you can afford to lose. Trading Forex and CFDs may not be suitable for all investors, so please ensure that you fully understand the risks involved and seek independent advice if necessary.
Disclaimer:
The above opinions given constitute general market commentary, and do not constitute the opinion or advice of IC Markets or any form of personal or investment advice.
Any opinions, news, research, analyses, prices, other information, or links to third-party sites contained on this website are provided on an "as-is" basis, are intended only to be informative, is not an advice nor a recommendation, nor research, or a record of our trading prices, or an offer of, or solicitation for a transaction in any financial instrument and thus should not be treated as such. The information provided does not involve any specific investment objectives, financial situation and needs of any specific person who may receive it. Please be aware, that past performance is not a reliable indicator of future performance and/or results. Past Performance or Forward-looking scenarios based upon the reasonable beliefs of the third-party provider are not a guarantee of future performance. Actual results may differ materially from those anticipated in forward-looking or past performance statements. IC Markets makes no representation or warranty and assumes no liability as to the accuracy or completeness of the information provided, nor any loss arising from any investment based on a recommendation, forecast or any information supplied by any third-party.

Potentially bullish rise?The Loonie (USD/CAD) has bounced off the pivot and would rise to the 1st resistance that is slightly above the 61.8% Fibonacci retracement.
Pivot: 1.3779
1st Support: 1.3731
1st Resistance: 1.3858
Risk Warning:
Trading Forex and CFDs carries a high level of risk to your capital and you should only trade with money you can afford to lose. Trading Forex and CFDs may not be suitable for all investors, so please ensure that you fully understand the risks involved and seek independent advice if necessary.
Disclaimer:
The above opinions given constitute general market commentary, and do not constitute the opinion or advice of IC Markets or any form of personal or investment advice.
Any opinions, news, research, analyses, prices, other information, or links to third-party sites contained on this website are provided on an "as-is" basis, are intended only to be informative, is not an advice nor a recommendation, nor research, or a record of our trading prices, or an offer of, or solicitation for a transaction in any financial instrument and thus should not be treated as such. The information provided does not involve any specific investment objectives, financial situation and needs of any specific person who may receive it. Please be aware, that past performance is not a reliable indicator of future performance and/or results. Past Performance or Forward-looking scenarios based upon the reasonable beliefs of the third-party provider are not a guarantee of future performance. Actual results may differ materially from those anticipated in forward-looking or past performance statements. IC Markets makes no representation or warranty and assumes no liability as to the accuracy or completeness of the information provided, nor any loss arising from any investment based on a recommendation, forecast or any information supplied by any third-party.

Bullish bounce off?The Swissie (USD/CHF) has bounced off the pivot which acts as a pullback support and could potentially rise to the 1st resistance.
Pivot: 0.8024
1st Support: 0.7981
1st Resistance: 0.8088
Risk Warning:
Trading Forex and CFDs carries a high level of risk to your capital and you should only trade with money you can afford to lose. Trading Forex and CFDs may not be suitable for all investors, so please ensure that you fully understand the risks involved and seek independent advice if necessary.
Disclaimer:
The above opinions given constitute general market commentary, and do not constitute the opinion or advice of IC Markets or any form of personal or investment advice.
Any opinions, news, research, analyses, prices, other information, or links to third-party sites contained on this website are provided on an "as-is" basis, are intended only to be informative, is not an advice nor a recommendation, nor research, or a record of our trading prices, or an offer of, or solicitation for a transaction in any financial instrument and thus should not be treated as such. The information provided does not involve any specific investment objectives, financial situation and needs of any specific person who may receive it. Please be aware, that past performance is not a reliable indicator of future performance and/or results. Past Performance or Forward-looking scenarios based upon the reasonable beliefs of the third-party provider are not a guarantee of future performance. Actual results may differ materially from those anticipated in forward-looking or past performance statements. IC Markets makes no representation or warranty and assumes no liability as to the accuracy or completeness of the information provided, nor any loss arising from any investment based on a recommendation, forecast or any information supplied by any third-party.

Bearish reversal?The Cable (GBP/USD) is reacting off the pivot which acts as a pullback resistance that aligns with the 61.8% Fibonacci retracement and could reverse to the pullback support.
Pivot: 1.3461
1st Support: 1.3346
1st Reistance: 1.3540
Risk Warning:
Trading Forex and CFDs carries a high level of risk to your capital and you should only trade with money you can afford to lose. Trading Forex and CFDs may not be suitable for all investors, so please ensure that you fully understand the risks involved and seek independent advice if necessary.
Disclaimer:
The above opinions given constitute general market commentary, and do not constitute the opinion or advice of IC Markets or any form of personal or investment advice.
Any opinions, news, research, analyses, prices, other information, or links to third-party sites contained on this website are provided on an "as-is" basis, are intended only to be informative, is not an advice nor a recommendation, nor research, or a record of our trading prices, or an offer of, or solicitation for a transaction in any financial instrument and thus should not be treated as such. The information provided does not involve any specific investment objectives, financial situation and needs of any specific person who may receive it. Please be aware, that past performance is not a reliable indicator of future performance and/or results. Past Performance or Forward-looking scenarios based upon the reasonable beliefs of the third-party provider are not a guarantee of future performance. Actual results may differ materially from those anticipated in forward-looking or past performance statements. IC Markets makes no representation or warranty and assumes no liability as to the accuracy or completeness of the information provided, nor any loss arising from any investment based on a recommendation, forecast or any information supplied by any third-party.

Bearish reversal off pullback resistance?The Fiber (EUR/USD) is reacting off the pivot which has been identified as a pulback resistance that lines up with the 38.2% Fibonacci retracemen and could drop to the 1st support.
Pivot: 1.1662
!st Support: 1.1587
1st Resistance: 1.1734
Risk Warning:
Trading Forex and CFDs carries a high level of risk to your capital and you should only trade with money you can afford to lose. Trading Forex and CFDs may not be suitable for all investors, so please ensure that you fully understand the risks involved and seek independent advice if necessary.
Disclaimer:
The above opinions given constitute general market commentary, and do not constitute the opinion or advice of IC Markets or any form of personal or investment advice.
Any opinions, news, research, analyses, prices, other information, or links to third-party sites contained on this website are provided on an "as-is" basis, are intended only to be informative, is not an advice nor a recommendation, nor research, or a record of our trading prices, or an offer of, or solicitation for a transaction in any financial instrument and thus should not be treated as such. The information provided does not involve any specific investment objectives, financial situation and needs of any specific person who may receive it. Please be aware, that past performance is not a reliable indicator of future performance and/or results. Past Performance or Forward-looking scenarios based upon the reasonable beliefs of the third-party provider are not a guarantee of future performance. Actual results may differ materially from those anticipated in forward-looking or past performance statements. IC Markets makes no representation or warranty and assumes no liability as to the accuracy or completeness of the information provided, nor any loss arising from any investment based on a recommendation, forecast or any information supplied by any third-party.

Positive factors for gold and silver as safe-haven assetsUS economic data released on Wednesday showed a weaker JOLTS report on job vacancies. The report (June data) showed that US job vacancies fell to 7.437 million, down slightly from the previous month and the lowest level since April.
The report also showed that the labour market is slowing, with fewer people being hired. This is good for the doves in US monetary policy and also supports gold and silver bulls.
Global bond yields are rising (prices are falling), mainly due to concerns about inflation, government debt sales and fiscal discipline. This is also a positive factor for gold and silver as safe-haven assets, although capital gains are not a positive factor in themselves.
U.S. Treasury yields rose, with the 30-year bond now approaching 5%, while yields in the U.K., Australia and Japan also rose.
The sell-off reflected traders’ concerns about large government spending and the risk of inflation, with Bloomberg’s gauge of global bond yields down 0.4% on Tuesday.

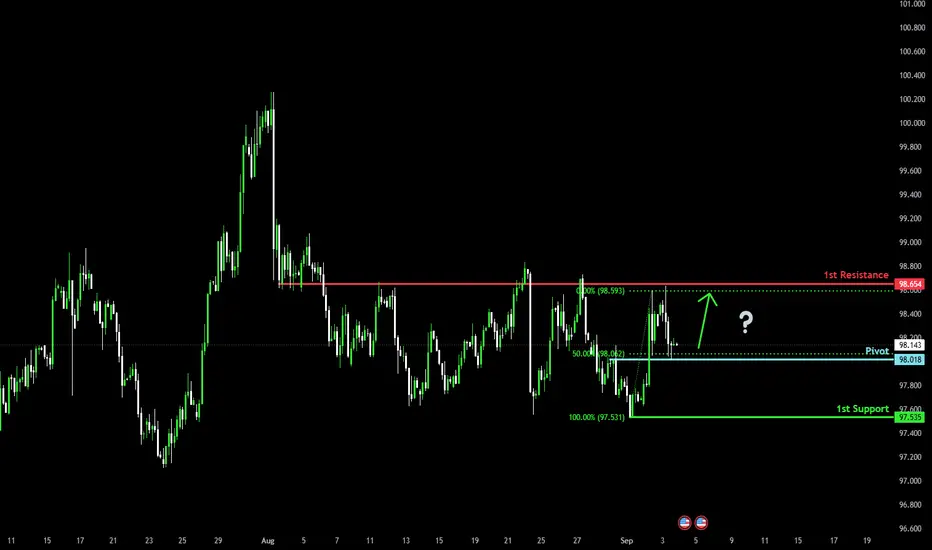
Bullish reversal at pullback support?The US Dollar Index (DXY) is falling towards the pivot, which acts as a pullback support that aligns with the 50% Fibonacci retracement and could bounce to the 1st resistance.
Pivot: 98.01
1st Support: 97.53
1st Resistance: 98.65
Risk Warning:
Trading Forex and CFDs carries a high level of risk to your capital and you should only trade with money you can afford to lose. Trading Forex and CFDs may not be suitable for all investors, so please ensure that you fully understand the risks involved and seek independent advice if necessary.
Disclaimer:
The above opinions given constitute general market commentary, and do not constitute the opinion or advice of IC Markets or any form of personal or investment advice.
Any opinions, news, research, analyses, prices, other information, or links to third-party sites contained on this website are provided on an "as-is" basis, are intended only to be informative, is not an advice nor a recommendation, nor research, or a record of our trading prices, or an offer of, or solicitation for a transaction in any financial instrument and thus should not be treated as such. The information provided does not involve any specific investment objectives, financial situation and needs of any specific person who may receive it. Please be aware, that past performance is not a reliable indicator of future performance and/or results. Past Performance or Forward-looking scenarios based upon the reasonable beliefs of the third-party provider are not a guarantee of future performance. Actual results may differ materially from those anticipated in forward-looking or past performance statements. IC Markets makes no representation or warranty and assumes no liability as to the accuracy or completeness of the information provided, nor any loss arising from any investment based on a recommendation, forecast or any information supplied by any third-party.
Could we see a bearish reversal?USD/JPY is rising towards the resistance level which his an overlap resistance that lines up with the 23.6% Fibonacci retracement and could reverse from this level to our take profit.
Entry: 148.14
Why we like it:
There is an overlap resistance level that lines up with the 23.6% Fibonacci retracement.
Stop loss: 148.92
Why we like it:
There is a swing high resistance level.
Take profit: 147.29
Why we like it:
There is an overlap support level that aligns with the 78.6% Fibonacci retracement.
Enjoying your TradingView experience? Review us!
Please be advised that the information presented on TradingView is provided to Vantage (‘Vantage Global Limited’, ‘we’) by a third-party provider (‘Everest Fortune Group’). Please be reminded that you are solely responsible for the trading decisions on your account. There is a very high degree of risk involved in trading. Any information and/or content is intended entirely for research, educational and informational purposes only and does not constitute investment or consultation advice or investment strategy. The information is not tailored to the investment needs of any specific person and therefore does not involve a consideration of any of the investment objectives, financial situation or needs of any viewer that may receive it. Kindly also note that past performance is not a reliable indicator of future results. Actual results may differ materially from those anticipated in forward-looking or past performance statements. We assume no liability as to the accuracy or completeness of any of the information and/or content provided herein and the Company cannot be held responsible for any omission, mistake nor for any loss or damage including without limitation to any loss of profit which may arise from reliance on any information supplied by Everest Fortune Group.

Bulllish bounce off pullback support?USD/CAD is falling towards the support level, which is a pullback support that aligns with the 50% Fibonacci retracement and could bounce from this level to our take profit.
Entry: 1.3770
Why we like it:
There is a pullback support that aligns with the 50% Fibonacci retracement.
Stop loss: 1.3728
Why we like it:
There is a multi-swing low support.
Take profit: 1.3855
Why we like it:
There is a pullback resistance level that aligns with the 61.8% Fibonacci retracement.
Enjoying your TradingView experience? Review us!
Please be advised that the information presented on TradingView is provided to Vantage (‘Vantage Global Limited’, ‘we’) by a third-party provider (‘Everest Fortune Group’). Please be reminded that you are solely responsible for the trading decisions on your account. There is a very high degree of risk involved in trading. Any information and/or content is intended entirely for research, educational and informational purposes only and does not constitute investment or consultation advice or investment strategy. The information is not tailored to the investment needs of any specific person and therefore does not involve a consideration of any of the investment objectives, financial situation or needs of any viewer that may receive it. Kindly also note that past performance is not a reliable indicator of future results. Actual results may differ materially from those anticipated in forward-looking or past performance statements. We assume no liability as to the accuracy or completeness of any of the information and/or content provided herein and the Company cannot be held responsible for any omission, mistake nor for any loss or damage including without limitation to any loss of profit which may arise from reliance on any information supplied by Everest Fortune Group.

Potential bearish drop off pullback resistance?GBP/USD is reacting off the resistance level, which is a pullback resistance that is slightly above the 50% Fibonacci retracement and could reverse from this level to our take profit.
Entry: 1.3451
Why we like it:
There is a pullback resistance that is slightly above the 50% Fibonacci retracement.
Stop loss: 1.3488
Why we like it:
There is a pullback resistance level that is slightly below the 78.6% Fibonacci retracement.
Take profit: 1.3397
Why we like it:
There is a pullback support that aligns with the 50% Fibonacci retracement.
Enjoying your TradingView experience? Review us!
Please be advised that the information presented on TradingView is provided to Vantage (‘Vantage Global Limited’, ‘we’) by a third-party provider (‘Everest Fortune Group’). Please be reminded that you are solely responsible for the trading decisions on your account. There is a very high degree of risk involved in trading. Any information and/or content is intended entirely for research, educational and informational purposes only and does not constitute investment or consultation advice or investment strategy. The information is not tailored to the investment needs of any specific person and therefore does not involve a consideration of any of the investment objectives, financial situation or needs of any viewer that may receive it. Kindly also note that past performance is not a reliable indicator of future results. Actual results may differ materially from those anticipated in forward-looking or past performance statements. We assume no liability as to the accuracy or completeness of any of the information and/or content provided herein and the Company cannot be held responsible for any omission, mistake nor for any loss or damage including without limitation to any loss of profit which may arise from reliance on any information supplied by Everest Fortune Group.

Bullish bounce?EUR/USD is falling towards the support level which is a pullback support that aligns with the 50% Fibonacci retracement and could bounce from this level to our take profit.
Entry: 1.1643
Why we like it:
There is a pullback support level that aligns with the 50% Fibonacci retracement.
Stop loss: 1.1615
Why we like it:
There is a pullback support level.
Take profit: 1.1704
Why we like it:
There is a pullback resistance level that is slightly below the 78.6% Fibonacci retracement.
Enjoying your TradingView experience? Review us!
Please be advised that the information presented on TradingView is provided to Vantage (‘Vantage Global Limited’, ‘we’) by a third-party provider (‘Everest Fortune Group’). Please be reminded that you are solely responsible for the trading decisions on your account. There is a very high degree of risk involved in trading. Any information and/or content is intended entirely for research, educational and informational purposes only and does not constitute investment or consultation advice or investment strategy. The information is not tailored to the investment needs of any specific person and therefore does not involve a consideration of any of the investment objectives, financial situation or needs of any viewer that may receive it. Kindly also note that past performance is not a reliable indicator of future results. Actual results may differ materially from those anticipated in forward-looking or past performance statements. We assume no liability as to the accuracy or completeness of any of the information and/or content provided herein and the Company cannot be held responsible for any omission, mistake nor for any loss or damage including without limitation to any loss of profit which may arise from reliance on any information supplied by Everest Fortune Group.

XAUUSD Alert | Liquidity Grab or Trend Reversal?”XAUUSD Alert 🚨 | Liquidity Grab or Trend Reversal?”
Gold has recently pushed into the 3525 – 3550 rejection zone, a level that has historically acted as strong supply. After this extended bullish rally, price is now showing early signs of exhaustion. This could be a liquidity grab above resistance before the market corrects lower.
My expectation here is a short-term pullback. The first key area I’ll be watching is around 3450, which lines up with a smaller demand zone and could act as a temporary support. If buyers fail to defend that level, then I expect continuation toward the 3330 – 3320 zone, which is my final target and also a major higher-timeframe support point.
This level is very important because it was previously a strong base for accumulation, and if tested again, it could provide a potential long opportunity. However, if price breaks below 3320 decisively, it would open the door for a much deeper correction.
Overall, my short-term outlook is bearish retracement, but I’ll be closely watching how price reacts once we reach the deeper support levels.

NZDUSD Channel Down targeting 0.57500.The NZDUSD pair has been trading within a Channel Down since the July 01 High and right now it is on its latest Bullish Leg.
The 1D RSI has already touched its Lower Highs trend-line, so that's an indication that the Bullish Leg might have topped already, given also the fact that the price has almost touched the 0.618 Fibonacci retracement level also, marginally above which all previous Lower Highs have been made.
As a result, we can expect the new Bearish Leg to decline by as much as -3.13% (according to the declining rate on every Bearish Leg), with our fair Target placed at 0.57500.
-------------------------------------------------------------------------------
** Please LIKE 👍, FOLLOW ✅, SHARE 🙌 and COMMENT ✍ if you enjoy this idea! Also share your ideas and charts in the comments section below! This is best way to keep it relevant, support us, keep the content here free and allow the idea to reach as many people as possible. **
-------------------------------------------------------------------------------
💸💸💸💸💸💸
👇 👇 👇 👇 👇 👇

Closing my Trades in [ 300 pips profits ]Thanks to those who followed, trusted me, and made profits.
As I mentioned in today’s commentary session:
• I took buy trades around 3535–3533, and I’m expecting the market to test the 3565 benchmark, with an extension towards 3575.
My strategy was to buy the dips, and I’m very happy with the profits so far – .
My first target (3565) is achieved, Alhamdulillah.
Additional Tip:
Selling against the current bullish bias isn’t advisable, but I believe the top is priced in and the market is cooling off. MA periods show balance, confirming this as a consolidation phase of the bull market.

CHFJPY: Bullish Accumulation is Over 🇨🇭🇯🇵
It looks like CHFJPY finally completed a bullish accumulation
within a horizontal range on a daily.
Its resistance breakout and a formation of a new local higher
high higher close is an important event.
I believe that the market will grow more and reach 185.4 level soon.
❤️Please, support my work with like, thank you!❤️
I am part of Trade Nation's Influencer program and receive a monthly fee for using their TradingView charts in my analysis.

AUDCHFAUDCHF If the price can hold above 0.51620, there is a chance that the price is in an uptrend. Consider buying in the red zone.
🔥Trading futures, forex, CFDs and stocks carries a risk of loss.
Please consider carefully whether such trading is suitable for you.
>>GooD Luck 😊
❤️ Like and subscribe to never miss a new idea!
