Participants’ Market Coverage1. Types of Market Participants and Their Coverage
Financial markets are populated by a wide range of participants, broadly categorized into institutional investors, retail investors, intermediaries, proprietary traders, hedgers, and regulators. Each group covers markets differently.
Institutional investors—such as mutual funds, pension funds, insurance companies, sovereign wealth funds, and endowments—typically provide broad market coverage. They operate across equities, fixed income, commodities, real estate, and increasingly alternative assets like private equity and infrastructure. Their long-term mandates require diversified exposure across sectors and geographies, making them key providers of stable capital. Because of their size, institutional investors influence benchmark indices and play a central role in capital allocation.
Retail investors generally have narrower market coverage. Their participation is often concentrated in domestic equities, exchange-traded funds (ETFs), derivatives for speculation or hedging, and popular thematic investments. While individually small, their collective impact can be significant, especially during periods of heightened sentiment or technological access through online platforms.
Proprietary traders and hedge funds focus on selective but deep market coverage. Rather than covering all markets broadly, they specialize in specific strategies—such as arbitrage, macro trading, statistical strategies, or event-driven trades—across multiple instruments. Their coverage is opportunistic and dynamic, shifting rapidly as risk–reward conditions change.
2. Market Coverage Across Asset Classes
Participants’ market coverage varies significantly by asset class.
In equity markets, coverage is typically broad due to high liquidity, transparency, and accessibility. Large-cap stocks attract coverage from almost all participant types, while mid- and small-cap stocks may have thinner coverage, often dominated by domestic institutions and select funds. This uneven coverage can create pricing inefficiencies in less-followed stocks.
In fixed income markets, coverage is more fragmented. Government bonds enjoy deep participation from central banks, institutions, and foreign investors, while corporate bonds—especially lower-rated or illiquid issues—have limited coverage. This asymmetry affects liquidity and price stability.
Derivatives markets—including futures and options—are heavily covered by hedgers, speculators, and arbitrageurs. Coverage here is driven by leverage, risk management needs, and the ability to express views efficiently. Participants often focus on the most liquid contracts, leaving less popular maturities or underlyings with sparse participation.
In commodity and currency markets, coverage is global but concentrated among professional participants such as exporters, importers, banks, and macro funds. Retail participation exists but is relatively smaller compared to equities.
3. Geographic Market Coverage
Participants’ market coverage also differs by geography. Developed markets generally enjoy extensive coverage due to strong regulation, transparency, and liquidity. Emerging and frontier markets, while offering higher growth potential, often suffer from limited coverage because of political risk, currency volatility, and regulatory uncertainty.
Foreign institutional investors (FIIs) play a crucial role in extending market coverage to emerging economies. Their participation improves liquidity, governance standards, and global integration. However, reliance on foreign capital can also introduce volatility, as global risk-off events may trigger sudden withdrawals.
Domestic institutions help stabilize coverage by providing a local capital base that understands country-specific risks. Balanced participation between domestic and foreign players leads to healthier market development.
4. Time Horizon and Coverage
Market participants differ in their time horizons, which influences how they cover markets.
Long-term investors—such as pension funds and insurance companies—cover markets with a focus on fundamentals, valuation, and sustainability. Their steady participation dampens excessive volatility and supports long-term price discovery.
Short-term traders, including high-frequency traders (HFTs) and day traders, cover markets at a micro level. Their activity is concentrated in highly liquid instruments and contributes to tight bid–ask spreads and rapid price adjustments. However, their coverage is shallow in illiquid or less-followed markets.
The coexistence of multiple time horizons enhances overall market efficiency. When one group withdraws, another often fills the gap, maintaining functional coverage.
5. Role of Intermediaries in Market Coverage
Intermediaries such as stock exchanges, brokers, market makers, and clearing institutions are critical to participants’ market coverage. Market makers, in particular, ensure continuous two-way quotes, enabling participants to transact even during periods of stress. Without them, coverage would become fragmented and liquidity would evaporate quickly.
Technological advancements have expanded coverage by reducing transaction costs and improving access. Electronic trading platforms allow participants to cover multiple markets simultaneously, breaking down geographic and structural barriers.
6. Information, Research, and Coverage Quality
Market coverage is not only about participation volume but also about information depth. Analysts, rating agencies, data providers, and financial media enhance coverage by producing research and disseminating information. Well-covered markets tend to be more efficient, as prices reflect available information more quickly.
Conversely, markets or securities with poor research coverage may experience mispricing. While this increases risk, it also creates opportunities for skilled participants who can conduct independent analysis.
7. Regulatory Influence on Market Coverage
Regulation shapes participants’ market coverage by defining who can participate, how much risk they can take, and which instruments are permissible. Strong regulatory frameworks encourage broader participation by building trust and reducing systemic risk. Overregulation, however, may discourage participation and reduce coverage, particularly in innovative or niche markets.
Balanced regulation promotes inclusive coverage while safeguarding market integrity.
8. Implications of Participants’ Market Coverage
Participants’ market coverage has far-reaching implications. Broad and diversified coverage enhances liquidity, stabilizes prices, and improves capital formation. Narrow or uneven coverage can lead to volatility, liquidity gaps, and systemic vulnerabilities.
For investors, understanding coverage patterns helps in identifying risks and opportunities. Markets with limited coverage may offer higher returns but require careful risk management. For policymakers, fostering balanced participation supports economic growth and financial stability.
Conclusion
Participants’ market coverage is the backbone of financial market functioning. It reflects how different actors engage across assets, regions, and time horizons, shaping liquidity, efficiency, and resilience. A well-covered market benefits from diverse participation, robust information flow, and effective intermediation. As markets evolve through globalization and technology, understanding and adapting to changing coverage dynamics remains essential for all stakeholders in the financial ecosystem.
Forexspecs

Competitive Devaluation: The New Currency War Introduction
Competitive devaluation has re-emerged as a powerful and controversial tool in the modern global economy. In a world marked by slowing growth, geopolitical fragmentation, rising debt, and persistent trade imbalances, countries increasingly look toward their exchange rates as a lever to protect domestic interests. Competitive devaluation refers to a situation where countries deliberately weaken their currencies to gain an advantage in international trade, stimulate exports, attract foreign investment, and support domestic growth. While it may provide short-term relief, it often triggers retaliation, financial instability, and long-term structural risks. In today’s interconnected financial system, competitive devaluation is no longer an isolated policy choice—it is part of a broader, ongoing currency war.
Understanding Competitive Devaluation
At its core, competitive devaluation is about making a nation’s goods and services cheaper on the global market by reducing the value of its currency. When a currency depreciates, exports become more attractive to foreign buyers, while imports become more expensive for domestic consumers. Governments and central banks can influence devaluation through interest rate cuts, quantitative easing, foreign exchange interventions, capital controls, or fiscal expansion.
Unlike market-driven depreciation caused by economic fundamentals, competitive devaluation is intentional and strategic. It is often pursued during periods of weak global demand, when countries struggle to grow through productivity or innovation alone.
Why Competitive Devaluation Is Prominent Now
The current global environment has made competitive devaluation more appealing and more frequent:
Slowing Global Growth
As major economies face stagnation or low growth, traditional policy tools lose effectiveness. Currency depreciation becomes a shortcut to stimulate demand.
High Debt Levels
Inflation and currency weakness reduce the real value of debt, making devaluation attractive for highly indebted governments.
Fragmented Global Trade
De-globalization, sanctions, and supply chain realignment have increased trade competition, pushing nations to protect export competitiveness.
Diverging Monetary Policies
Differences in interest rate paths between countries create sharp currency movements, often interpreted as deliberate devaluation even when policy goals differ.
Geopolitical Tensions
Economic warfare increasingly complements military and diplomatic strategies, with currencies becoming tools of influence.
Mechanisms of Competitive Devaluation
Countries employ several mechanisms to weaken their currencies:
Interest Rate Reductions: Lower rates reduce capital inflows and weaken currency demand.
Quantitative Easing: Injecting liquidity increases money supply, putting downward pressure on the currency.
Direct FX Intervention: Central banks sell their own currency in foreign exchange markets.
Capital Controls: Restricting inflows or encouraging outflows limits currency appreciation.
Fiscal Expansion: Large deficits can undermine investor confidence and weaken exchange rates.
Often, these tools are framed as domestic stabilization policies, even when their external impact is clear.
Short-Term Benefits of Competitive Devaluation
Competitive devaluation can deliver immediate advantages:
Boost to Exports: Domestic producers gain price competitiveness abroad.
Improved Trade Balance: Reduced imports and increased exports can narrow deficits.
Economic Stimulus: Export-led growth supports employment and industrial output.
Asset Market Support: Weaker currency often lifts equity markets through higher earnings translations.
Debt Relief: Inflationary effects reduce real debt burdens.
These benefits explain why competitive devaluation remains politically attractive, especially during economic downturns.
The Hidden Costs and Risks
Despite its appeal, competitive devaluation carries significant risks:
Retaliation and Currency Wars
When one country devalues, others respond, neutralizing the original advantage and escalating tensions.
Imported Inflation
Higher import prices raise inflation, eroding purchasing power and hurting consumers.
Capital Flight
Persistent devaluation undermines investor confidence, leading to outflows and financial instability.
Erosion of Monetary Credibility
Markets may lose faith in central bank independence and long-term policy discipline.
Misallocation of Resources
Artificial competitiveness discourages productivity improvements and structural reforms.
In the long run, no country gains if all currencies weaken simultaneously.
Competitive Devaluation in Emerging vs. Developed Economies
The impact differs across economies:
Emerging Markets face higher risks of capital outflows, debt stress (especially if debt is dollar-denominated), and inflation shocks.
Developed Economies often have more policy credibility and reserve currency status, allowing prolonged monetary easing without immediate crises.
However, even advanced economies are not immune, as persistent currency weakness can distort global capital flows and asset valuations.
Role of the US Dollar and Global Imbalances
The dominance of the US dollar complicates competitive devaluation. Many countries manage their currencies relative to the dollar, making US monetary policy a global anchor. When the dollar strengthens, others face pressure to devalue to maintain competitiveness. Conversely, when the dollar weakens, it can export inflation worldwide.
This asymmetry fuels global imbalances and reinforces the cycle of competitive devaluation, especially among export-driven economies.
Competitive Devaluation vs. Structural Competitiveness
A key criticism of competitive devaluation is that it substitutes currency manipulation for genuine economic reform. Sustainable competitiveness comes from productivity gains, innovation, infrastructure investment, education, and institutional strength—not from weaker currencies alone.
Countries relying too heavily on devaluation risk falling into a trap of low productivity, high inflation, and volatile capital flows.
Future Outlook: Is Competitive Devaluation Sustainable?
Competitive devaluation is likely to persist in the near term as global uncertainty remains high. However, its effectiveness will diminish as more countries adopt similar strategies. Over time, coordinated frameworks, regional trade arrangements, and currency diversification may limit its scope.
The future global system may shift toward:
Greater use of bilateral trade settlements
Reduced reliance on single reserve currencies
Increased scrutiny of currency practices by international institutions
Yet without genuine global coordination, competitive devaluation will remain a recurring feature of economic crises.
Conclusion
Competitive devaluation is once again at the center of global economic strategy, reflecting deep structural stresses in the world economy. While it offers short-term relief and political appeal, it carries long-term costs that can undermine stability, trust, and growth. In the end, currency weakness cannot replace real economic strength. Nations that balance exchange rate flexibility with structural reform, policy credibility, and international cooperation will be best positioned to navigate the evolving currency landscape.

The Interplay of Investors, Traders, and Policymakers1. The Global Trading Ecosystem: An Overview
Global trading encompasses equity markets, bond markets, commodities, currencies (forex), derivatives, and alternative assets such as cryptocurrencies. These markets operate across multiple time zones, making trading a 24-hour phenomenon. Capital flows seamlessly from one region to another in search of returns, safety, or diversification. This fluid movement is driven by information—economic data, corporate earnings, geopolitical events, and policy decisions—which is instantly reflected in asset prices.
Within this ecosystem, investors provide long-term capital, traders ensure liquidity and efficient pricing, and policymakers establish the rules of the game. The balance among these participants determines market confidence, volatility, and sustainability.
2. Investors: Long-Term Capital and Value Creation
Investors are the cornerstone of global trading. They typically operate with a medium- to long-term horizon, aiming to grow wealth through appreciation, income, or both. Institutional investors such as pension funds, mutual funds, insurance companies, sovereign wealth funds, and endowments dominate global capital flows. Retail investors, though smaller individually, collectively have a significant impact, especially with the rise of online platforms.
Investors focus on fundamentals—economic growth, corporate profitability, balance sheets, governance, and long-term trends such as demographics, technology, and climate transition. Their decisions determine where capital is allocated globally: emerging markets versus developed economies, equities versus bonds, or traditional industries versus new-age sectors.
In global trading, investors also play a stabilizing role. By holding assets through market cycles, they help dampen excessive volatility. Long-term investments in infrastructure, manufacturing, and innovation contribute to economic development and employment. However, shifts in investor sentiment—such as risk-on or risk-off behavior—can trigger massive cross-border capital movements, impacting currencies, interest rates, and asset prices worldwide.
3. Traders: Liquidity, Price Discovery, and Market Efficiency
Traders operate on shorter time horizons compared to investors. They range from intraday and swing traders to high-frequency trading (HFT) firms and proprietary desks at global banks. Traders focus on price action, liquidity, volatility, and market psychology rather than long-term fundamentals.
Their primary contribution to global trading is liquidity. By continuously buying and selling, traders ensure that markets remain active and that investors can enter or exit positions efficiently. This liquidity is crucial for accurate price discovery, allowing asset prices to reflect real-time information.
In modern global markets, technology plays a dominant role. Algorithmic and quantitative trading strategies analyze massive datasets in milliseconds, exploiting small price inefficiencies across geographies and asset classes. While this enhances efficiency, it can also amplify short-term volatility, especially during periods of stress.
Traders are highly sensitive to macroeconomic data releases, central bank announcements, geopolitical developments, and unexpected news. Their rapid reactions often cause sharp intraday movements, which can later be assessed and absorbed by longer-term investors.
4. Policymakers: Regulation, Stability, and Economic Direction
Policymakers—governments, central banks, and regulatory authorities—set the framework within which global trading operates. Their decisions influence interest rates, inflation, currency values, capital flows, and investor confidence.
Central banks play a particularly critical role. Through monetary policy tools such as interest rates, open market operations, and liquidity measures, they directly affect asset prices and risk appetite. For example, accommodative monetary policy tends to support equities and risk assets, while tightening cycles often strengthen currencies and pressure valuations.
Fiscal policymakers influence markets through taxation, public spending, subsidies, and trade policies. Infrastructure spending can boost equities and commodities, while protectionist measures may disrupt global supply chains and increase market uncertainty.
Regulatory bodies ensure market integrity by enforcing transparency, preventing fraud, managing systemic risk, and protecting investors. Well-designed regulation fosters confidence and long-term participation, while excessive or unpredictable regulation can deter capital and reduce market efficiency.
5. Interaction Between Investors, Traders, and Policymakers
The global trading environment is shaped by the continuous interaction among these three groups. Policymaker actions influence investor expectations and trader behavior. Traders interpret policy signals instantly, often driving short-term price movements. Investors then reassess long-term implications and adjust portfolios accordingly.
For example, a central bank’s indication of future rate cuts may trigger an immediate rally led by traders, followed by sustained inflows from investors reallocating capital toward growth assets. Conversely, unexpected policy tightening can cause sharp sell-offs, currency appreciation, and capital outflows from riskier markets.
This interaction is not one-way. Market reactions also influence policymakers. Severe volatility, financial instability, or market crashes may prompt intervention through liquidity support, regulatory changes, or fiscal stimulus. Thus, global trading is a dynamic feedback loop rather than a static system.
6. Globalization, Geopolitics, and Cross-Border Complexity
Global trading does not occur in isolation from political and geopolitical realities. Trade wars, sanctions, military conflicts, and diplomatic shifts can significantly alter capital flows and market structures. Investors reassess country risk, traders exploit volatility, and policymakers respond with strategic measures.
Emerging markets are particularly sensitive to global capital flows driven by developed-market monetary policy. Changes in interest rates in major economies can influence currencies, bond yields, and equity markets worldwide, highlighting the asymmetry of global financial power.
7. Technology and the Future of Global Trading
Advancements in technology continue to reshape global trading. Artificial intelligence, machine learning, blockchain, and digital assets are transforming how markets operate. Retail participation has expanded due to easy access to information and low-cost trading platforms, blurring the line between investors and traders.
Policymakers face new challenges in regulating digital markets, managing systemic risks, and ensuring fair access while fostering innovation. The balance between efficiency, stability, and inclusivity will define the next phase of global trading.
8. Conclusion
Global trading is a complex, interconnected system driven by the collective actions of investors, traders, and policymakers. Investors provide long-term capital and stability, traders ensure liquidity and efficient pricing, and policymakers set the economic and regulatory framework. Their interaction determines market direction, volatility, and resilience.
In an increasingly globalized and technologically advanced world, understanding this interplay is crucial for navigating financial markets effectively. As economic power shifts, new asset classes emerge, and policy challenges grow, the role of global trading will remain central to shaping economic outcomes and wealth creation across the world.

Global Economic Indicators & Macro Data Trading1. Understanding Global Economic Indicators
Economic indicators are statistical measures that reflect the overall health and direction of an economy. They are broadly categorized into leading, coincident, and lagging indicators.
Leading indicators signal future economic activity. Examples include Purchasing Managers’ Index (PMI), consumer confidence, building permits, and yield curves.
Coincident indicators move in line with the economy, such as GDP growth, industrial production, and employment levels.
Lagging indicators confirm trends after they occur, including unemployment rate, corporate profits, and inflation persistence.
Macro traders prioritize leading and coincident indicators because markets are forward-looking and tend to price expectations rather than past data.
2. Key Global Macro Indicators
a) Gross Domestic Product (GDP)
GDP measures the total value of goods and services produced in an economy. Strong GDP growth generally supports equity markets, strengthens the domestic currency, and raises interest rate expectations. Weak or contracting GDP signals economic slowdown, often boosting bonds and safe-haven assets like gold.
Traders focus not only on headline GDP but also on its composition—consumption, investment, government spending, and net exports—to assess sustainability.
b) Inflation Indicators
Inflation data such as Consumer Price Index (CPI), Producer Price Index (PPI), and Core Inflation are among the most market-moving indicators globally. Inflation directly influences central bank policy.
Rising inflation tends to push interest rates higher, strengthening currencies and pressuring equities.
Falling inflation or deflation expectations support bonds and growth stocks.
Macro traders closely analyze month-on-month trends, base effects, and inflation expectations embedded in bond markets.
c) Employment Data
Employment indicators like Non-Farm Payrolls (NFP), unemployment rate, labor force participation, and wage growth reflect economic momentum and consumer strength.
Strong job growth supports equities but may trigger tighter monetary policy. Weak employment data raises recession fears, benefiting bonds and defensive sectors.
3. Central Bank and Monetary Policy Data
Central banks are the most powerful drivers of macro markets. Interest rate decisions, policy statements, meeting minutes, and forward guidance significantly impact asset prices.
Interest Rates: Higher rates strengthen currencies and hurt interest-sensitive sectors.
Quantitative Easing (QE) / Tightening (QT): Liquidity injections support risk assets, while liquidity withdrawal increases volatility.
Forward Guidance: Markets often move more on what central banks say about the future than on the actual rate decision.
Macro data trading heavily revolves around predicting central bank responses to inflation and growth indicators.
4. Bond Yields and Yield Curves
Government bond yields reflect growth and inflation expectations. The yield curve—difference between short-term and long-term yields—is a crucial macro signal.
Normal curve: Indicates healthy growth expectations.
Inverted curve: Often precedes recessions and equity market corrections.
Traders monitor U.S. Treasury yields, German Bunds, and Japanese Government Bonds as global benchmarks influencing capital allocation.
5. Currency and Balance of Payments Data
Currencies respond strongly to macro data. Key indicators include:
Trade balance and current account data
Capital flows and foreign investment
Interest rate differentials
A strong economic outlook and higher interest rates attract foreign capital, strengthening the currency. Macro traders use economic data to build currency pair strategies, especially in USD, EUR, JPY, GBP, and emerging market currencies.
6. Commodity and Global Demand Indicators
Commodities are highly sensitive to macro data. Industrial metals like copper reflect global growth, while oil responds to economic activity and geopolitical factors. Agricultural commodities react to weather, supply chains, and demand trends.
China’s GDP, PMI, and industrial data are especially important, as China is a major consumer of global commodities. Macro traders often use commodity prices as leading indicators of inflation and economic cycles.
7. Geopolitical and Global Risk Indicators
Macro trading is not limited to economic numbers alone. Geopolitical events, trade policies, sanctions, wars, and global health crises significantly influence markets.
Risk indicators such as:
Volatility indices (VIX)
Credit spreads
Emerging market bond spreads
help traders assess global risk sentiment. During risk-off periods, capital typically flows into safe havens like the U.S. dollar, government bonds, gold, and defensive equities.
8. Macro Data Trading Strategies
a) Event-Driven Trading
Traders position ahead of major data releases like CPI, GDP, or central bank meetings. High-frequency and institutional traders exploit short-term volatility around announcements.
b) Trend and Cycle Trading
Macro traders align positions with economic cycles—growth, slowdown, recession, and recovery—allocating capital accordingly across asset classes.
c) Relative Value and Spread Trades
Comparing macro data between countries allows traders to take relative positions, such as long one currency and short another, based on growth and rate differentials.
d) Asset Allocation Shifts
Long-term investors use macro indicators to rebalance portfolios between equities, bonds, commodities, and cash as economic conditions evolve.
9. Challenges in Macro Data Trading
Macro trading is complex and probabilistic. Key challenges include:
Data revisions that change economic narratives
Market expectations already priced in before data release
Conflicting indicators sending mixed signals
Central bank intervention distorting natural market responses
Successful macro traders focus on expectations vs. actual data, not just whether numbers are good or bad.
10. Importance of Context and Risk Management
Macro data does not operate in isolation. Inflation data during a recession has a different impact than inflation during an expansion. Similarly, strong GDP growth may be negative for markets if it leads to aggressive rate hikes.
Risk management is critical due to high volatility around macro events. Position sizing, diversification, and scenario analysis are essential tools for macro traders.
Conclusion
Global economic indicators and macro data trading form the foundation of modern financial markets. From GDP and inflation to employment, central bank policy, and geopolitical risk, macro data shapes investor behavior across asset classes. Markets are forward-looking and driven by expectations, making interpretation and context more important than raw numbers. Successful macro traders combine economic analysis, market psychology, and disciplined risk management to navigate cycles, volatility, and uncertainty. In a world where global events instantly transmit across markets, mastering macro indicators is no longer optional—it is essential for sustainable trading and investment success.
Inflation, Deflation & Cost-Push Pressures1. Inflation: Meaning, Causes, and Effects
Inflation refers to a sustained increase in the general price level of goods and services over time. When inflation occurs, each unit of currency buys fewer goods and services, leading to a decline in purchasing power. Moderate inflation is often considered a sign of a healthy, growing economy, but excessive inflation can destabilize economic systems.
Types of Inflation
Demand-Pull Inflation
This occurs when aggregate demand exceeds aggregate supply. Strong consumer spending, increased government expenditure, or rapid credit growth can push prices upward.
Cost-Push Inflation
Prices rise because production costs increase, forcing firms to pass those costs onto consumers. This is discussed in detail later.
Built-in (Wage-Price) Inflation
Higher wages increase production costs, which raise prices. Rising prices then lead workers to demand higher wages, creating a self-reinforcing cycle.
Effects of Inflation
Positive Effects (when moderate):
Encourages spending and investment rather than hoarding cash.
Reduces the real burden of debt.
Signals growing economic activity.
Negative Effects (when high or unpredictable):
Erodes savings and fixed incomes.
Increases uncertainty for businesses and investors.
Distorts price signals and resource allocation.
Can lead to social unrest and inequality.
Central banks typically aim for low and stable inflation (around 2%) to balance growth and price stability.
2. Deflation: Meaning, Causes, and Effects
Deflation is a sustained decrease in the general price level of goods and services. While falling prices may appear beneficial to consumers initially, deflation is often associated with economic weakness and can lead to prolonged recessions.
Causes of Deflation
Weak Aggregate Demand
Reduced consumer spending, declining investment, or fiscal austerity can push prices down.
Excess Supply
Overcapacity in industries or technological advancements can lower production costs faster than demand grows.
Tight Monetary Conditions
Reduced money supply or restricted credit availability can suppress spending.
Debt Deflation
High debt levels force consumers and businesses to cut spending to repay loans, further depressing prices.
Effects of Deflation
Delayed Consumption: Consumers postpone purchases expecting lower prices.
Rising Real Debt Burden: Debt becomes harder to repay as incomes fall.
Lower Business Profits: Falling prices reduce revenues, discouraging investment.
Higher Unemployment: Companies cut costs by reducing wages or jobs.
Deflation can create a deflationary spiral, where falling prices lead to lower demand, lower incomes, and further price declines. This is why central banks aggressively counter deflation using monetary stimulus.
3. Cost-Push Pressures: Definition and Key Drivers
Cost-push pressures refer to rising input costs that force producers to increase prices to maintain profit margins. Unlike demand-driven inflation, cost-push inflation originates from the supply side of the economy.
Major Sources of Cost-Push Pressures
Rising Commodity Prices
Increases in oil, gas, metals, or agricultural prices raise transportation, energy, and raw material costs.
Wage Increases
Labor shortages, minimum wage hikes, or strong union bargaining can raise wage costs, especially in labor-intensive industries.
Supply Chain Disruptions
Geopolitical conflicts, pandemics, trade restrictions, or logistical bottlenecks can increase production and delivery costs.
Currency Depreciation
A weaker currency makes imports more expensive, raising costs for businesses dependent on foreign inputs.
Higher Taxes and Regulations
Increased corporate taxes, environmental regulations, or compliance costs can be passed on to consumers.
4. Relationship Between Inflation, Deflation, and Cost-Push Pressures
Cost-push pressures are a specific cause of inflation, but they do not always lead to sustained inflation. Their impact depends on demand conditions and policy responses.
If demand is strong, firms can easily pass higher costs to consumers, resulting in inflation.
If demand is weak, firms may absorb higher costs through lower profit margins, potentially slowing growth or triggering layoffs.
Persistent cost-push pressures combined with weak growth can lead to stagflation—a situation of high inflation and low economic growth.
In contrast, deflation usually reflects insufficient demand, excess capacity, or financial stress rather than rising costs. However, aggressive attempts to fight deflation through stimulus can, if mismanaged, later contribute to inflationary pressures.
5. Role of Central Banks and Governments
Policymakers play a critical role in managing inflation, deflation, and cost-push pressures.
Monetary Policy
To control inflation: Central banks raise interest rates, reduce liquidity, and tighten credit.
To fight deflation: They cut interest rates, inject liquidity, and encourage borrowing and spending.
Fiscal Policy
Governments can use subsidies, tax cuts, or public spending to offset cost pressures or stimulate demand.
Structural reforms and supply-side investments help reduce long-term cost-push risks.
Effective coordination between monetary and fiscal policy is essential to maintain price stability without harming growth.
6. Implications for Businesses, Investors, and Consumers
Businesses must manage input costs, pricing strategies, and supply chains to protect margins.
Investors adjust portfolios based on inflation expectations, favoring real assets during inflation and defensive assets during deflation.
Consumers face changing purchasing power, borrowing costs, and savings returns depending on price trends.
Understanding these dynamics allows economic participants to make informed decisions under varying macroeconomic conditions.
Conclusion
Inflation, deflation, and cost-push pressures are interconnected forces that shape the economic environment. Inflation reflects rising prices and reduced purchasing power, deflation signals declining demand and economic stress, and cost-push pressures highlight the role of rising production costs in driving price changes. While moderate inflation is often desirable, extreme inflation or deflation can severely damage economic stability. Effective policy management, resilient supply chains, and balanced demand-supply conditions are essential to maintain price stability and sustainable economic growth.

Global Market Volatility: Causes, Patterns, and Implications Understanding Market Volatility
At its core, volatility measures uncertainty. When markets are stable and predictable, price movements are relatively small. However, during periods of heightened uncertainty, prices can swing sharply in either direction. Volatility is not inherently negative; it can create opportunities for traders and signal necessary corrections in overvalued markets. Nevertheless, excessive or prolonged volatility can damage investor confidence, disrupt capital flows, and slow economic growth.
Volatility is often measured using indicators such as the VIX (Volatility Index) in equity markets, bond yield spreads, currency fluctuations, and commodity price swings. While these indicators may differ by asset class, they all reflect the same underlying force: uncertainty about the future.
Key Drivers of Worldwide Market Volatility
1. Macroeconomic Factors
Global markets are highly sensitive to macroeconomic data such as inflation rates, interest rates, GDP growth, employment figures, and trade balances. Central bank policies—especially those of major institutions like the US Federal Reserve, European Central Bank, and Bank of Japan—play a critical role. Interest rate hikes or cuts can trigger rapid adjustments in global capital flows, affecting equities, bonds, and currencies worldwide.
2. Geopolitical Tensions and Conflicts
Wars, regional conflicts, trade disputes, and diplomatic tensions often cause sudden spikes in market volatility. Events such as military conflicts, sanctions, or changes in trade policies can disrupt supply chains, impact energy and commodity prices, and increase risk aversion among investors. In an interconnected world, even localized geopolitical events can have global financial repercussions.
3. Financial Crises and Systemic Risks
Banking crises, sovereign debt defaults, or liquidity shortages can rapidly spread volatility across borders. The global financial crisis of 2008 demonstrated how weaknesses in one country’s financial system can cascade into a worldwide market shock. Similarly, concerns about systemic risk in major economies continue to influence global investor sentiment.
4. Technological and Structural Changes
Algorithmic trading, high-frequency trading, and the rise of digital platforms have increased the speed at which information is processed and trades are executed. While technology improves market efficiency, it can also intensify short-term volatility, as automated systems react simultaneously to news or price movements. Additionally, the growth of global retail participation through online platforms has added new behavioral dynamics to markets.
5. Commodity and Energy Price Fluctuations
Global commodity markets—particularly oil, natural gas, metals, and agricultural products—are major sources of volatility. Supply disruptions, demand shocks, weather events, and policy decisions by producing nations can cause sharp price movements. Since commodities are essential inputs for many economies, their volatility often spills over into equity markets, inflation expectations, and currency values.
Regional Dimensions of Global Volatility
Market volatility does not affect all regions equally. Developed markets often experience volatility linked to monetary policy shifts, financial cycles, and valuation concerns. Emerging markets, on the other hand, tend to be more vulnerable to external shocks such as capital outflows, currency depreciation, and changes in global risk appetite. When investors become risk-averse, they often withdraw funds from emerging economies, increasing volatility in those markets.
At the same time, regional diversification can sometimes cushion global volatility. For example, economic growth in one region may offset weakness in another, reducing the overall impact on global portfolios.
Impact on Investors and Businesses
For investors, global market volatility presents both risk and opportunity. Long-term investors may view volatility as a chance to accumulate quality assets at lower prices, while short-term traders may seek to profit from rapid price movements. However, unmanaged volatility can lead to emotional decision-making, excessive trading, and portfolio losses.
Businesses are also affected by volatility through changes in financing costs, currency exchange rates, and input prices. High volatility can delay investment decisions, reduce corporate earnings visibility, and increase hedging costs. Multinational corporations, in particular, must actively manage exposure to multiple markets and currencies.
Role of Policy and Regulation
Governments and regulators play a crucial role in managing and responding to market volatility. Transparent communication from central banks, prudent fiscal policies, and strong financial regulation can help stabilize markets during turbulent periods. While policymakers cannot eliminate volatility, they can reduce its systemic impact and prevent localized shocks from becoming global crises.
Long-Term Perspective on Volatility
From a historical standpoint, market volatility tends to move in cycles. Periods of calm are often followed by phases of turbulence, and vice versa. Over the long run, global markets have demonstrated resilience, adapting to shocks and continuing to grow despite repeated episodes of volatility. Understanding this cyclical nature helps investors and policymakers maintain perspective and avoid overreacting to short-term fluctuations.
Conclusion
Worldwide market volatility is an unavoidable consequence of a complex, interconnected global financial system. Driven by economic forces, geopolitical events, technological change, and investor behavior, volatility reflects both risk and opportunity. While it can pose challenges for investors, businesses, and governments, it also plays a vital role in price discovery and market efficiency. By understanding its causes, impacts, and long-term patterns, market participants can better navigate uncertainty, manage risk, and make informed decisions in an ever-changing global financial landscape.

Carry Trade Profits in the Global Market1. Fundamentals of Carry Trade
The carry trade is essentially a form of arbitrage. Traders exploit the differences in interest rates between countries to generate profit. Typically, investors borrow money in a currency considered “cheap” — usually from countries with low-interest rates like the Japanese yen (JPY) or the Swiss franc (CHF) — and convert it into a currency with higher interest rates, such as the Australian dollar (AUD), New Zealand dollar (NZD), or emerging market currencies like the Brazilian real (BRL) or Turkish lira (TRY).
The profitability of carry trades comes in two forms:
Interest Rate Differential (Carry): The primary profit is derived from the interest rate spread between the funding currency and the target currency. For instance, if an investor borrows 1 million JPY at an interest rate of 0.1% and invests in AUD at 5%, the net interest profit before costs is substantial, particularly on leveraged positions.
Currency Appreciation: In addition to the interest rate differential, carry trade profits can be enhanced if the higher-yielding currency appreciates against the funding currency. This combination of yield and potential capital gains makes carry trade highly attractive during periods of global economic stability and low volatility.
2. Mechanics of the Carry Trade
Carry trades are typically executed through foreign exchange (FX) markets. The process involves:
Funding Position: Borrowing a currency with low-interest rates, often through short-term instruments like FX swaps, forward contracts, or interbank loans.
Investment Position: Converting the borrowed funds into a higher-yielding currency and investing in instruments such as government bonds, corporate bonds, or high-interest savings accounts denominated in that currency.
Leverage Utilization: Many carry trades employ leverage to magnify returns. Borrowing multiple times the invested capital can substantially increase profits, though it also escalates risk.
The net profit is calculated as the difference between the earned interest and the cost of borrowing, adjusted for currency fluctuations and transaction costs.
3. Historical Context and Global Examples
Historically, carry trades gained prominence in the late 20th and early 21st centuries when global financial markets became increasingly integrated. The Japanese yen became the quintessential funding currency due to Japan’s long-standing low-interest-rate policies. For example, in the early 2000s, investors borrowed cheap yen to invest in Australian and New Zealand assets, reaping significant profits from both interest rate differentials and currency appreciation.
Emerging market currencies have also been frequent targets for carry trades. High yields in countries like Brazil, Mexico, and South Africa attracted global capital inflows, driving short-term currency strength. Similarly, during periods of monetary easing in developed economies, the differential widened, boosting carry trade attractiveness.
4. Profitability Drivers
Several factors determine carry trade profitability:
Interest Rate Differentials: Larger differentials increase potential returns. Central bank policies directly impact these spreads. For example, aggressive rate hikes in emerging markets can widen the gap with developed markets’ low rates, fueling carry trade activity.
Currency Stability: Stable currencies reduce the risk of adverse exchange rate movements, making the strategy more predictable.
Global Liquidity: Ample liquidity in global markets facilitates smooth execution of carry trades, lowering transaction costs.
Investor Sentiment and Risk Appetite: Carry trades tend to thrive in risk-on environments. Investors’ willingness to seek higher returns in emerging markets or higher-yield currencies directly influences profitability.
5. Risks Associated with Carry Trades
Despite their profitability, carry trades are inherently risky due to leverage and exposure to multiple market factors:
Currency Risk: A sudden depreciation of the target currency against the funding currency can quickly erase interest gains. For instance, if the Australian dollar falls against the yen, the initial investment converts back into fewer yen, causing losses.
Interest Rate Risk: Unexpected central bank decisions can reverse the interest rate advantage, reducing or eliminating carry trade profits.
Market Volatility: Financial crises or geopolitical events can trigger rapid unwinding of carry trades, leading to sharp losses. The 2008 global financial crisis exemplified this, as leveraged carry trades collapsed, causing massive currency swings.
Liquidity Risk: In times of market stress, exiting positions can be costly due to reduced liquidity, amplifying losses.
Professional traders mitigate these risks through hedging strategies, stop-loss orders, and diversification across multiple currency pairs and maturities.
6. Modern Developments in Carry Trades
In recent years, the carry trade landscape has evolved due to changes in monetary policy, technological advancements, and global market dynamics:
Low-Interest Rate Environment: Prolonged low rates in developed economies have compressed traditional interest rate differentials, reducing carry trade opportunities.
Algorithmic Trading: Automated strategies and algorithmic trading systems now dominate carry trade execution, improving efficiency but also increasing susceptibility to rapid market corrections.
Emerging Market Volatility: While high-yield currencies remain attractive, political instability and economic shocks introduce heightened risk, demanding more sophisticated risk management.
Diversification Across Asset Classes: Modern carry trades often integrate multi-asset approaches, including bonds, equities, and commodities, to enhance returns while mitigating currency risk.
7. Global Implications of Carry Trade Activity
Carry trades influence global financial markets beyond individual investor profits. Large-scale capital flows can impact exchange rates, interest rates, and liquidity conditions in emerging and developed markets alike. For example, heavy inflows into a high-yield currency can appreciate it significantly, affecting export competitiveness. Similarly, sudden unwinding of carry trades can trigger “flash crashes” in currency markets, as seen during past financial crises.
Central banks monitor carry trade activity carefully, as massive leveraged positions can exacerbate financial instability. This interplay between market participants and monetary authorities makes carry trade both a source of profit and a systemic consideration.
8. Conclusion
Carry trade profits in the global market emerge from exploiting interest rate differentials and potential currency appreciation. While historically lucrative, the strategy carries substantial risks, particularly during periods of economic uncertainty or market volatility. Successful carry trading requires a combination of careful analysis, risk management, and timely execution, often leveraging modern financial technologies.
Despite challenges, carry trades remain a vital component of the global financial landscape, influencing capital flows, currency valuations, and investment strategies worldwide. As central banks adjust monetary policies and global markets continue to integrate, carry trades will evolve, offering opportunities and risks that reflect the ever-changing dynamics of the global economy. Investors who understand these mechanisms and manage risks effectively can continue to profit from carry trades while navigating the complex landscape of international finance.
China vs USA Trade War1. Background: How the Conflict Began
For years, the United States accused China of unfair trade practices. These included:
Intellectual Property (IP) theft
Forced technology transfer from American companies operating in China
Currency manipulation
Heavy subsidies to Chinese industries
Large trade imbalance in China’s favor
By 2017, the US trade deficit with China approached hundreds of billions of dollars annually. The Trump administration viewed this as a direct threat to America’s manufacturing base and long-term economic power.
In 2018, the US imposed tariffs on billions of dollars worth of Chinese goods. China responded with tariffs of its own. This back-and-forth escalation became widely known as the US-China Trade War.
2. Root Causes of the Trade War
While tariffs were the visible actions, the conflict was driven by much deeper concerns.
a. Economic Competition
China’s rapid economic rise transformed it from a developing nation into a global manufacturing and technological power. Its “Made in China 2025” plan aimed to dominate high-tech sectors such as:
Artificial intelligence
Semiconductors
Robotics
Electric vehicles
Aerospace
The US perceived this ambition as a direct challenge to its global economic leadership.
b. Technology and Intellectual Property
For decades, US companies complained about IP violations in China. The US government argued China obtained American technologies through:
Cyber espionage
Forcing joint ventures
Requiring technology sharing as a condition to access the Chinese market
Technology became the core battleground, as both nations recognized that technological supremacy equals long-term geopolitical power.
c. Trade Deficit Concerns
America consistently imported more from China than it exported to China. This created:
Loss of manufacturing jobs in the US
Political pressure to reduce dependence on Chinese goods
d. Geopolitical Competition
The trade war symbolizes a deeper struggle:
The US trying to protect its status as the global superpower
China aiming to establish itself as an equal or dominant power
The conflict expanded beyond economics to include military competition, alliances, cybersecurity, and influence over global institutions.
3. Timeline of Key Trade War Events
2018: Initial Tariffs
The US imposed tariffs on steel and aluminum.
Additional tariffs targeted $50 billion worth of Chinese goods.
China retaliated with tariffs on soybeans, automobiles, and other US products.
2019: Escalation
The US placed tariffs on nearly all Chinese imports.
Tech giant Huawei was added to the US trade blacklist.
China imposed counter-tariffs on hundreds of American products.
2020: Phase One Deal
Both countries negotiated the Phase One trade deal, where China agreed to purchase more American goods and improve IP protections. However, many issues remained unresolved.
2021–2024: Strategic Decoupling
Even after changes in US political leadership, the approach to China remained firm. Both nations pursued:
Reduced dependence on each other
Supply chain diversification
Investment restrictions
Tech bans and sanctions
The trade war gradually evolved into a broader economic and technological cold war.
4. Economic Impact on the United States
The trade war had mixed results for the US.
a. Higher Costs for American Consumers
Tariffs increased prices of imported goods like:
Electronics
Clothing
Machinery
Household items
Studies showed that American consumers and companies bore much of the cost.
b. Impact on Farmers
China, a major buyer of American agricultural products, reduced imports of:
Soybeans
Pork
Corn
The US government provided subsidies to farmers to offset losses.
c. Boost to Local Manufacturing (Limited)
Some industries saw benefits:
Certain machinery production
Raw material processing
However, the shift was not enough to significantly restore large-scale manufacturing jobs.
d. Technology Restrictions
The US strengthened controls on sensitive technologies:
Semiconductors
AI tools
Advanced computing
This aimed to prevent China from gaining access to critical systems.
5. Economic Impact on China
China also faced challenges:
a. Slowed Economic Growth
Exports dropped, and domestic demand weakened during the peak of the trade war.
b. Pressure on Technology Sector
Blacklisting companies like Huawei limited China’s access to:
5G technologies
Advanced semiconductor chips
US software and hardware
c. Shift in Global Supply Chains
Many companies began moving supply chains from China to:
Vietnam
India
Indonesia
Mexico
China lost some manufacturing opportunities, though it still remained the world’s largest manufacturing hub.
d. Domestic Innovation Push
China increased investments in:
Chip manufacturing
AI development
Military technology
Renewable energy
The trade war accelerated China’s desire to become self-reliant in critical technologies.
6. Impact on Global Markets and Other Economies
The trade war had worldwide consequences.
a. Supply Chain Fragmentation
Global companies diversified production away from China to reduce risk. This led to:
“China +1” strategy adoption
New manufacturing bases in Asia and Latin America
b. Commodity Market Volatility
Prices of soybeans, oil, metals, and industrial commodities fluctuated due to uncertain trade flows.
c. Stock Market Instability
Trade war headlines created volatility in:
US stock indices (Dow, S&P 500, Nasdaq)
Asian stock markets
Emerging market currencies
d. Benefit to Alternative Producers
Nations like India, Vietnam, and Mexico gained foreign investments as companies sought alternatives to China.
7. Evolution into a Technology and Security War
By 2024, the conflict shifted beyond tariffs.
a. Semiconductor (Chip) War
The US restricted Chinese access to advanced chips. China heavily invested in chip manufacturing, creating a technological arms race.
b. 5G and Telecom Restrictions
Many countries banned Huawei equipment due to US pressure.
c. AI Race
Both nations compete to lead in:
AI research
Quantum computing
Autonomous systems
d. Military Technology
The trade war spilled into defense, cybersecurity, and space technology competition.
8. Current Phase: Strategic Rivalry Instead of Pure Trade War
The China–US conflict is now a long-term strategic rivalry featuring:
Diplomacy
Economic containment
Influence over developing nations
Technological decoupling
Both nations continue to trade with each other, but with restrictions and caution.
9. Conclusion
The China vs USA Trade War reflects a battle for dominance in global trade, technology, and geopolitics. What began as a tariff dispute has evolved into a broader economic cold war, influencing supply chains, global markets, and international alliances. While both countries suffered short-term economic pain, the long-term effects include realignments in global trade patterns and a race for technological self-reliance. The conflict is far from over; instead, it has reshaped how nations prepare for future economic and digital competition.

DXY Surges Explained1. What a DXY Surge Means
A surge in the DXY means the U.S. dollar is strengthening. This strengthening can come from:
Growing confidence in the U.S. economy
Rising U.S. interest rates
Investors seeking safety from global risks
Weakness in other major currencies
Changes in global trade flows
Shifts in central bank policies
When the DXY rises, it often signals that money around the world is flowing into the United States—either for safety, return on investment, or both.
2. Interest Rates: The Primary Driver of DXY Surges
The most influential factor behind a DXY surge is U.S. interest rates. The Federal Reserve has enormous influence on the dollar, as its decisions determine whether global investors find U.S. assets attractive.
Why Higher Rates Boost the Dollar
Higher rates increase the yield on U.S. Treasury bonds.
Investors around the world buy these bonds because they are considered safe and profitable.
To buy U.S. assets, investors must first convert their local currency to dollars.
This surge in demand strengthens the dollar and pushes the DXY upward.
Even expectations of future rate hikes can push the DXY higher. Traders often react not only to actual policy changes, but also to hints from the Federal Reserve.
3. Safe-Haven Demand During Uncertainty
The U.S. dollar is the world’s leading safe-haven asset. When global uncertainty rises—whether due to economic downturns, geopolitical tensions, war, or financial instability—investors flock to the dollar.
Examples of situations that cause safe-haven flows:
Global recessions
Banking crises
Declines in stock markets
Political instability in major economies
Currency crises in emerging markets
During such times, investors search for stability, and they often find it in U.S. Treasuries and other dollar-denominated assets. This buying pressure causes surges in the DXY.
4. Weakness in Other Currencies Helps Push the DXY Up
Because the DXY measures the dollar’s strength relative to other currencies, weakness in those currencies automatically pushes the index higher.
The Euro’s Role
The euro has the largest weight in the index—around 57%.
Therefore, when the euro weakens due to:
Slow European economic growth
Divergent interest rates
Political challenges
Energy crises
…the DXY often rises significantly.
The Japanese Yen Factor
The yen also plays a major role. When the Bank of Japan keeps interest rates low while the U.S. raises rates, investors shift funds into the dollar, causing the DXY to surge.
5. U.S. Economic Strength and Global Confidence
A strong U.S. economy typically results in a stronger dollar. Economic indicators that support a DXY surge include:
Higher GDP growth
Strong employment numbers
Rising consumer spending
Increasing business investment
Robust corporate earnings
These indicators attract global investors to U.S. assets such as stocks, bonds, and real estate. As foreign investors buy these assets, demand for dollars increases, pushing the DXY upward.
6. Global Trade and Dollar Demand
The U.S. dollar dominates international trade. Over 80% of global transactions, commodities, and trade settlements involve the dollar. This creates a structural, persistent demand for dollars.
Why global trade boosts the DXY:
Countries hold dollar reserves to pay for imports like oil, machinery, and technology.
Most global commodities—including gold, oil, and natural gas—are priced in dollars.
During periods of high commodity demand, nations often increase their dollar reserves.
All of this creates momentum for the DXY to strengthen when global trade dynamics shift.
7. Impact of DXY Surges on Global Markets
A. Impact on Commodities
When the dollar strengthens, commodities like oil, gold, silver, and metals generally become more expensive for buyers using other currencies. As a result, commodity prices often fall when the DXY surges.
B. Impact on Emerging Markets
DXY surges create challenges for emerging markets:
Their currencies weaken
Dollar-denominated debt becomes more expensive to repay
Foreign investment outflows increase
Import costs rise
Some nations experience financial stress during strong dollar periods.
C. Impact on U.S. Corporations
A stronger dollar can hurt U.S. exporters because their products become more expensive internationally. Companies such as technology firms, industrial manufacturers, and consumer goods exporters often feel the pressure of a rising DXY.
8. Market Psychology and Speculative Trading
Financial markets react not just to economic data, but also to sentiment and speculation. Traders in the forex market often accelerate moves in the DXY by:
Betting on future interest rate changes
Reacting to central bank statements
Anticipating geopolitical shifts
Speculating on currency volatility
When sentiment aligns strongly toward a stronger dollar, DXY surges can become sharp and rapid.
9. Are DXY Surges Long-Lasting or Short-Term?
DXY surges can be:
Short-term
Driven by market speculation, sudden news events, or temporary crises.
Long-term
Driven by structural trends such as:
Prolonged interest rate cycles
Shifting global trade patterns
Long-term weakness in other currencies
Robust U.S. economic outperformance
The duration of a surge depends on the underlying forces.
Conclusion
A DXY surge reflects a combination of economic strength, monetary policy decisions, global risk sentiment, and comparative currency performance. When the index rises, it signals confidence in the U.S. economy, but also can indicate stress in global markets. The effects are far-reaching: commodities tend to fall, emerging markets can struggle, and U.S. exporters may face headwinds. Yet for investors seeking safety and stable returns, a surging dollar is often a sign of global capital flowing into the United States.
Understanding why the DXY surges helps traders, policymakers, and investors navigate global markets with greater clarity and insight.
Shipping, Freight, and Logistics Trading1. Introduction to the Global Shipping and Freight Ecosystem
Shipping and freight represent the physical movement of goods, while logistics covers the planning, coordination, and management that make this movement possible. Together, they form a vast network involving shipping lines, freight forwarders, port operators, customs agents, brokers, and traders. Globalization has made this sector indispensable: 90% of world trade moves through the maritime shipping industry.
Shipping is dominated by large vessels—tankers, container ships, bulk carriers—that transport everything from crude oil and LNG to electronics and automobiles. Freight, meanwhile, includes all modes of transportation—sea, air, road, and rail—often combined in multimodal systems. Logistics integrates these modes into a seamless flow, ensuring timely delivery, cost efficiency, and compliance with regulations.
2. How Shipping and Freight Markets Work
Shipping markets operate on supply and demand. Freight rates rise and fall depending on global trade volumes, vessel availability, fuel prices, geopolitical stability, and port congestion. For example:
When China increases steel production, demand for iron ore shipping rises.
If crude oil prices surge, tanker rates typically move higher.
Geopolitical tensions affecting key routes (like the Suez Canal or Red Sea) can cause disruptions and spike spot freight rates.
Freight markets are divided into two broad categories:
a. Spot Market
This is where vessels are chartered for immediate use. Rates fluctuate daily based on market conditions. Spot trading is common in container shipping and bulk carriers.
b. Contract Market
Long-term contracts (time charters, voyage charters) offer stable pricing and predictable supply. Large corporations rely on these for consistent supply chain operations.
Traders, shipping companies, and brokers constantly analyze these markets to capture opportunities in freight rate movements.
3. Types of Freight: Sea, Air, Road, and Rail
1. Sea Freight
Sea freight is the most cost-effective method for bulk goods. There are three core vessel types:
Dry bulk carriers (coal, grain, iron ore)
Tankers (crude oil, petroleum products, LNG)
Container ships (consumer goods, electronics, machinery)
Shipping trading is most active in this segment due to volatile freight rates.
2. Air Freight
Air freight is used for high-value or time-sensitive goods. It is expensive but essential for pharmaceuticals, electronics, perishables, and emergency shipments.
3. Road Freight
Road transport handles last-mile delivery and short- to medium-distance cargo. Trucking markets also have spot and contract rates influenced by fuel prices and driver availability.
4. Rail Freight
Rail is efficient for heavy industrial cargo—coal, steel, fertilizer, and automobiles. It plays a vital role in countries with large landmass, such as India, China, and the U.S.
4. Logistics: The Strategic Framework Behind Freight
Logistics is the science and strategy behind moving goods. It includes:
Inventory management
Warehousing
Distribution planning
Route optimization
Customs clearance
Packaging
Order fulfillment
Supply chain visibility
Advanced logistics uses technology such as GPS tracking, IoT sensors, warehouse automation, robotics, drones, and AI-driven demand forecasting.
Companies like DHL, FedEx, Maersk Logistics, and UPS are leaders in global logistics, providing end-to-end supply chain solutions.
5. Freight and Shipping Trading Markets
Trading in shipping and freight occurs through:
a. Physical Freight Trading
Actual cargo shipments are bought and sold. Traders negotiate:
Freight rates
Vessel chartering
Cargo booking
Port handling
Physical traders manage logistics for commodities like oil, LNG, coal, metals, grains, and chemicals.
b. Forward Freight Agreements (FFAs)
FFAs are financial instruments used to hedge against future freight rate fluctuations. They cover routes such as:
Baltic Dry Index (BDI)
Capesize, Panamax, Supramax segments
Tanker routes (VLCC, Suezmax, Aframax)
FFAs allow traders, ship owners, and charterers to lock in future freight rates, reducing exposure to volatility. They are settled in cash based on index prices.
c. Container Freight Rate Trading
This segment has grown due to global supply chain disruptions. Indices like:
Freightos Baltic Index (FBX)
Shanghai Containerized Freight Index (SCFI)
allow companies to hedge container shipping costs.
d. Logistics Derivatives
Emerging financial products that allow hedging warehousing costs, trucking rates, and port congestion costs.
6. Key Drivers of Shipping, Freight, and Logistics Prices
1. Global Trade Cycles
Economic expansion increases cargo flows, while recessions reduce demand.
2. Fuel Prices
Bunker fuel costs heavily influence freight rates.
3. Capacity and Fleet Supply
An oversupply of vessels leads to low shipping rates; undercapacity pushes rates up.
4. Geopolitics
Conflicts near major routes (Red Sea, Strait of Hormuz, Taiwan Strait) disrupt shipping lanes.
5. Port Congestion
Delays in ports such as Shanghai, Los Angeles, or Rotterdam cause freight surges.
6. Weather and Natural Disasters
Monsoons, hurricanes, and cyclones affect shipping schedules and capacity.
7. Regulations
IMO emission rules increase operational costs, influencing freight rates.
7. Major Players in Shipping and Logistics Trading
Shipping Lines – Maersk, MSC, CMA CGM, Hapag-Lloyd
Freight Forwarders – DHL Global Forwarding, Kuehne + Nagel
Commodity Traders – Glencore, Trafigura, Vitol, Cargill
Port Operators – DP World, PSA International, Adani Ports
Brokerage Firms – Clarksons, Simpson Spence Young
Logistics Integrators – FedEx, UPS, Maersk Logistics
These players create an interconnected ecosystem facilitating global commerce.
8. How Traders Participate in This Market
Shipping and freight traders engage through:
a. Speculating on Freight Rates
Buying FFAs when expecting rates to rise or selling when expecting a fall.
b. Chartering Vessels
Traders take vessels on time charter and sub-charter them at higher spot rates.
c. Cargo Arbitrage
Buying commodities in cheaper markets and shipping them to higher-priced regions.
d. Operational Trading
Managing logistics for commodity trades to optimize cost and efficiency.
e. Hedging Freight Exposure
Manufacturers and exporters use freight derivatives to lock in shipment costs.
9. Future Trends in Shipping, Freight, and Logistics Trading
1. Digitalization and AI
AI-powered routing, predictive freight pricing, and automated documentation.
2. Green Shipping
Zero-emission fuels such as ammonia, hydrogen, LNG, and methanol will transform operating costs.
3. Blockchain for Documentation
Digital bills of lading reduce fraud and speed up transactions.
4. Autonomous Vessels and Drones
Expected to reduce manpower dependency and increase operational precision.
5. Supply Chain Resilience
Companies are shifting to multi-route strategies after disruptions like COVID-19 and geopolitical tensions.
Conclusion
Shipping, freight, and logistics trading form the circulatory system of the global economy. From physical movement of goods to financial trading of freight derivatives, this sector is essential to global trade, commodity markets, and economic stability. Understanding how freight rates work, how logistics integrates each stage of movement, and how traders participate in these markets provides a powerful foundation for anyone interested in global commerce or financial markets.
Types of Exotic OptionsIntroduction to Exotic Options
Exotic options are a class of financial derivatives that differ from standard "vanilla" options in terms of their structure, payoff, or underlying conditions. While vanilla options include basic calls and puts with straightforward exercise and payoff structures, exotic options introduce additional features, making them more flexible but also more complex. These options are commonly used for hedging, speculation, or structuring custom financial products to meet specific investor needs.
The term "exotic" broadly covers any option with characteristics that deviate from standard European or American options. Exotic options can be tailored to address particular market views, risk tolerances, or regulatory requirements. Their payoff structures often depend on multiple factors, such as the path of the underlying asset, multiple underlying assets, or the timing of exercise.
Exotic options are usually classified based on their payoff structure, underlying conditions, or exercise style. Let’s explore the most common types.
1. Barrier Options
Barrier options are options whose existence or payoff depends on whether the underlying asset reaches a specified price level, called the barrier, during the option’s life.
Knock-In Options: These options become active only if the underlying asset hits a predefined barrier price. If the barrier is never reached, the option expires worthless.
Example: Up-and-In Call – activates only if the asset rises above the barrier.
Knock-Out Options: These options cease to exist if the underlying asset hits the barrier. Knock-out options are often cheaper than standard options because the barrier introduces additional risk of early termination.
Example: Down-and-Out Put – becomes void if the asset falls below the barrier.
Barrier options are useful for hedging or speculative strategies when investors anticipate that the underlying asset will remain within a certain range or move to specific levels.
2. Asian Options
Asian options, also called average options, are options where the payoff depends on the average price of the underlying asset over a certain period rather than the price at maturity.
Average Price Options: The payoff is based on the difference between the average price of the underlying asset and the strike price.
Average Strike Options: The strike price itself is determined based on the average price of the underlying during the option’s life.
The averaging feature reduces the risk of market manipulation and extreme price fluctuations near maturity. Asian options are widely used in commodity markets, such as oil or metals, where prices can be volatile.
3. Lookback Options
Lookback options provide the holder with the advantage of “looking back” over the life of the option to determine the optimal payoff. The strike price is determined based on the maximum or minimum price of the underlying asset during the option’s life.
Lookback Call Option: Payoff is based on the difference between the underlying asset’s maximum price during the option’s life and the strike price.
Lookback Put Option: Payoff is based on the difference between the strike price and the minimum asset price during the option’s life.
Lookback options eliminate the risk of mistiming the market and are often used by investors with precise views on price movements but uncertain timing.
4. Digital (Binary) Options
Digital or binary options provide a fixed payoff if a certain condition is met at maturity and zero otherwise. The condition is usually the underlying asset crossing a predetermined level.
Cash-or-Nothing Option: Pays a fixed cash amount if the asset price meets the condition.
Asset-or-Nothing Option: Pays the value of the underlying asset if the condition is met.
These options are popular in speculative markets because of their simple, all-or-nothing payoff structure. However, they carry high risk and can be sensitive to even minor market fluctuations.
5. Compound Options
Compound options are options on options. Essentially, they give the holder the right to buy or sell another option at a predetermined price on or before a certain date.
Call on Call: Right to buy a call option.
Put on Call: Right to sell a call option.
Call on Put: Right to buy a put option.
Put on Put: Right to sell a put option.
Compound options are frequently used in corporate finance and project valuation, especially when there are multiple stages of investment decisions or sequential financing requirements.
6. Chooser Options
Chooser options allow the holder to choose whether the option will be a call or a put at a predetermined future date. This feature provides flexibility in uncertain markets when the direction of price movement is unclear.
Typically, the holder decides after observing market conditions partway through the option’s life.
Chooser options are more expensive than standard options due to the added flexibility.
They are useful for hedging uncertain exposures or for speculative purposes when market trends are ambiguous.
7. Rainbow Options
Rainbow options derive their value from two or more underlying assets. The payoff depends on the performance of multiple assets, which can be combined in different ways:
Best-of Options: Payoff is based on the best-performing underlying asset.
Worst-of Options: Payoff is based on the worst-performing underlying asset.
Rainbow options are often used in portfolio strategies or in situations where the correlation between assets can be exploited. For instance, they can hedge multi-asset portfolios or provide exposure to multiple currencies or commodities.
8. Exotic American Options
While standard American options can be exercised anytime before expiry, exotic American options combine this flexibility with other exotic features such as barriers, lookbacks, or multiple underlying assets.
They provide advanced hedging tools for sophisticated investors.
Example: A barrier American call can be exercised any time before expiration but is void if the underlying hits a certain level.
9. Cliquet (Ratchet) Options
Cliquet options, also known as ratchet options, feature periodic resets of the strike price. The payoff is based on the sum of gains over each reset period.
Often used in structured products to guarantee a minimum return while participating in market upside.
Popular in equity-linked notes or structured investment products that offer partial protection.
10. Exotic Options in Structured Products
Exotic options are frequently embedded in structured products, combining multiple features to achieve specific investor objectives:
Yield Enhancement Products: Use barrier options to generate higher income when markets remain stable.
Principal-Protected Notes: Combine options and bonds to protect the invested capital while offering exposure to market upside.
Convertible Structured Products: Include compound or chooser options to allow investors flexibility in timing or payoff.
These products highlight the practical applications of exotic options beyond pure speculation.
Conclusion
Exotic options provide a rich toolkit for investors and risk managers. Their complex structures allow customization of risk, payoff, and market exposure that cannot be achieved with standard options. However, they also come with higher pricing complexity, lower liquidity, and increased counterparty risk.
The most commonly used exotic options include barrier options, Asian options, lookback options, digital options, compound options, chooser options, rainbow options, and Cliquet options. Each type serves a unique purpose, whether for hedging, speculation, or creating structured investment products.
By understanding the characteristics and applications of these options, investors can design strategies that align precisely with market expectations, risk tolerance, and financial goals. Exotic options are not just theoretical constructs—they are widely used in professional trading, corporate finance, and risk management.
Understanding the Bond Market and Interest RatesThe Surge in the Bond Market
A surge in the bond market refers to a rapid increase in bond prices, often accompanied by declining yields. In recent times, this phenomenon has been influenced by several global and domestic factors:
Economic Uncertainty:
Investors often flock to bonds during periods of uncertainty, such as geopolitical tensions, stock market volatility, or concerns about slowing economic growth. Bonds are seen as safer assets compared to equities, leading to increased demand and a surge in prices.
Central Bank Policies:
Central banks, like the Federal Reserve in the U.S., play a pivotal role in the bond market. When central banks signal interest rate cuts or maintain accommodative monetary policies, bond prices tend to rise as yields drop. Conversely, rate hikes can cause temporary volatility but sometimes lead to surges in certain segments of the market if investors anticipate slower economic growth.
Inflation Expectations:
Inflation erodes the real return on bonds. When markets believe inflation will remain contained or decline, long-term bonds become more attractive, pushing up prices. A surge often occurs when inflation indicators show signs of moderation.
Global Capital Flows:
Cross-border investment flows into safer bond markets can drive a surge. For example, if global equities are under pressure, international investors often seek bonds from stable economies, raising demand and prices.
The Interest Rate Battle
The "interest rate battle" refers to the ongoing struggle between central banks’ monetary policy objectives and market expectations. Central banks manipulate interest rates to balance economic growth, inflation, and employment. Their decisions significantly influence bond market dynamics:
Rate Hikes and Tightening:
Central banks may increase interest rates to control inflation. Higher rates make borrowing more expensive, slowing economic activity. In the bond market, rate hikes lead to falling prices for existing bonds because new issues offer better yields. However, aggressive hikes can sometimes trigger a flight to quality in government bonds if equity markets react sharply, creating short-term surges in demand.
Rate Cuts and Easing:
Conversely, central banks cut rates to stimulate growth during economic slowdowns. Lower rates reduce yields on newly issued bonds, making existing higher-yield bonds more attractive and pushing their prices higher. The bond market often reacts immediately to rate cut announcements, reflecting both current and expected future rates.
Forward Guidance and Market Psychology:
Central banks also influence the bond market through forward guidance—communicating future policy intentions. If markets perceive that rate cuts are imminent or that hikes are slowing, bond prices may surge even before actual changes occur. This psychological aspect of the bond market makes it extremely sensitive to statements from policymakers.
Recent Trends Driving the Surge
In recent years, several trends have intensified the bond market surge and highlighted the interest rate battle:
Post-Pandemic Recovery:
After the COVID-19 pandemic, central banks worldwide slashed rates to near zero and engaged in massive bond-buying programs. This created unprecedented demand for bonds, driving up prices and lowering yields.
Inflation Volatility:
Global inflation spikes, followed by moderation, have caused sharp swings in bond prices. Investors often anticipate central bank responses, leading to rapid market adjustments.
Debt and Deficits:
Governments’ rising debt levels have increased bond issuance, but central banks’ willingness to buy these bonds has supported prices. This delicate balance between supply and demand intensifies the “interest rate battle.”
Geopolitical and Economic Shocks:
Events like wars, trade tensions, or energy crises often push investors toward safe-haven bonds. Such shocks can temporarily override normal interest rate mechanics, creating surges in bond prices.
Bond Market Segments Affected
The surge is not uniform across all types of bonds:
Government Bonds:
Often considered the safest, government bonds experience significant demand during uncertainty. Their yields are closely watched as benchmarks for other markets.
Corporate Bonds:
Higher yields attract investors seeking returns, but they carry more risk. During surges, riskier corporate bonds may lag behind government bonds due to concerns about default.
Inflation-Linked Bonds:
Bonds tied to inflation, like TIPS in the U.S., react differently. When inflation expectations fall, these bonds may also surge because their relative yield advantage grows.
Impact on Investors and the Economy
The surge in the bond market and the interest rate battle have wide-ranging effects:
Investor Strategy:
Bond surges offer opportunities for capital gains, but they also require careful timing. Investors must weigh the potential for price increases against risks of future rate hikes.
Borrowing Costs:
For governments and corporations, surging bond prices reduce borrowing costs, facilitating fiscal spending or expansion. However, if the surge is driven by fear, it may indicate underlying economic weakness.
Portfolio Diversification:
Bonds act as a stabilizing force for portfolios, especially during equity market volatility. Understanding the dynamics of bond surges helps investors hedge risks effectively.
Interest Rate Transmission:
The battle over rates affects mortgages, loans, and savings rates. Surging bond prices signal market expectations for lower future rates, impacting consumers and businesses alike.
Conclusion
The surge in the bond market reflects the complex interplay between investor behavior, central bank policies, and economic conditions. It is both a reaction to immediate events and a forward-looking indicator of market expectations. The ongoing interest rate battle—whether central banks are hiking to curb inflation or cutting to stimulate growth—creates volatility but also opportunities for investors who understand the underlying mechanics.
In essence, the bond market surge is not just about prices rising; it’s a barometer of economic sentiment, policy expectations, and global financial stability. For investors, policymakers, and economists alike, deciphering this surge is crucial for making informed decisions in an interconnected world where interest rates and bond prices are inextricably linked.

America’s Financial Influence1. The U.S. Dollar as the World’s Reserve Currency
At the heart of America’s financial power is the U.S. dollar, which serves as the world’s primary reserve currency. More than 55–60% of global foreign exchange reserves are held in dollars. This dominance gives the U.S. an unparalleled advantage: countries around the world use the dollar for trade, savings, debt issuance, and investment.
Most global commodities—such as oil, natural gas, gold, soybeans, and metals—are priced in dollars. This means nations must hold dollars to buy essential goods. The global banking system, including SWIFT and major correspondent banks, also relies heavily on dollar settlement.
Because demand for dollars is continuous, the U.S. can borrow cheaply. American government debt (U.S. Treasury bonds) is considered the safest asset in global finance. At times of crisis—whether financial, political, or military—investors flock to U.S. bonds, reinforcing America’s safe-haven status.
2. U.S. Capital Markets: The Deepest and Most Liquid in the World
Another core component of America’s financial influence is its capital markets, which are the largest, most liquid, and most advanced globally. The New York Stock Exchange (NYSE) and Nasdaq dominate global equity trading.
Trillions of dollars from global investors flow into American markets due to:
Transparency and regulatory oversight
High liquidity
Strong corporate governance
Rule of law and investor protections
Foreign governments, sovereign wealth funds, pension funds, and institutions invest heavily in U.S. equities, bonds, and real estate. This constant inflow strengthens the dollar and gives the U.S. significant leverage over global capital movements.
3. The Federal Reserve: The World’s Central Bank
The Federal Reserve (Fed) plays a powerful global role. Its monetary policy decisions—including interest rate changes, liquidity injections, and quantitative easing—affect global exchange rates, capital flows, and economic cycles.
When the Fed raises interest rates, capital tends to flow out of emerging markets into the U.S., strengthening the dollar and creating financial pressure abroad. When it lowers rates, global liquidity increases, supporting investment in riskier markets.
During crises, the Fed often acts as a global lender of last resort by providing dollar swap lines to major central banks. This stabilizes international markets and reinforces the dollar’s dominance.
4. U.S. Financial Institutions and Technology Giants
American banks, investment firms, and technology companies shape global financial behavior. Institutions like:
JP Morgan Chase
Goldman Sachs
Morgan Stanley
Citigroup
BlackRock
Visa & Mastercard
have extensive global networks. These institutions influence capital allocation, cross-border lending, and financial standards worldwide.
Additionally, U.S. tech giants—such as Google, Apple, Microsoft, Amazon, and Meta—control large portions of global digital infrastructure. Their financial weight and strategic investments further entrench America’s economic influence.
5. Global Institutions Built Under U.S. Leadership
Following World War II, the U.S. took a leading role in establishing the global financial architecture. Key institutions such as the:
International Monetary Fund (IMF)
World Bank
World Trade Organization (WTO)
Bank for International Settlements (BIS)
were structured with significant American influence. The U.S. holds the largest voting power in the IMF and World Bank, shaping loan conditions, policy guidelines, and development priorities.
These institutions promote norms that align with U.S. economic philosophies—free markets, open trade, and capital mobility—extending American influence far beyond its borders.
6. Military Strength and Geopolitical Power
Economic influence is closely connected to military power. The U.S. maintains the world’s most advanced military, securing global trade routes and ensuring confidence in the stability of international commerce.
Key strategic advantages include:
Control of maritime chokepoints through military partnerships
Intelligence and cybersecurity capabilities
A network of global alliances (NATO, Japan, South Korea, Australia, etc.)
Stable global trade ensures consistent demand for the dollar and allows the U.S. to project both financial and diplomatic influence.
7. American Multinational Corporations and Soft Power
American brands—such as Coca-Cola, McDonald’s, Nike, Apple, Boeing, Tesla—operate in nearly every country.
Their success brings:
Global capital back into U.S. markets
Influence over global consumer behavior
Strength to the U.S. corporate bond and equity markets
Soft power—through movies, media, education, and culture—also enhances America’s attractiveness to global investors.
8. U.S. Sanctions and the Power of the Dollar System
Because the dollar dominates global payments, the U.S. can impose powerful economic sanctions. Countries, banks, and companies that violate U.S. guidelines can be denied access to the dollar system, essentially disconnecting them from global trade.
This gives America significant geopolitical leverage. Sanctions on Iran, Russia, and various corporations demonstrate how economic pressure can shape international behavior.
No other nation currently has the same level of financial coercive power.
9. Innovation and Leadership in Finance
America leads in:
Venture capital
Fintech innovation
Blockchain development
Artificial intelligence in finance
High-frequency trading
Global credit rating agencies (S&P, Moody’s, Fitch)
These innovations attract entrepreneurs and investors from around the world, reinforcing the centrality of U.S. financial systems.
10. Challenges to American Financial Dominance
While America maintains strong influence, some challenges are emerging:
China’s growing economic power
Efforts toward de-dollarization
Expansion of BRICS currency mechanisms
Growth of digital currencies and blockchain alternatives
Geopolitical tensions and shifts in global alliances
However, none of these currently match the scale, trust, liquidity, or institutional strength of the U.S. financial system.
Conclusion
America’s financial influence is the product of a powerful combination: the dominance of the U.S. dollar, vast capital markets, the global authority of the Federal Reserve, deep geopolitical networks, influential corporations, military strength, and a long-standing reputation for economic stability. Even as global dynamics shift and new powers emerge, the United States remains the central pillar of global finance. Its currency, institutions, innovation ecosystem, and strategic advantages ensure that American influence continues to shape economic decisions, trade flows, investment patterns, and geopolitical outcomes across the world.

Global Economy Shifts1. Multipolarity and the Rebalancing of Global Power
For decades, the global economy operated under a largely unipolar structure led by the United States and its Western allies. Today, this dominance is fading as new economic blocs rise. Emerging markets—most notably China, India, Southeast Asia, the Middle East, and Africa—are becoming engines of global growth.
Rise of Asia
Asia now contributes more than half of global economic growth. China remains the world’s second-largest economy despite slowing growth, while India is emerging as the fastest-growing major economy, driven by demographics, domestic consumption, and digital infrastructure.
Shift Toward Regional Blocs
Increasing geopolitical tensions between the U.S. and China have accelerated the formation of economic blocs:
BRICS+ expansion has brought new resource-rich members.
Regional trade agreements such as RCEP and CPTPP are reshaping Asia-Pacific integration.
The European Union, despite internal challenges, is investing in strategic autonomy, green energy, and advanced manufacturing.
This move toward multipolarity is redefining investment flows, supply chains, and diplomatic alignments.
2. Technological Transformation and the Digital Economy
Technology is the most powerful force reshaping global economic structures. The accelerating adoption of AI, automation, robotics, and digital platforms is altering productivity, labor markets, and competitive advantages.
Artificial Intelligence as a Growth Catalyst
AI is transforming sectors such as finance, healthcare, logistics, and manufacturing. Countries that invest heavily in AI—like the U.S., China, and South Korea—are gaining competitive edges.
Digital Infrastructure Expansion
Digital connectivity has become the backbone of national competitiveness. Innovations such as:
5G and upcoming 6G networks
Cloud computing
Quantum technologies
Blockchain and digital payments
are enabling new business models. Digital public infrastructure (DPI), led by India’s UPI, Aadhaar, and ONDC, is becoming a blueprint for emerging markets.
Techno-Economic Fragmentation
However, technology is also driving global fragmentation:
Competing semiconductor supply chains
Restrictions on data flows
Tech-related sanctions
Global technology standards may split into competing spheres, creating challenges for multinational corporations.
3. Geopolitical Conflicts and De-Risking of Supply Chains
Conflicts such as the Russia–Ukraine war, Middle East instability, and U.S.–China tensions have triggered a significant rethinking of global supply chains.
From Globalization to “De-Risking”
Countries are not fully de-globalizing, but they are diversifying away from single-source dependencies. This has led to:
Nearshoring (e.g., U.S. companies shifting production to Mexico)
Friendshoring (production moving among geopolitical allies)
China+1 strategy (India, Vietnam, Indonesia as beneficiaries)
Resilience Over Efficiency
Companies are prioritizing:
Multi-location manufacturing
Strategic stockpiling
Strengthening logistics networks
Supply chains are becoming more regional and networked, reducing vulnerability to shocks.
4. Green Transition and the Economics of Climate Change
Climate change is reshaping policymaking and investment decisions. Governments and corporations are transitioning toward low-carbon economies, driving structural changes across energy, transportation, manufacturing, and agriculture.
Shift Toward Clean Energy
Renewables—solar, wind, hydro, hydrogen—are experiencing massive investment. Nations like China lead in solar manufacturing, Europe in wind technology, and the Middle East in green hydrogen.
Electric Vehicle (EV) Transformation
EV adoption is accelerating globally, forcing:
Auto companies to redesign supply chains
Battery manufacturers to secure critical mineral sources
Governments to provide subsidies and carbon regulations
Climate-Resilient Infrastructure
Rising temperatures and extreme weather events require substantial investment in resilient infrastructure, influencing fiscal priorities worldwide.
5. Demographic Changes and Labor Market Evolution
Demographics play a critical role in shaping economic potential.
Aging Economies
Developed nations—Japan, South Korea, much of Europe, and even China—face aging populations, shrinking workforces, and rising healthcare burdens. This leads to:
Lower long-term growth
Higher fiscal pressure
Increased need for automation and immigration
Youthful Economies
In contrast, India, Africa, and parts of Southeast Asia have young populations and rapidly urbanizing societies. These countries will be key drivers of global labor supply and consumer demand in coming decades.
Future of Work
Automation and AI will redefine jobs across sectors. While high-skilled workers benefit from rising productivity, low-skilled jobs face displacement. Upskilling, remote work, and gig economy platforms are altering labor structures.
6. Shifts in Global Trade, Currency, and Finance
Global trade patterns are being reshaped by:
Tariffs and trade barriers
Sanctions
New trade agreements
Carbon border taxes
Changing Currency Dynamics
While the U.S. dollar remains dominant, alternative currency arrangements are gaining traction:
BRICS countries exploring settlement in local currencies
Digital currencies and central bank digital currencies (CBDCs)
Bilateral trade agreements bypassing the dollar
Although the dollar’s dominance will not end soon, its relative share is gradually declining.
Capital Flow Reconfiguration
Investments are moving into:
Resilient supply chains
Green energy
Technology hubs
Emerging markets
Sovereign wealth funds, especially from the Middle East, are playing a major role in global capital allocation.
7. Consumer Behavior and Market Transformations
Consumers are shifting their preferences due to technological access, environmental awareness, and rising incomes.
Key trends include:
Increased digital consumption
Demand for sustainable products
Rapid growth of e-commerce and online services
Preference for personalized and subscription-based models
Emerging market middle classes—especially in India, Indonesia, and Africa—are becoming major contributors to global consumption growth.
Conclusion: A Transformative Decade Ahead
The global economy is transitioning through a period of deep structural change. Multipolarity, technological acceleration, shifting demographics, climate imperatives, and geopolitical tensions are transforming how nations trade, innovate, and grow.
The next decade will be defined by adaptability. Countries and companies that invest in technology, diversify supply chains, embrace sustainability, and harness human capital will emerge as winners. As economic power diffuses and the global order evolves, agility and resilience will shape the new world economy.

XAUUSD h4 pattern strongly down XAUUSD down it price 3339
Target 3320
Target 3310
Target 3300
Long target 3250

Market next target 🔄 Disruption Analysis:
📌 Current Scenario:
Price is trading around 3,336.400, just below the identified resistance zone (~3,340-3,343).
A range-bound structure is visible with repeated rejections at resistance and support.
---
🚨 Disruption View:
❌ Invalidating Bearish Bias:
The chart assumes a bearish move toward the 3,320 target, but there are early signs of strength near the mid-range (3,335 area).
Failed breakdowns and higher lows indicate buying pressure below 3,330.
---
🟢 Alternative Disruption Outlook (Bullish Flip):
If price breaks and holds above 3,343 resistance, we may see:
🔼 Upside breakout toward 3,355–3,360 zone.
📈 Continuation of the larger uptrend from July 1st rally.
---
🔁 Key Disruption Levels:
Support: 3,328–3,330 (interim zone to watch before full drop)
Resistance: 3,343–3,345 (bullish breakout point)
Invalidation of Bearish Bias: Closing above 3,345 on strong volume.

Market next target ⚠️ Disruption Analysis – Gold (1H):
🔹 Pattern Disruption Identified:
The chart previously followed a descending structure with lower highs and lower lows, confirming bearish momentum.
However, a temporary recovery (small bullish correction) appears after a sharp drop, disrupting the previous flow.
---
🔄 Disruption Points:
1. Break in Momentum (Structure Shift):
The recent bullish correction (small upward leg) challenges the consistency of the descending trend.
It signals a potential pause or trap in the current bearish move.
2. Price Rejection Area:
Price attempted to bounce but failed to break above the previous lower high, indicating bearish strength remains intact, but is facing disruption from short-term buyers.
3. Volatility Spike:
The long wick on the recent candle shows a volatility disruption, likely due to economic news or high-impact events (suggested by the ⚡ icon on the chart).
4. Target Zone Disruption:
Though the yellow arrow points toward a bearish target, the slight upward pullback adds uncertainty about whether price will reach that level immediately.
Market next move ❗ Disrupted Market Outlook:
⚠️ False Breakout Risk:
The recent "Breakout" above previous highs may be a bull trap. Although price surged, the follow-up candles are showing lower highs, suggesting weakening bullish momentum.
📉 Bearish Divergence (not shown but likely):
Based on the price action, there's a potential bearish divergence with RSI/MACD (if overlaid), as price makes higher highs while momentum likely weakens.
🔄 Resistance Reversal Zone:
The area labeled as "Support area" at the top (near $67.50) is actually acting as resistance again — the market is failing to hold above this level.
🔁 Retest Failure:
After the breakout, price failed to establish strong support and is consolidating below the highs, hinting at a potential breakdown below $66.
---
🔻 Disruption Path:
1. Drop to $66.00 - immediate pullback from failed breakout.

Market next target 🔀 Disruption Analysis – Bullish Alternative Scenario
The current chart suggests a bearish outlook from the resistance zone (~$2,495–$2,500), targeting a drop below $2,425. However, here’s how a bullish disruption could break this bearish narrative:
---
🟢 Bullish Disruption Possibility:
1. Support Reclaim & Strong Buyer Reaction:
If price reclaims and holds above the marked “support area” (~$2,495), it could signal strength and trap early sellers.
A strong bullish candle closing above $2,505 could invalidate the bearish scenario.
2. Higher Low Formation:
If ETH prints a higher low above $2,470, it would suggest buyers are stepping in early, reinforcing bullish momentum.
3. Target Shift – Bullish Continuation:
A confirmed breakout above $2,505 may open the path to $2,540–$2,560 as the new short-term target zone.
4. Momentum Catalyst:
A positive U.S. macroeconomic event or crypto-specific bullish news (e.g., ETF, institutional inflows) could fuel upside disruption.

Market next target 🔀 Disruption Analysis – Bearish Alternative Scenario
The current chart suggests a bullish continuation from the consolidation zone around $107,300–$107,500, with a projected move toward $108,500+. However, the following bearish disruption could invalidate that path:
---
🔻 Bearish Disruption Possibility:
1. False Breakout Trap:
If price briefly spikes above the consolidation zone and quickly reverses, it could trap breakout buyers.
A failed bullish move around $107,800–$108,000 would be the first bearish signal.
2. Weak Volume Confirmation:
Lack of volume during the breakout would signal lack of institutional interest, increasing downside risk.
3. Break Below Support Zone:
If BTC breaks below $107,000, it would signal a loss of momentum and invalidate the bullish scenario.
This breakdown may lead to a quick move toward $106,000 or even $105,800, the recent swing low.
4. Macro Influence:
Any negative U.S. economic data or regulatory news could spark bearish sentiment and accelerate the drop.
Market next move 🔀 Disruption Analysis – Bearish Alternative Scenario
While the current setup points to a bullish continuation above the support zone (around 144.10–144.20) with a projected target near 144.60, here’s how a bearish disruption could unfold instead:
---
🔻 Bearish Disruption Possibility:
1. Failed Breakout / Bull Trap:
Price may fake a move upward to trap breakout buyers near 144.40–144.50, then sharply reverse.
This would indicate a false breakout and potential reversal setup.
2. Rejection at Resistance:
Repeated failure to close above 144.40 may signal exhaustion.
Bearish divergence could form on momentum indicators (like RSI) as price rises.
3. Break Below Support Area:
A decisive break below the red support zone (around 144.10) may shift momentum bearish.
That would confirm a lower high and suggest downside continuation.
4. Next Bearish Target:
Initial support lies at 143.85, with further potential drop toward 143.60.
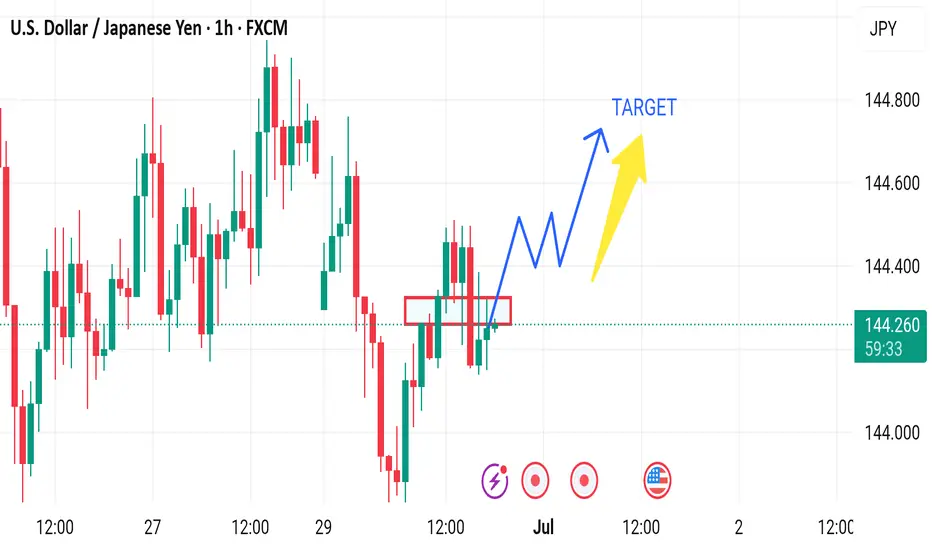
Market next target 🔀 Disruption Analysis – Bullish Alternative Scenario
While the current chart outlines a bearish scenario after a short-term bullish correction, leading to a drop toward the target near 1.36600, here’s how a bullish disruption could unfold instead:
---
🟢 Bullish Disruption Possibility:
1. False Breakdown / Bear Trap:
The market may dip slightly below recent lows to trigger sell stops and liquidity grab, then reverse upward.
If price finds strong buying interest around 1.3690–1.3700, it could spark a bullish reversal.
2. Strong Rejection Candles:
Watch for bullish engulfing or pin bar formations on lower timeframes (15m or 30m) near the dip area.
These would signal loss of bearish momentum.
3. Break of Lower High Structure:
A break above 1.3720 would shift short-term market structure to bullish.
It could lead to a move toward 1.3750–1.3780.
4. Macro Fundamentals:
Hawkish BOE comments or weak U.S. data could reverse USD strength, lifting GBP/USD.
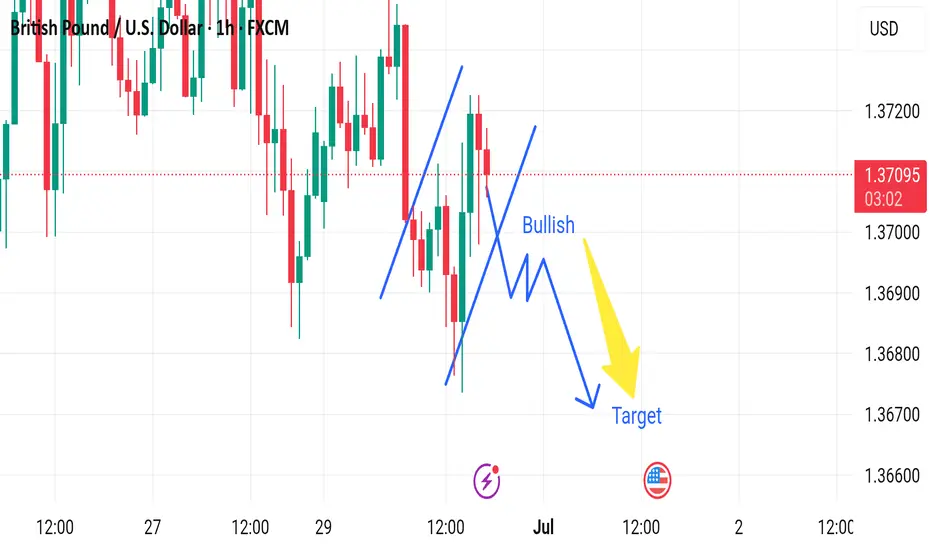
Market next move Disruption Analysis – Bullish Alternative Scenario
While the current chart suggests a bearish setup from a resistance zone (around 1.1765) toward a target near 1.1630, here's a potential bullish disruption that could invalidate the bearish thesis:
---
🟢 Bullish Disruption Possibility:
1. False Breakdown / Liquidity Grab:
Price may fake a dip below the red resistance-turned-support zone to trigger stop-losses before reversing.
This is known as a liquidity sweep or bear trap.
2. Higher Low Formation:
If the pair pulls back slightly but forms a higher low above 1.1700, it may signal bullish continuation.
3. Breakout Confirmation:
A strong bullish candle above 1.1775 could confirm continuation toward 1.1830–1.1850.
4. Fundamental Catalyst:
Positive EU economic news or dovish signals from the U.S. Fed could support Euro strength.