Exotic Option Structured ProductsAdvanced Instruments for Customized Risk–Return Profiles
Exotic option structured products are sophisticated financial instruments designed by combining traditional securities with exotic derivatives to create customized payoff structures. Unlike plain vanilla options such as simple calls and puts, exotic options embed complex features—path dependency, multiple underlying assets, conditional triggers, or non-standard expiration rules. When these options are packaged into structured products, they offer tailored solutions to investors seeking specific risk–return outcomes, yield enhancement, capital protection, or exposure to particular market views.
Understanding Structured Products
Structured products are pre-packaged investment strategies, typically issued by banks or financial institutions, whose returns depend on the performance of one or more underlying assets such as equities, indices, interest rates, commodities, or currencies. They are usually composed of two main components:
A fixed-income element (such as a bond or zero-coupon bond) that provides capital protection or income stability.
A derivative component (options or swaps) that delivers market-linked returns.
When exotic options are used instead of standard options, the product becomes an exotic option structured product. These structures allow issuers to engineer highly specific payoff profiles that cannot be easily replicated through direct market trading.
What Makes an Option “Exotic”?
Exotic options differ from vanilla options in their payoff complexity and conditions. Some defining characteristics include:
Path dependency: Payoff depends on the entire price path of the underlying, not just the final price.
Conditional triggers: Activation or deactivation occurs if certain price levels are touched.
Multiple underlyings: Returns may depend on the worst-performing or best-performing asset in a basket.
Non-standard settlement: Payoffs may occur at multiple observation dates or vary dynamically.
Examples of exotic options include barrier options, digital options, Asian options, lookback options, and rainbow options.
Common Types of Exotic Option Structured Products
Barrier-Linked Structured Notes
These products embed barrier options, where the payoff depends on whether the underlying asset crosses a predetermined barrier level.
Knock-in structures activate only if the barrier is breached.
Knock-out structures terminate if the barrier is breached.
Such products are often used to enhance yield but expose investors to sudden changes in risk if the barrier is touched.
Autocallable Structured Products
Autocallables are among the most popular exotic structured products. They include periodic observation dates. If the underlying asset trades above a predefined level on any observation date, the product automatically redeems early, paying a fixed coupon.
These products are attractive in sideways or moderately bullish markets but can expose investors to significant downside risk in sharp market declines.
Range Accrual Notes
Returns accrue only when the underlying asset remains within a specified price range. The longer the asset stays within the range, the higher the coupon earned.
These products are sensitive to volatility and are suitable when investors expect stable market conditions.
Worst-of and Best-of Structures
These products depend on the performance of multiple underlying assets.
Worst-of structures base returns on the poorest-performing asset in the basket, increasing risk but offering higher coupons.
Best-of structures benefit from the strongest performer but usually offer lower yields.
Digital and Binary Payoff Products
Digital structures pay a fixed amount if a specific condition is met (for example, the index closes above a strike level at maturity), and nothing otherwise.
They provide clear outcomes but involve all-or-nothing risk profiles.
Why Investors Use Exotic Option Structured Products
Exotic option structured products are used for several strategic reasons:
Yield Enhancement: In low-interest-rate environments, these products offer higher potential returns than traditional bonds by selling optionality.
Market View Expression: Investors can express nuanced views such as range-bound markets, mild bullishness, or low volatility expectations.
Customization: Products can be tailored to specific investment horizons, risk tolerance levels, and underlying assets.
Capital Protection (Partial or Conditional): Some structures provide capital protection unless certain adverse conditions occur.
Risks Involved in Exotic Structured Products
Despite their attractiveness, exotic option structured products carry significant risks:
Complexity Risk
The payoff mechanics are often difficult to understand, making it hard for investors to assess true risk exposure.
Market Risk
Adverse movements in the underlying asset can lead to partial or full capital loss, especially in barrier or worst-of structures.
Issuer Credit Risk
Structured products are typically unsecured obligations of the issuing bank. If the issuer defaults, investors may lose their investment regardless of market performance.
Liquidity Risk
Secondary market liquidity can be limited. Exiting the product before maturity may result in unfavorable pricing.
Model and Volatility Risk
Exotic options are highly sensitive to volatility, correlation, and pricing models. Changes in these parameters can significantly affect valuation.
Pricing and Valuation Considerations
Pricing exotic option structured products involves advanced quantitative models. Unlike vanilla options, which can often be priced using closed-form solutions, exotic options typically require numerical methods such as Monte Carlo simulations or lattice models.
Key factors influencing pricing include:
Implied volatility and volatility skew
Correlation between multiple underlyings
Interest rates and dividend assumptions
Frequency of observation dates
Barrier proximity and probability of breach
Because of this complexity, investors often rely on issuer-provided pricing, which may include embedded margins.
Role in Portfolio Construction
Exotic option structured products are generally used as satellite investments rather than core holdings. They can complement a portfolio by:
Generating income during low-growth phases
Providing differentiated return streams
Enhancing yield without full equity exposure
However, prudent allocation sizing and diversification across issuers and structures are essential to manage concentration risk.
Regulatory and Suitability Aspects
Given their complexity, regulators in many jurisdictions require enhanced disclosure and suitability assessments before these products are sold to retail investors. They are more commonly used by high-net-worth individuals, institutional investors, and professional traders who understand derivatives and structured payoffs.
Conclusion
Exotic option structured products represent the intersection of financial engineering, derivatives pricing, and customized investment solutions. They offer powerful tools for tailoring risk and return, expressing precise market views, and enhancing yield. However, these benefits come with increased complexity, opacity, and risk. Successful use of exotic option structured products requires deep understanding of derivative mechanics, careful assessment of issuer creditworthiness, and disciplined risk management. For informed investors, they can be valuable instruments—but they demand respect, due diligence, and strategic intent rather than speculative use.
Forexstrategy

Trading Strategies and Index InvestingA Comprehensive Guide for Modern Investors
Financial markets offer a wide spectrum of opportunities for wealth creation, broadly divided into active trading strategies and passive index investing. While both aim to generate returns, they differ significantly in philosophy, risk management, time horizon, and skill requirements. Understanding how these two approaches work—and how they can complement each other—is essential for investors navigating today’s fast-changing global markets.
Understanding Trading Strategies
Trading strategies are active investment approaches that seek to profit from short- to medium-term price movements in financial instruments such as stocks, indices, commodities, currencies, and derivatives. Traders rely on timing, analysis, and discipline rather than long-term economic growth alone.
1. Types of Trading Strategies
a. Day Trading
Day trading involves opening and closing positions within the same trading session. The objective is to capture intraday volatility. Traders use technical indicators like moving averages, RSI, MACD, and volume profiles. This strategy requires constant monitoring, quick decision-making, and strict risk controls.
b. Swing Trading
Swing traders hold positions for a few days to weeks, aiming to profit from price “swings” within a broader trend. This strategy blends technical analysis with basic fundamentals, such as earnings announcements or macro news. Swing trading is less stressful than day trading but still demands precision.
c. Position Trading
Position trading focuses on medium- to long-term trends, often lasting months. Traders base decisions on macroeconomic cycles, sector trends, and strong technical structures. This approach resembles investing but with more active entry and exit points.
d. Momentum Trading
Momentum traders buy assets showing strong upward movement and sell those in decline. The strategy is based on the belief that trends persist longer than expected. News, earnings surprises, and breakout levels play a crucial role.
e. Derivatives and Options Strategies
Advanced traders use futures and options for hedging, leverage, or income generation. Strategies like covered calls, spreads, and straddles allow traders to express views on volatility, direction, or time decay.
2. Advantages and Risks of Trading
Advantages
Potential for high returns in a short period
Flexibility across market conditions (bull, bear, sideways)
Ability to use leverage and hedging
Risks
High emotional and psychological pressure
Transaction costs and slippage
Risk of capital erosion without discipline
Successful trading requires a defined plan, risk management rules, position sizing, and continuous learning.
What Is Index Investing?
Index investing is a passive investment strategy that involves investing in a basket of securities that track a market index such as the Nifty 50, Sensex, S&P 500, or MSCI World Index. Instead of trying to beat the market, index investors aim to match market returns over the long term.
1. How Index Investing Works
Index funds and ETFs replicate the composition of an index by holding the same stocks in the same proportion. As the index grows with economic expansion and corporate earnings, investors benefit from compounding and long-term growth.
For example, investing regularly in a broad-market index captures:
Economic growth
Productivity improvements
Inflation-adjusted wealth creation
2. Benefits of Index Investing
a. Diversification
Index funds provide exposure to multiple companies across sectors, reducing company-specific risk.
b. Low Cost
Passive funds have lower expense ratios compared to actively managed funds, which significantly boosts long-term returns.
c. Simplicity and Discipline
Index investing eliminates emotional decision-making and market timing errors. Regular investments through SIPs encourage financial discipline.
d. Long-Term Wealth Creation
Historically, equity indices have delivered consistent real returns over long periods, making them ideal for retirement and long-term goals.
3. Risks and Limitations
No downside protection during market crashes
Returns are limited to market performance
Requires patience and long investment horizons
Despite short-term volatility, index investing rewards investors who stay invested and reinvest dividends.
Trading vs Index Investing: A Strategic Comparison
Aspect Trading Strategies Index Investing
Approach Active Passive
Time Horizon Short to medium term Long term
Skill Requirement High Low to moderate
Cost High (brokerage, taxes) Low
Risk High Moderate
Emotional Stress High Low
Trading seeks to extract alpha, while index investing focuses on capturing beta, the return of the overall market.
Combining Trading Strategies with Index Investing
A modern and balanced approach is to combine both methods:
Use index investing as the core portfolio for long-term wealth creation.
Allocate a smaller portion of capital to trading strategies for active income and skill development.
Profits from trading can be periodically invested into index funds, accelerating compounding.
Index investments provide stability during periods when trading performance fluctuates.
This “core–satellite” approach balances growth, stability, and opportunity.
Role of Market Cycles and Discipline
Markets move in cycles of expansion, contraction, and consolidation. Trading strategies often perform better in volatile or trending markets, while index investing shines during long-term economic growth phases. Understanding where the market stands in its cycle helps investors adjust expectations and capital allocation.
Regardless of the approach, discipline is the common foundation:
Clear goals
Defined risk limits
Consistent execution
Long-term perspective
Conclusion
Trading strategies and index investing represent two distinct yet complementary paths in financial markets. Trading offers the excitement of active participation and the possibility of higher short-term returns but demands skill, time, and emotional resilience. Index investing, on the other hand, offers simplicity, diversification, and reliable long-term wealth creation through the power of compounding.
For most investors, the optimal solution is not choosing one over the other but strategically combining both based on risk tolerance, time availability, and financial goals. In an increasingly complex global market environment, mastering this balance can lead to sustainable success and financial independence.

The Energy Transition Boom: Powering a Sustainable Global Future1. Understanding the Energy Transition
Energy transition refers to the long-term transformation of how energy is produced, distributed, and consumed. Historically, energy systems have shifted before—from biomass to coal, coal to oil, and oil to gas. Today’s transition, however, is unique in its speed, scale, and urgency, as it is driven by the need to combat climate change and reduce greenhouse gas emissions.
The current transition emphasizes:
Renewable energy sources such as solar, wind, hydro, and geothermal
Electrification of transport and industry
Energy efficiency and smart grids
Decarbonization of hard-to-abate sectors like steel, cement, and chemicals
2. Key Drivers of the Energy Transition Boom
a. Climate Change and Net-Zero Targets
Governments worldwide have committed to net-zero emissions targets, many by 2050. These commitments are backed by international agreements such as the Paris Agreement, creating long-term policy certainty that accelerates investment in clean energy.
b. Rapid Cost Declines in Renewables
The cost of renewable energy has fallen dramatically over the past decade. Solar and wind power are now among the cheapest sources of electricity globally, even without subsidies. This cost competitiveness has made renewables economically attractive, not just environmentally desirable.
c. Technological Innovation
Advancements in battery storage, hydrogen technology, carbon capture, and digital energy management systems are solving intermittency and reliability challenges. Innovation is enabling renewables to scale faster and integrate more effectively into existing grids.
d. Capital Reallocation and Investor Pressure
Global investors are increasingly shifting capital away from fossil fuels toward ESG-aligned assets. Sovereign wealth funds, pension funds, and asset managers now view clean energy as both a growth opportunity and a risk management necessity.
3. Renewable Energy at the Core
Solar and Wind Power
Solar and wind are the backbone of the energy transition boom. Utility-scale solar parks, offshore wind farms, and decentralized rooftop systems are expanding rapidly. Emerging markets, with abundant sunlight and land availability, are becoming major growth hubs.
Hydropower and Geothermal
Hydropower remains a stable baseload renewable source, while geothermal energy is gaining traction in regions with favorable geology. Together, they provide reliability and diversification within renewable portfolios.
4. Electrification and the Rise of Electric Mobility
One of the most visible aspects of the energy transition boom is the electrification of transportation. Electric vehicles (EVs) are rapidly gaining market share due to falling battery costs, government incentives, and expanding charging infrastructure.
Beyond passenger vehicles, electrification is extending to:
Buses and commercial fleets
Two-wheelers and three-wheelers in emerging markets
Railways and urban transit systems
This shift is increasing electricity demand while simultaneously reducing oil dependence and urban pollution.
5. Energy Storage and Grid Transformation
Renewable energy growth requires robust energy storage and grid modernization. Battery energy storage systems (BESS) are becoming essential for balancing supply and demand, stabilizing grids, and enabling higher renewable penetration.
Smart grids, powered by AI and digital technologies, are improving:
Demand forecasting
Real-time energy management
Integration of distributed energy resources like rooftop solar and EVs
6. Hydrogen and the Next Frontier
Green hydrogen—produced using renewable electricity—has emerged as a critical pillar of the energy transition boom. It offers a solution for decarbonizing sectors where direct electrification is difficult, such as:
Steel and cement production
Long-haul transport and shipping
Aviation and chemical manufacturing
Countries are racing to build hydrogen ecosystems, from electrolyzers to pipelines and export hubs, positioning hydrogen as a future global commodity.
7. Economic and Employment Impact
The energy transition boom is a major job creator. Renewable energy, EV manufacturing, grid infrastructure, and energy efficiency projects are generating millions of new jobs worldwide.
Key economic benefits include:
Reduced energy import bills for fossil-fuel-dependent countries
Improved energy security and price stability
Development of new industrial clusters and supply chains
For emerging economies, the transition presents a chance to leapfrog traditional energy models and build sustainable growth pathways.
8. Geopolitical and Strategic Shifts
The transition is reshaping global geopolitics. Energy power is shifting from fossil fuel–rich nations to countries with:
Strong renewable resources
Advanced clean-tech manufacturing
Access to critical minerals like lithium, cobalt, and rare earths
This is creating new strategic alliances, trade routes, and competition over clean energy supply chains.
9. Challenges and Risks
Despite its momentum, the energy transition boom faces challenges:
Intermittency of renewables and grid constraints
High upfront capital costs in developing countries
Supply chain bottlenecks for critical minerals
Policy inconsistency and regulatory delays
Managing a just transition—ensuring affordability, energy access, and workforce reskilling—is essential to maintain social and political support.
10. The Road Ahead
The energy transition boom is not a short-term trend; it is a multi-decade structural shift. As technology matures and policy frameworks strengthen, clean energy will become the dominant foundation of the global economy.
Success will depend on:
Continued innovation and cost reduction
Strong public–private collaboration
Scalable financing solutions
Global cooperation to ensure inclusive growth
Conclusion
The energy transition boom represents a historic transformation of the global energy system—one that aligns economic growth with environmental sustainability. It is redefining how nations power their economies, how industries operate, and how societies consume energy. While challenges remain, the momentum is unmistakable. Those who adapt early—governments, companies, and investors—stand to benefit most from this once-in-a-generation shift toward a cleaner, more resilient, and sustainable future.

Global Equity TrendsNavigating Growth, Volatility, and Structural Shifts in World Markets
Global equity markets represent the collective pulse of the world economy. They reflect not only corporate earnings and economic growth but also investor sentiment, geopolitical realities, technological disruption, and policy decisions taken by governments and central banks. Over the past few decades—and especially in recent years—global equity trends have undergone significant transformation. Understanding these trends is essential for investors, policymakers, and analysts seeking to navigate an increasingly interconnected and dynamic financial landscape.
1. Evolution of Global Equity Markets
Historically, global equity markets were dominated by developed economies such as the United States, Western Europe, and Japan. These markets benefited from stable institutions, deep capital pools, and mature corporate sectors. Over time, globalization, liberalization of capital flows, and technological advances enabled capital to move more freely across borders. This laid the foundation for the rise of emerging markets, which now play a crucial role in global equity performance.
Today, global equities are no longer driven by a single region. Instead, market leadership rotates across geographies depending on economic cycles, interest rate regimes, and structural reforms. This diversification has increased opportunities but has also introduced new layers of complexity and risk.
2. Dominance of the United States in Global Equities
The United States remains the most influential equity market globally. US equities account for more than half of global market capitalization, driven largely by innovation-led companies in technology, healthcare, and consumer sectors. The rise of mega-cap technology firms has reshaped global indices, making US market performance a key determinant of worldwide equity returns.
Strong corporate governance, deep liquidity, and a culture of innovation have allowed US companies to consistently attract global capital. However, this dominance has also raised concerns about valuation concentration and overreliance on a narrow set of stocks to drive global performance.
3. Shifting Role of Europe and Japan
European equity markets have shown moderate but uneven growth. Structural challenges such as aging populations, slower productivity growth, and political fragmentation have limited long-term returns compared to the US. However, Europe continues to offer opportunities in industrials, luxury goods, renewable energy, and financials, especially during cyclical recoveries.
Japan’s equity market has experienced a renaissance after decades of stagnation. Corporate governance reforms, shareholder-friendly policies, and improving profitability have attracted renewed foreign interest. While demographic challenges persist, Japan’s focus on efficiency, automation, and export competitiveness continues to support equity growth.
4. Rise of Emerging Markets
Emerging markets (EMs) have become a central theme in global equity trends. Countries across Asia, Latin America, Eastern Europe, and Africa have seen expanding equity markets driven by urbanization, rising incomes, and industrialization. China and India, in particular, have emerged as major equity market powerhouses.
EM equities often outperform during periods of global growth and weaker US dollar cycles. However, they are also more sensitive to external shocks, capital flow reversals, and domestic policy risks. As a result, global investors increasingly adopt selective and thematic approaches rather than broad EM exposure.
5. Sectoral Shifts and Thematic Investing
One of the most important global equity trends is the shift from traditional sectors to new-economy themes. Technology, artificial intelligence, renewable energy, electric vehicles, biotechnology, and digital finance are now major drivers of equity returns worldwide.
At the same time, traditional sectors such as energy, materials, and financials continue to play a cyclical role, often outperforming during inflationary or recovery phases. This has led to a growing emphasis on sector rotation strategies, where investors shift capital based on macroeconomic conditions.
Thematic investing has gained prominence, allowing investors to capture long-term structural trends that transcend geographic boundaries.
6. Impact of Monetary Policy and Interest Rates
Global equity trends are deeply influenced by central bank policies. Periods of low interest rates and abundant liquidity have historically supported higher equity valuations. Conversely, tightening monetary conditions often lead to market corrections, increased volatility, and a shift toward defensive stocks.
In recent years, the global fight against inflation has reintroduced interest rate sensitivity into equity markets. Growth stocks, which rely heavily on future earnings, have become more volatile, while value and dividend-paying stocks have regained relevance.
7. Geopolitics and Fragmentation of Globalization
Geopolitical tensions have become a defining feature of modern global equity trends. Trade disputes, sanctions, military conflicts, and strategic competition between major powers have increased uncertainty and market volatility.
As globalization evolves into a more fragmented system, companies are rethinking supply chains, production hubs, and market exposure. This has implications for equity markets, favoring regions and companies aligned with domestic manufacturing, energy security, and strategic independence.
8. Role of Technology and Digital Transformation
Technology has fundamentally transformed global equity markets, not just in terms of listed companies but also market structure. Algorithmic trading, digital exchanges, real-time data, and increased retail participation have changed how markets function.
Global equity performance is increasingly linked to innovation cycles. Companies that adapt quickly to digital transformation tend to attract premium valuations, while laggards face declining relevance.
9. Sustainability and ESG Influence
Environmental, Social, and Governance (ESG) considerations have become an integral part of global equity trends. Investors are increasingly factoring sustainability, climate risk, and corporate ethics into valuation and capital allocation decisions.
While ESG investing has faced periods of skepticism, the long-term shift toward sustainable business models continues to influence equity markets, particularly in developed economies and large institutional portfolios.
10. Volatility, Cycles, and Long-Term Outlook
Global equity markets move in cycles influenced by economic growth, earnings trends, and investor psychology. Short-term volatility is inevitable, especially in a world marked by rapid information flow and policy shifts. However, over the long term, equities remain one of the most effective tools for wealth creation.
Looking ahead, global equity trends are likely to be shaped by demographic changes, technological innovation, climate transition, and evolving global power dynamics. Investors who understand these structural forces—and diversify across regions, sectors, and themes—are better positioned to navigate uncertainty and capture long-term growth.
Conclusion
Global equity trends reflect a world in transition. From the dominance of US markets to the rising influence of emerging economies, from traditional industries to disruptive technologies, equities continue to adapt to changing realities. While risks such as volatility, geopolitical tension, and policy uncertainty persist, global equity markets remain a powerful engine of growth. A disciplined, informed, and long-term perspective is essential to successfully navigate the evolving global equity landscape.

Currency Adventure AwaitsNavigating the Dynamic World of Global Currencies
Introduction
The phrase “Currency Adventure Awaits” captures the idea that the global currency landscape is no longer static or predictable. Instead, it is an evolving ecosystem shaped by economic cycles, geopolitical shifts, technological innovation, and investor behavior. For traders, investors, policymakers, and even businesses, understanding currencies has become an essential journey—full of opportunities, risks, and lessons. Below is a detailed, point-wise exploration of this currency adventure, explaining why it matters and how one can navigate it effectively.
1. Currencies as the Backbone of the Global Economy
Currencies facilitate international trade, investment, and capital flows.
Exchange rates influence import-export competitiveness, inflation, and growth.
Every global transaction—from oil trade to software services—relies on currency exchange.
Strong currencies reflect economic confidence, while weak currencies signal stress or imbalance.
2. Evolution from Fixed to Flexible Exchange Rates
Earlier systems like the Gold Standard and Bretton Woods fixed currency values.
Modern economies mostly follow floating or managed-float exchange rate regimes.
Exchange rates now respond to market forces such as demand, supply, and capital flows.
This shift increased volatility, making currency markets more dynamic and adventurous.
3. Role of Central Banks in the Currency Journey
Central banks control interest rates, liquidity, and monetary policy.
Rate hikes generally strengthen a currency; rate cuts can weaken it.
Central bank communication (forward guidance) strongly impacts currency expectations.
Institutions like the US Federal Reserve, ECB, RBI, and BOJ shape global currency trends.
4. Interest Rate Differentials and Carry Trades
Investors borrow in low-interest currencies and invest in high-interest ones.
This strategy, called the carry trade, drives large currency movements.
Sudden risk-off events can reverse carry trades, causing sharp volatility.
Understanding rate differentials is key to navigating currency opportunities.
5. Inflation and Purchasing Power
High inflation erodes a currency’s real value.
Countries with stable inflation tend to attract foreign capital.
Purchasing Power Parity (PPP) compares currencies based on cost of living.
Long-term currency trends often reflect inflation differentials across nations.
6. Currency Adventure in Emerging Markets
Emerging market currencies offer higher returns but carry higher risks.
Factors include political stability, current account balance, and foreign debt.
Sudden capital outflows can cause rapid depreciation.
Examples include INR, BRL, ZAR, and TRY reacting sharply to global events.
7. The Dominance of the US Dollar
The US dollar remains the world’s primary reserve currency.
Most global trade, commodities, and debt are dollar-denominated.
Dollar strength affects global liquidity and emerging markets.
However, overreliance on the dollar has sparked diversification efforts.
8. De-Dollarization and Currency Diversification
Countries are increasingly trading in local currencies.
Central banks are diversifying reserves into gold, euros, and yuan.
Regional currency arrangements are gaining attention.
While de-dollarization is gradual, it adds new dimensions to the currency adventure.
9. Impact of Geopolitics on Currencies
Wars, sanctions, and trade conflicts cause currency volatility.
Safe-haven currencies (USD, CHF, JPY) strengthen during crises.
Sanctions can isolate currencies from global systems.
Geopolitics has turned currencies into strategic tools, not just economic units.
10. Currency Wars and Competitive Devaluation
Countries may weaken currencies to boost exports.
Competitive devaluation can lead to retaliatory actions.
This creates instability in global trade and financial markets.
Managing currency competitiveness without triggering wars is a key challenge.
11. Role of Trade Balances and Capital Flows
Trade surplus nations often experience currency appreciation.
Trade deficit nations rely on foreign capital inflows.
Portfolio and FDI flows significantly impact exchange rates.
Sudden shifts in flows can cause sharp currency moves.
12. Technology Transforming the Currency Landscape
Electronic trading platforms increased speed and transparency.
Algorithmic and high-frequency trading amplify short-term volatility.
Retail participation in forex markets has grown globally.
Technology has made currency markets more accessible than ever.
13. Rise of Digital Currencies and CBDCs
Cryptocurrencies challenge traditional monetary systems.
Central Bank Digital Currencies (CBDCs) aim to modernize payments.
Digital currencies may alter cross-border settlements.
This innovation marks a new chapter in the currency adventure.
14. Forex Markets: The World’s Largest Financial Market
Forex markets trade over trillions of dollars daily.
They operate 24 hours across global time zones.
High liquidity offers opportunities but also risks.
Understanding technical and fundamental factors is essential.
15. Currency Volatility: Risk and Opportunity
Volatility creates profit opportunities for traders.
It also increases hedging costs for businesses.
Risk management tools like forwards, futures, and options are crucial.
Successful navigation depends on discipline and strategy.
16. Hedging and Currency Risk Management
Businesses hedge to protect cash flows from exchange rate swings.
Investors hedge to stabilize portfolio returns.
Hedging strategies vary based on time horizon and risk appetite.
Effective hedging is a core skill in the currency journey.
17. Psychological Factors in Currency Markets
Market sentiment often drives short-term movements.
Fear and greed influence currency trends.
News, rumors, and expectations can outweigh fundamentals temporarily.
Understanding behavior adds depth to currency analysis.
18. Currencies and Commodity Linkages
Commodity exporters’ currencies move with commodity prices.
Examples include AUD (metals), CAD (oil), and RUB (energy).
Commodity cycles directly impact exchange rates.
This link adds another layer to currency dynamics.
19. Learning and Adapting in the Currency Adventure
Currency markets constantly evolve with global changes.
Continuous learning is essential for participants.
Combining macroeconomics, policy analysis, and technical tools improves decisions.
Adaptability separates successful navigators from the rest.
20. Conclusion: The Journey Ahead
The global currency system is complex, interconnected, and dynamic.
Economic shifts, technology, and geopolitics ensure constant change.
For traders, investors, and policymakers, the currency adventure truly awaits.
Those who understand the forces at play can turn uncertainty into opportunity.

Understanding the Forces Shaping Worldwide Economies1. Economic Drivers of Market Movements
At the core of global market fluctuations are economic indicators that provide insights into growth, inflation, and employment. Gross Domestic Product (GDP) growth rates, unemployment figures, and consumer spending patterns all influence investor confidence. For instance, when major economies like the United States, China, or the European Union show slower growth, global markets often react negatively, fearing reduced demand for goods and services worldwide. Conversely, strong economic performance in leading nations can boost market sentiment and fuel investment across sectors.
Monetary policies also play a crucial role. Central banks, such as the Federal Reserve or the European Central Bank, control interest rates and money supply. A rate hike to curb inflation can reduce liquidity in markets, affecting stock and bond prices globally. Similarly, quantitative easing or stimulus measures can inject capital into financial systems, boosting asset prices. Exchange rates and currency stability further affect international trade and investments, especially for emerging markets that depend heavily on foreign capital flows.
2. Geopolitical Events and Market Volatility
Global markets are extremely sensitive to geopolitical tensions, including conflicts, sanctions, and trade wars. For example, tensions between major powers can disrupt supply chains, increase commodity prices, and reduce investor confidence. Trade disputes, such as tariffs imposed between countries, directly affect multinational corporations, altering profit expectations and causing stock market fluctuations. Political instability in key regions, such as the Middle East or parts of Africa, can impact oil prices and global energy markets, influencing inflation and production costs worldwide.
Natural disasters and environmental issues are increasingly significant in affecting markets. Hurricanes, floods, or wildfires disrupt production and logistics, affecting commodity supply chains. Climate change concerns drive investment shifts toward sustainable technologies, reshaping global market priorities and creating winners and losers in different sectors.
3. Technological Disruption and Market Adaptation
Technology has transformed global markets, accelerating the pace at which information is disseminated and trades are executed. Innovations in artificial intelligence, blockchain, and financial technologies (FinTech) have created new investment opportunities while also introducing risks. Rapid changes in technology can disrupt traditional industries; for example, renewable energy innovations impact the fossil fuel sector, while automation reshapes manufacturing labor dynamics. Investors react quickly to these shifts, often leading to volatility in global stock exchanges.
Additionally, digital trading platforms and algorithmic trading amplify the speed and scale of market reactions. News spreads globally in seconds, influencing investor behavior and triggering rapid market movements. While these technological advancements increase market efficiency, they also create susceptibility to sudden corrections and speculative bubbles.
4. Globalization and Interconnectedness
One of the defining features of modern markets is globalization. No country’s market operates in isolation. Financial integration means that an economic shock in one nation can have cascading effects worldwide. The 2008 global financial crisis is a prime example: the collapse of the U.S. housing market and financial institutions triggered recessions in Europe, Asia, and beyond. Similarly, a slowdown in China, the world’s manufacturing hub, can affect commodity prices, supply chains, and corporate earnings globally.
Trade networks, investment flows, and multinational corporations link countries economically, while global indices and mutual funds spread exposure across continents. This interconnectedness allows for diversification but also means that systemic risks can propagate quickly.
5. Market Sentiment and Investor Psychology
Investor psychology significantly impacts global markets. Fear, uncertainty, and speculation can lead to sudden sell-offs or bubbles. Market sentiment often amplifies the effect of fundamental events. For instance, even minor geopolitical news can trigger sharp declines if investors perceive risk, while positive economic announcements can fuel rallies. Behavioral finance highlights that emotions, herd behavior, and perception of risk often override rational decision-making, causing markets to react disproportionately.
Media coverage, social networks, and financial news outlets shape market sentiment globally. The instantaneous spread of information allows sentiment to influence international markets simultaneously, creating synchronized movements across regions.
6. Emerging Markets and Their Vulnerability
Emerging markets are particularly vulnerable to global market fluctuations. These economies often rely on exports, foreign investments, and commodity revenues. Changes in global demand, interest rates in developed nations, or capital outflows can destabilize emerging markets’ currencies, stock exchanges, and debt markets. While emerging markets offer high growth potential, they are highly sensitive to global volatility, highlighting the asymmetric impact of global market shocks.
7. The Role of Commodities and Energy Markets
Commodities—oil, metals, agricultural products—are highly sensitive to global market trends. Price fluctuations in these markets affect inflation, corporate costs, and trade balances. Energy markets, particularly oil and gas, are closely tied to geopolitical developments. A disruption in supply due to political conflicts or natural disasters can lead to global price spikes, affecting industries and consumers worldwide. Similarly, agricultural market disruptions can lead to food inflation and social unrest in dependent regions.
8. Strategies for Navigating Global Market Uncertainty
Investors, corporations, and governments employ several strategies to mitigate the impact of market fluctuations. Diversification across regions, sectors, and asset classes reduces exposure to localized shocks. Hedging through derivatives, such as options and futures, allows market participants to manage risk. Central banks and regulatory authorities also intervene with policies to stabilize financial systems during crises.
For businesses, understanding global supply chains, geopolitical risks, and currency exposure is critical. Long-term planning involves scenario analysis, stress testing, and adapting business models to changing global dynamics. Individual investors increasingly focus on sustainable and resilient investments, considering environmental, social, and governance (ESG) factors, which have shown relative stability during turbulent periods.
Conclusion
Global markets are inherently interconnected and influenced by a broad spectrum of economic, political, technological, and environmental factors. Their behavior reflects both tangible indicators, like GDP growth or commodity prices, and intangible forces, such as investor sentiment and geopolitical uncertainty. Understanding these influences is essential for investors, policymakers, and businesses to navigate risks and capitalize on opportunities.
The impact of global market fluctuations extends far beyond stock prices—it affects employment, production, trade, and the overall well-being of societies. As markets become increasingly complex and technology-driven, participants must remain vigilant, adaptable, and informed. Awareness of the intricate forces shaping global markets enables smarter decisions, resilience in the face of volatility, and a proactive approach to both challenges and opportunities in the world economy.

Dark Pools & Institutional Trading TacticsThe Hidden Architecture of Modern Financial Markets
Financial markets appear transparent on the surface, with prices, volumes, and order books visible to retail investors through exchanges like the NSE, NYSE, or NASDAQ. However, beneath this visible layer exists a parallel ecosystem where large institutions trade vast quantities of securities away from public scrutiny. This ecosystem is dominated by dark pools and sophisticated institutional trading tactics. Understanding how these mechanisms work is essential for grasping modern market dynamics, price discovery, and the growing divide between retail and institutional participants.
What Are Dark Pools?
Dark pools are private trading venues where large blocks of securities are traded anonymously without displaying orders on public exchanges. Unlike lit markets, dark pools do not reveal bid-ask quotes or order sizes before execution. The term “dark” refers to the lack of pre-trade transparency, not illegality.
Dark pools were originally created to help institutional investors—such as mutual funds, pension funds, insurance companies, and hedge funds—execute large trades without causing sharp price movements. For example, if a pension fund wants to sell millions of shares of a stock, placing that order on a public exchange would likely push prices down before the trade is completed. Dark pools reduce this market impact.
There are three main types of dark pools:
Broker-dealer owned dark pools (run by investment banks).
Agency broker dark pools (acting as neutral intermediaries).
Exchange-owned dark pools (operated by traditional exchanges as private venues).
Why Institutions Prefer Dark Pools
Institutions prioritize execution quality, cost efficiency, and confidentiality. Dark pools offer several advantages:
Reduced Market Impact: Large trades do not immediately influence public prices.
Lower Transaction Costs: Fewer slippage effects and sometimes reduced fees.
Anonymity: Counterparties do not know who is buying or selling.
Better Average Pricing: Trades often execute at the midpoint of the bid-ask spread.
For long-term investors managing billions of dollars, these benefits can significantly improve portfolio performance.
Institutional Trading Tactics Beyond Dark Pools
Dark pools are only one part of a broader toolkit. Institutional trading relies on highly advanced tactics designed to optimize execution and minimize risk.
1. Algorithmic Trading
Institutions use complex algorithms to break large orders into smaller pieces and execute them over time. Common strategies include:
VWAP (Volume Weighted Average Price): Targets the average price based on market volume.
TWAP (Time Weighted Average Price): Spreads trades evenly over time.
Implementation Shortfall: Minimizes the difference between the decision price and execution price.
These algorithms decide when, where, and how to trade—sometimes routing orders between dark pools and public exchanges dynamically.
2. Order Slicing & Stealth Execution
Instead of placing one massive order, institutions split trades into hundreds or thousands of smaller orders. This tactic disguises true intent and avoids alerting other market participants, especially high-frequency traders (HFTs).
3. Liquidity Seeking Strategies
Institutions actively search for natural counterparties. Smart Order Routers (SORs) scan multiple venues—dark pools, exchanges, and crossing networks—to find the best liquidity at the best price.
4. Block Trading
Block trades involve very large quantities of shares negotiated privately, often through investment banks. These trades may later be reported to exchanges but only after execution.
The Role of High-Frequency Trading (HFT)
High-frequency traders use speed, co-location, and advanced algorithms to profit from tiny price discrepancies. While HFT firms are usually excluded from pure dark pools, their presence influences institutional behavior.
Institutions aim to avoid predatory strategies like:
Front-running: Anticipating large orders.
Latency arbitrage: Exploiting speed advantages.
Order sniffing: Detecting hidden institutional interest.
Dark pools and smart execution algorithms are defensive tools against these risks.
Impact on Price Discovery
One of the biggest debates around dark pools is their effect on price discovery. Since dark pool trades do not display pre-trade information, critics argue that too much trading in the dark weakens the public market’s ability to reflect true supply and demand.
Supporters counter that:
Prices are still ultimately anchored to public exchanges.
Dark pools reduce volatility caused by large institutional orders.
Post-trade reporting ensures regulatory oversight.
In reality, price discovery now occurs across a fragmented market structure, where lit markets and dark venues interact continuously.
Regulatory Oversight & Global Perspective
Regulators closely monitor dark pools due to concerns about fairness and transparency. In the U.S., the SEC enforces rules such as trade reporting requirements and limits on dark pool activity. In Europe, MiFID II introduced caps on dark trading volumes to protect price discovery.
In India, dark pools are far more restricted. SEBI emphasizes transparency and centralized exchanges, limiting the scope of dark trading compared to Western markets. However, institutional block deals and negotiated trades still serve a similar function under regulatory frameworks.
Retail Investors vs Institutions
Retail traders often feel disadvantaged by institutional tactics. Institutions benefit from:
Superior technology
Lower transaction costs
Private liquidity venues
Advanced data analytics
However, retail investors also gain indirectly. Reduced volatility, tighter spreads, and more efficient markets are partly a result of institutional execution strategies. The key difference lies in time horizon—institutions focus on long-term capital deployment, while retail traders often pursue short-term price movements.
Ethical and Market Integrity Concerns
Critics argue that excessive dark trading creates a two-tiered market where institutions enjoy privileges unavailable to ordinary investors. Past scandals involving misleading dark pool practices have reinforced calls for stricter regulation.
Transparency, fair access, and proper disclosure are essential to maintaining trust. Regulators continue to refine rules to balance efficiency with fairness.
The Future of Dark Pools & Institutional Trading
As markets evolve, dark pools are likely to become more technologically sophisticated but also more regulated. Artificial intelligence, machine learning, and real-time analytics will further refine execution strategies. At the same time, regulators may push for increased transparency and tighter limits on off-exchange trading.
Ultimately, dark pools and institutional trading tactics are not anomalies—they are structural responses to scale. As long as institutions manage massive pools of capital, hidden liquidity venues and advanced execution methods will remain a core feature of global financial markets.
Conclusion
Dark pools and institutional trading tactics represent the invisible backbone of modern markets. They enable large investors to operate efficiently, manage risk, and preserve market stability. While they raise valid concerns around transparency and fairness, they also reduce volatility and improve execution quality. For anyone seeking to truly understand how markets function beyond surface-level price charts, dark pools offer a critical window into the silent forces shaping global finance.

Global Finance History: Evolution of Money, Markets, and PowerThe history of global finance is deeply intertwined with the evolution of human civilization. From the earliest systems of barter to today’s complex web of digital currencies, stock exchanges, and global capital flows, finance has shaped economic growth, political power, and social change. Understanding global financial history helps explain how modern markets function, why financial crises recur, and how wealth and influence are distributed across nations.
Early Origins: Barter, Money, and Banking
In ancient societies, economic exchange began with barter—direct trade of goods and services. However, barter was inefficient due to the “double coincidence of wants.” To overcome this, early civilizations introduced money in the form of commodities such as cattle, grains, shells, and precious metals. Around 600 BCE, the Lydians (in modern-day Turkey) minted the first standardized coins, marking a turning point in financial history.
Ancient Mesopotamia and Egypt laid the foundations of banking. Temples and palaces acted as financial centers, accepting deposits, extending loans, and keeping records. The Code of Hammurabi (circa 1750 BCE) included laws regulating interest rates and debt, highlighting the early importance of financial regulation.
Classical and Medieval Finance
In ancient Greece and Rome, financial systems expanded alongside trade and empire-building. Money changers, maritime loans, and early forms of insurance supported long-distance commerce. Rome developed sophisticated taxation and public finance systems, funding infrastructure and military expansion. However, the collapse of the Roman Empire led to economic fragmentation in Europe.
During the medieval period, global finance re-emerged through trade networks connecting Europe, the Middle East, Africa, and Asia. Islamic civilizations played a crucial role, advancing credit instruments such as checks (sakk), bills of exchange, and partnership contracts. These innovations later influenced European banking.
Italian city-states like Venice, Florence, and Genoa became financial powerhouses between the 12th and 15th centuries. Merchant banks financed trade, governments, and wars. The Medici Bank, for example, pioneered double-entry bookkeeping, a system still fundamental to modern accounting.
The Rise of Capitalism and Financial Markets
The early modern period marked the transition from mercantilism to capitalism. European exploration and colonial expansion created global trade routes and massive capital flows. Joint-stock companies such as the Dutch East India Company (VOC) and the British East India Company allowed investors to pool capital and share risk, a major milestone in financial innovation.
The first stock exchange emerged in Amsterdam in the early 17th century, enabling the trading of shares and bonds. This period also saw the development of government debt markets, as states borrowed to finance wars and expansion. Central banking began to take shape with institutions like the Bank of England (founded in 1694), which helped stabilize government finances and manage currency.
Industrial Revolution and Modern Finance
The Industrial Revolution of the 18th and 19th centuries transformed global finance. Rapid industrialization required large-scale investment in factories, railways, and infrastructure. Banks, stock markets, and bond markets expanded to meet these needs. Financial centers such as London and later New York emerged as global hubs of capital.
Gold became the backbone of the international monetary system. Under the gold standard, currencies were pegged to a fixed amount of gold, promoting stability in exchange rates and international trade. However, this system also limited governments’ ability to respond to economic shocks.
20th Century: Crises, Regulation, and Globalization
The 20th century was marked by extreme financial volatility and institutional reform. World War I disrupted the gold standard, and the Great Depression of the 1930s exposed weaknesses in unregulated financial markets. Massive bank failures and stock market crashes led governments to intervene more actively in finance.
In response, new regulatory frameworks emerged. The United States introduced banking reforms, while globally the Bretton Woods system (established in 1944) created institutions such as the International Monetary Fund (IMF) and the World Bank. The US dollar became the world’s reserve currency, pegged to gold, while other currencies were pegged to the dollar.
From the 1970s onward, the collapse of Bretton Woods led to floating exchange rates. Financial globalization accelerated as capital controls were lifted, technology advanced, and multinational banks expanded. Derivatives, hedge funds, and complex financial instruments grew rapidly, increasing both efficiency and risk.
The Digital Age and Contemporary Finance
The late 20th and early 21st centuries ushered in the digital revolution in finance. Electronic trading, online banking, and real-time global markets transformed how money moves across borders. Financial innovation brought benefits such as efficiency and inclusion but also new vulnerabilities.
The global financial crisis of 2008 was a defining moment, revealing systemic risks in interconnected financial systems. Governments and central banks responded with unprecedented monetary stimulus and tighter regulations. Since then, issues like sovereign debt, inequality, and financial stability have remained central concerns.
Today, global finance is evolving again with the rise of fintech, cryptocurrencies, central bank digital currencies (CBDCs), and sustainable finance. Emerging markets play a larger role, while geopolitical tensions increasingly influence capital flows and monetary policy.
Conclusion
Global financial history is a story of innovation, expansion, crisis, and reform. Each era built upon the successes and failures of the past, shaping today’s complex financial system. By understanding this history, policymakers, investors, and citizens can better navigate modern financial challenges and anticipate future transformations in the global economy.

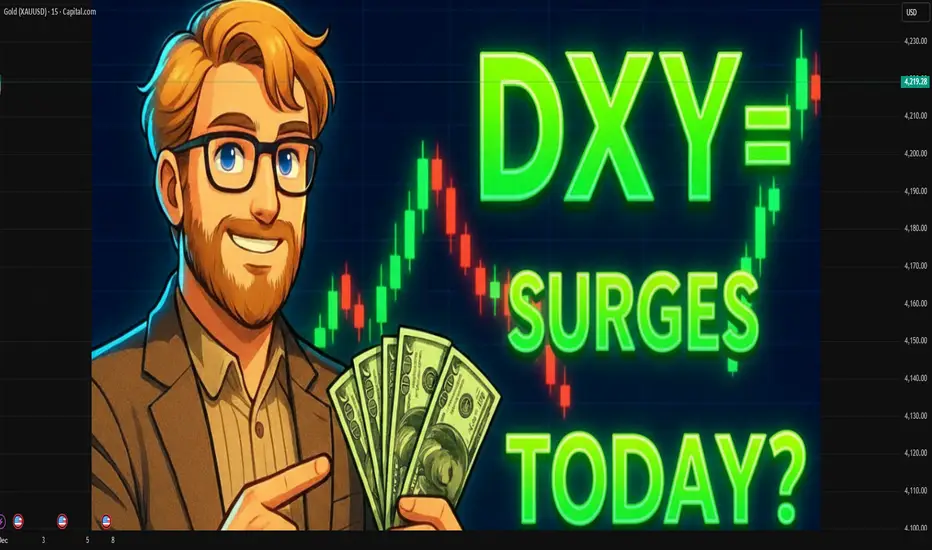
DXY Surges Explained1. What a DXY Surge Means
A surge in the DXY means the U.S. dollar is strengthening. This strengthening can come from:
Growing confidence in the U.S. economy
Rising U.S. interest rates
Investors seeking safety from global risks
Weakness in other major currencies
Changes in global trade flows
Shifts in central bank policies
When the DXY rises, it often signals that money around the world is flowing into the United States—either for safety, return on investment, or both.
2. Interest Rates: The Primary Driver of DXY Surges
The most influential factor behind a DXY surge is U.S. interest rates. The Federal Reserve has enormous influence on the dollar, as its decisions determine whether global investors find U.S. assets attractive.
Why Higher Rates Boost the Dollar
Higher rates increase the yield on U.S. Treasury bonds.
Investors around the world buy these bonds because they are considered safe and profitable.
To buy U.S. assets, investors must first convert their local currency to dollars.
This surge in demand strengthens the dollar and pushes the DXY upward.
Even expectations of future rate hikes can push the DXY higher. Traders often react not only to actual policy changes, but also to hints from the Federal Reserve.
3. Safe-Haven Demand During Uncertainty
The U.S. dollar is the world’s leading safe-haven asset. When global uncertainty rises—whether due to economic downturns, geopolitical tensions, war, or financial instability—investors flock to the dollar.
Examples of situations that cause safe-haven flows:
Global recessions
Banking crises
Declines in stock markets
Political instability in major economies
Currency crises in emerging markets
During such times, investors search for stability, and they often find it in U.S. Treasuries and other dollar-denominated assets. This buying pressure causes surges in the DXY.
4. Weakness in Other Currencies Helps Push the DXY Up
Because the DXY measures the dollar’s strength relative to other currencies, weakness in those currencies automatically pushes the index higher.
The Euro’s Role
The euro has the largest weight in the index—around 57%.
Therefore, when the euro weakens due to:
Slow European economic growth
Divergent interest rates
Political challenges
Energy crises
…the DXY often rises significantly.
The Japanese Yen Factor
The yen also plays a major role. When the Bank of Japan keeps interest rates low while the U.S. raises rates, investors shift funds into the dollar, causing the DXY to surge.
5. U.S. Economic Strength and Global Confidence
A strong U.S. economy typically results in a stronger dollar. Economic indicators that support a DXY surge include:
Higher GDP growth
Strong employment numbers
Rising consumer spending
Increasing business investment
Robust corporate earnings
These indicators attract global investors to U.S. assets such as stocks, bonds, and real estate. As foreign investors buy these assets, demand for dollars increases, pushing the DXY upward.
6. Global Trade and Dollar Demand
The U.S. dollar dominates international trade. Over 80% of global transactions, commodities, and trade settlements involve the dollar. This creates a structural, persistent demand for dollars.
Why global trade boosts the DXY:
Countries hold dollar reserves to pay for imports like oil, machinery, and technology.
Most global commodities—including gold, oil, and natural gas—are priced in dollars.
During periods of high commodity demand, nations often increase their dollar reserves.
All of this creates momentum for the DXY to strengthen when global trade dynamics shift.
7. Impact of DXY Surges on Global Markets
A. Impact on Commodities
When the dollar strengthens, commodities like oil, gold, silver, and metals generally become more expensive for buyers using other currencies. As a result, commodity prices often fall when the DXY surges.
B. Impact on Emerging Markets
DXY surges create challenges for emerging markets:
Their currencies weaken
Dollar-denominated debt becomes more expensive to repay
Foreign investment outflows increase
Import costs rise
Some nations experience financial stress during strong dollar periods.
C. Impact on U.S. Corporations
A stronger dollar can hurt U.S. exporters because their products become more expensive internationally. Companies such as technology firms, industrial manufacturers, and consumer goods exporters often feel the pressure of a rising DXY.
8. Market Psychology and Speculative Trading
Financial markets react not just to economic data, but also to sentiment and speculation. Traders in the forex market often accelerate moves in the DXY by:
Betting on future interest rate changes
Reacting to central bank statements
Anticipating geopolitical shifts
Speculating on currency volatility
When sentiment aligns strongly toward a stronger dollar, DXY surges can become sharp and rapid.
9. Are DXY Surges Long-Lasting or Short-Term?
DXY surges can be:
Short-term
Driven by market speculation, sudden news events, or temporary crises.
Long-term
Driven by structural trends such as:
Prolonged interest rate cycles
Shifting global trade patterns
Long-term weakness in other currencies
Robust U.S. economic outperformance
The duration of a surge depends on the underlying forces.
Conclusion
A DXY surge reflects a combination of economic strength, monetary policy decisions, global risk sentiment, and comparative currency performance. When the index rises, it signals confidence in the U.S. economy, but also can indicate stress in global markets. The effects are far-reaching: commodities tend to fall, emerging markets can struggle, and U.S. exporters may face headwinds. Yet for investors seeking safety and stable returns, a surging dollar is often a sign of global capital flowing into the United States.
Understanding why the DXY surges helps traders, policymakers, and investors navigate global markets with greater clarity and insight.
ETFs and Index Trading1. What Are ETFs?
An Exchange-Traded Fund (ETF) is an investment fund that trades on stock exchanges just like individual shares. It pools money from multiple investors and invests in a basket of assets such as:
Stocks
Bonds
Commodities
Currencies
A combination of multiple asset classes
An ETF aims to track the performance of a specific index, sector, commodity, or theme. For example:
Nifty 50 ETF tracks the Nifty 50 index
S&P 500 ETF tracks the S&P 500
Gold ETF tracks gold prices
Bank ETF tracks banking sector stocks
Because ETFs trade like stocks, you can buy and sell them throughout market hours at real-time prices.
2. Key Features of ETFs
A. Diversification
Instead of buying many stocks individually, investors get instant diversification through one ETF.
For example, a Nifty ETF gives exposure to 50 major Indian companies at once.
B. Liquidity
ETFs can be bought and sold anytime during market hours. Their liquidity depends on the trading volume and the liquidity of underlying assets.
C. Low Cost
ETFs usually have lower expense ratios than mutual funds, mainly because most are passively managed.
D. Transparency
ETFs disclose their portfolios daily, so investors know exactly what they own.
E. Flexibility
Investors can use ETFs for:
Long-term investment
Short-term trading
Hedging
Sector rotation
Commodity exposure
3. Types of ETFs
A. Equity ETFs
Track stock indices such as:
Nifty 50
Sensex
S&P 500
Nasdaq 100
B. Bond ETFs
Invest in government or corporate bonds. These offer lower volatility and predictable income.
C. Commodity ETFs
Track commodities such as gold, silver, crude oil, and natural gas.
D. Sector and Thematic ETFs
Focused on specific sectors like:
Banking
Pharma
IT
Or themes like:
EV (Electric Vehicles)
Renewable energy
Digital technology
E. International ETFs
Provide exposure to global markets without currency complications.
F. Leveraged and Inverse ETFs
Used mainly by advanced traders:
Leveraged ETFs amplify index returns (2x or 3x)
Inverse ETFs move opposite to index direction
4. How ETFs Work
An ETF is created through a process involving:
Asset Management Company (AMC)
Authorized Participants (APs)
Market Makers
The AMC creates ETF units by assembling a portfolio of securities that replicate an index. APs ensure that ETF price stays close to the NAV by arbitrage.
5. What Is Index Trading?
Index trading involves buying and selling financial instruments that track major stock indices like:
Nifty 50
Bank Nifty
Sensex
S&P 500
Dow Jones
Nasdaq 100
Instead of trading individual stocks, traders speculate on overall market direction using:
Index Futures
Index Options
ETFs
Index Contracts for Difference (CFDs) in global markets
Index trading allows exposure to the broad market with a single trade.
6. Why Index Trading Is Popular
A. Reduced Stock-Specific Risk
Indices represent a basket of stocks; poor performance of one stock doesn't drastically affect the entire index.
B. High Liquidity
Major indices have extremely high trading volumes, ensuring smooth entry and exit.
C. Stable Price Movements
Indices are generally less volatile than individual stocks (though instruments like Bank Nifty can still be volatile).
D. Easy to Analyze
Indices react more to macro factors like:
GDP data
Inflation
Interest rates
Global market trends
This makes them easier to study compared to hundreds of stocks.
E. Ideal for Derivatives Trading
Most option traders prefer index options such as:
Nifty options
Bank Nifty options
FINNIFTY options
These contracts have:
Better liquidity
Lower manipulation
More reliable directional moves
7. ETFs vs Index Funds vs Index Trading
ETFs
Trade on exchanges
Real-time price changes
Good for traders and long-term investors
Index Funds
Work like mutual funds
Bought and sold at NAV
No intraday trading
Index Trading
Uses futures and options
More suited for active traders
High leverage
Higher risk
8. Strategies Using ETFs and Index Trading
A. Long-Term Wealth Building Using ETFs
Investors use:
Nifty 50 ETF
S&P 500 ETF
Nasdaq 100 ETF
for 10–20 year wealth creation.
Benefits include:
High return potential
Low cost
Passive investment
B. Short-Term Trading
Traders buy or sell ETFs based on:
Breakouts
Moving averages
RSI or MACD signals
Example:
Buy Nifty ETF when it breaks above 200-day moving average.
C. Hedging
If traders hold a portfolio of Indian stocks, they hedge by shorting:
Nifty futures
Bank Nifty futures
Inverse ETFs (outside India)
This protects against market crashes.
D. Sector Rotation
Traders switch between sector ETFs based on economic conditions:
Banking ETF during interest rate cuts
IT ETF when currency weakens
Pharma ETF during global uncertainty
E. Options Trading Strategies
Index options allow strategies like:
Straddle
Strangle
Iron Condor
Bull Call Spread
Bear Put Spread
These strategies help traders manage volatility and risk.
9. Risks in ETFs and Index Trading
A. Market Risk
ETFs reflect the broader market; if markets fall, ETF values fall.
B. Tracking Error
Sometimes ETFs do not perfectly replicate index movements due to:
Costs
Liquidity issues
Management inefficiencies
C. Liquidity Risk
Some thematic ETFs have low trading volumes.
D. Leverage Risk
Leveraged ETFs and index futures can magnify losses.
E. Volatility Risk
Index options traders face sudden moves due to global events.
10. Who Should Use ETFs and Index Trading?
ETFs Are Ideal For:
Long-term investors
Beginners
Those seeking diversification
Passive investors
Index Trading Is Ideal For:
Active traders
Options and futures traders
Short-term speculators
Hedge fund strategies
Conclusion
ETFs and index trading combine simplicity, diversification, liquidity, and flexibility—making them essential tools in modern financial markets. ETFs allow low-cost, long-term investment with broad exposure, while index trading offers high-efficiency strategies for short-term traders and professionals. Whether someone wants to invest passively for decades or actively trade market movements, understanding ETFs and index trading provides a strong foundation for smarter financial decisions.

Trends You Must Know1. Artificial Intelligence and Automation
Artificial Intelligence (AI) continues to dominate global technological advancements. AI-driven solutions are transforming industries ranging from healthcare to finance, logistics, and marketing. Machine learning algorithms can analyze massive datasets to provide insights, detect patterns, and automate decision-making. In business, AI-powered chatbots, virtual assistants, and predictive analytics tools are becoming indispensable for efficiency and customer engagement.
Automation extends beyond digital processes into physical systems. Robotics and smart manufacturing have revolutionized production lines, improving productivity while reducing human error. The growing adoption of AI in creative industries, like AI-generated content, design, and music, is redefining the boundaries of human-machine collaboration. For professionals, understanding AI trends and developing AI literacy has become crucial.
2. Green Technology and Energy Transition
Climate change concerns are accelerating the shift toward renewable energy and sustainable technologies. Governments and corporations are heavily investing in solar, wind, hydro, and hydrogen energy. Energy storage solutions, like next-generation batteries, are crucial for mitigating the intermittent nature of renewables.
Electric vehicles (EVs) are another hallmark of this trend. Automotive giants and startups alike are transitioning from internal combustion engines to fully electric fleets. Beyond transport, green technology extends to sustainable agriculture, water management, and circular economy models where waste is minimized, and resources are reused efficiently.
Companies that adopt sustainable practices often gain market credibility, attract investment, and comply with tightening environmental regulations. For consumers, supporting green products is both a personal choice and a statement on social responsibility.
3. Digital Currency and Blockchain Technology
Cryptocurrencies and blockchain technology have moved from speculative assets to core components of global finance. Central Bank Digital Currencies (CBDCs) are being explored by multiple countries as a means of faster, more secure, and transparent financial transactions. Cryptocurrencies, despite volatility, continue to influence global markets, especially in decentralized finance (DeFi) applications like lending, borrowing, and smart contracts.
Blockchain technology extends beyond finance. Supply chain management, healthcare records, intellectual property, and voting systems are being reimagined with decentralized, tamper-proof ledgers. Understanding blockchain trends is critical for businesses seeking security, transparency, and efficiency in a connected world.
4. Remote Work and the Future of Work
The COVID-19 pandemic permanently altered the work landscape. Remote work, hybrid offices, and digital nomadism are no longer temporary arrangements but standard practices in many sectors. Organizations are adopting digital collaboration tools, cloud platforms, and virtual meeting technologies to support distributed teams.
Alongside this, skills development is evolving. There’s a rising emphasis on digital literacy, adaptability, creativity, and emotional intelligence. AI and automation are also reshaping job roles, eliminating repetitive tasks while creating demand for high-level cognitive skills. Employees and organizations must continuously upskill to remain competitive.
5. Health and Wellness Revolution
The health and wellness industry is undergoing significant transformation. Personalized healthcare, driven by genomics, AI diagnostics, and wearable devices, is empowering individuals to monitor and manage their health proactively. Telemedicine has made healthcare accessible beyond traditional clinic walls, especially in remote areas.
Mental health awareness has gained unprecedented recognition. Companies are investing in employee well-being programs, and wellness apps offering meditation, sleep tracking, and stress management are booming. Nutrition, fitness, and preventive medicine are now integral to lifestyle choices, reflecting a global shift toward holistic health management.
6. Data Privacy and Cybersecurity
As digitalization increases, so does the threat of cyberattacks and data breaches. Consumers and regulators are demanding greater accountability for how personal information is collected, stored, and used. Laws like GDPR in Europe and similar regulations worldwide have raised the stakes for data privacy compliance.
Cybersecurity trends include AI-driven threat detection, zero-trust architectures, and blockchain-based security solutions. Organizations that fail to prioritize cybersecurity risk reputational damage, financial loss, and regulatory penalties. Being aware of these trends helps businesses and individuals protect sensitive information in an interconnected world.
7. Social Media Evolution and Content Consumption
Social media platforms continue to evolve, influencing communication, marketing, politics, and culture. Video content, short-form stories, and live streaming dominate user engagement. Platforms leveraging AI for personalized recommendations enhance content discoverability but also raise concerns about algorithmic biases and misinformation.
Influencer marketing, creator economies, and subscription-based content models are redefining digital entrepreneurship. Brands and individuals must adapt to constantly changing algorithms, user behaviors, and monetization models to stay relevant.
8. Global Economic Shifts and Geopolitics
The global economy is undergoing significant transformations. Emerging markets are growing faster than developed economies, creating new opportunities and risks. Currency fluctuations, trade wars, and supply chain disruptions highlight the importance of geopolitical awareness for businesses and investors.
The de-dollarization trend, with countries exploring alternatives to the US dollar for international trade, signals a possible shift in global financial dominance. Understanding macroeconomic trends, international relations, and regional power dynamics is vital for making informed business and investment decisions.
9. Education and Lifelong Learning
Education is no longer confined to classrooms. Online platforms, micro-credentials, and skill-based courses are democratizing learning worldwide. AI-driven personalized learning systems are improving engagement and outcomes, while virtual and augmented reality tools are making immersive education possible.
Lifelong learning is becoming a necessity rather than a choice. Rapid technological changes require individuals to continuously acquire new skills to remain employable and competitive. Understanding the evolving educational landscape is critical for students, professionals, and educators alike.
10. Cultural and Lifestyle Trends
Cultural shifts influence consumer behavior, workplace dynamics, and social interactions. Minimalism, conscious consumption, and the pursuit of experiences over material possessions are gaining traction. The global rise of diverse and inclusive representation in media, fashion, and corporate policies reflects a broader societal trend toward equity and awareness.
Travel, entertainment, and leisure industries are also evolving with digital experiences, augmented reality gaming, and metaverse explorations. Being aware of cultural and lifestyle trends helps businesses align their offerings with the values and expectations of modern consumers.
Conclusion
Staying ahead of trends is crucial for individuals, businesses, and governments in a world defined by rapid technological, economic, and cultural shifts. From AI and green technology to digital currencies, health innovations, and global economic transformations, these trends are reshaping how we live, work, and interact. Those who understand and adapt to these changes are more likely to thrive in a complex, interconnected future. Knowledge of trends isn’t just about keeping up—it’s about positioning oneself strategically in a world of constant evolution.

Global Economy Shifts1. Multipolarity and the Rebalancing of Global Power
For decades, the global economy operated under a largely unipolar structure led by the United States and its Western allies. Today, this dominance is fading as new economic blocs rise. Emerging markets—most notably China, India, Southeast Asia, the Middle East, and Africa—are becoming engines of global growth.
Rise of Asia
Asia now contributes more than half of global economic growth. China remains the world’s second-largest economy despite slowing growth, while India is emerging as the fastest-growing major economy, driven by demographics, domestic consumption, and digital infrastructure.
Shift Toward Regional Blocs
Increasing geopolitical tensions between the U.S. and China have accelerated the formation of economic blocs:
BRICS+ expansion has brought new resource-rich members.
Regional trade agreements such as RCEP and CPTPP are reshaping Asia-Pacific integration.
The European Union, despite internal challenges, is investing in strategic autonomy, green energy, and advanced manufacturing.
This move toward multipolarity is redefining investment flows, supply chains, and diplomatic alignments.
2. Technological Transformation and the Digital Economy
Technology is the most powerful force reshaping global economic structures. The accelerating adoption of AI, automation, robotics, and digital platforms is altering productivity, labor markets, and competitive advantages.
Artificial Intelligence as a Growth Catalyst
AI is transforming sectors such as finance, healthcare, logistics, and manufacturing. Countries that invest heavily in AI—like the U.S., China, and South Korea—are gaining competitive edges.
Digital Infrastructure Expansion
Digital connectivity has become the backbone of national competitiveness. Innovations such as:
5G and upcoming 6G networks
Cloud computing
Quantum technologies
Blockchain and digital payments
are enabling new business models. Digital public infrastructure (DPI), led by India’s UPI, Aadhaar, and ONDC, is becoming a blueprint for emerging markets.
Techno-Economic Fragmentation
However, technology is also driving global fragmentation:
Competing semiconductor supply chains
Restrictions on data flows
Tech-related sanctions
Global technology standards may split into competing spheres, creating challenges for multinational corporations.
3. Geopolitical Conflicts and De-Risking of Supply Chains
Conflicts such as the Russia–Ukraine war, Middle East instability, and U.S.–China tensions have triggered a significant rethinking of global supply chains.
From Globalization to “De-Risking”
Countries are not fully de-globalizing, but they are diversifying away from single-source dependencies. This has led to:
Nearshoring (e.g., U.S. companies shifting production to Mexico)
Friendshoring (production moving among geopolitical allies)
China+1 strategy (India, Vietnam, Indonesia as beneficiaries)
Resilience Over Efficiency
Companies are prioritizing:
Multi-location manufacturing
Strategic stockpiling
Strengthening logistics networks
Supply chains are becoming more regional and networked, reducing vulnerability to shocks.
4. Green Transition and the Economics of Climate Change
Climate change is reshaping policymaking and investment decisions. Governments and corporations are transitioning toward low-carbon economies, driving structural changes across energy, transportation, manufacturing, and agriculture.
Shift Toward Clean Energy
Renewables—solar, wind, hydro, hydrogen—are experiencing massive investment. Nations like China lead in solar manufacturing, Europe in wind technology, and the Middle East in green hydrogen.
Electric Vehicle (EV) Transformation
EV adoption is accelerating globally, forcing:
Auto companies to redesign supply chains
Battery manufacturers to secure critical mineral sources
Governments to provide subsidies and carbon regulations
Climate-Resilient Infrastructure
Rising temperatures and extreme weather events require substantial investment in resilient infrastructure, influencing fiscal priorities worldwide.
5. Demographic Changes and Labor Market Evolution
Demographics play a critical role in shaping economic potential.
Aging Economies
Developed nations—Japan, South Korea, much of Europe, and even China—face aging populations, shrinking workforces, and rising healthcare burdens. This leads to:
Lower long-term growth
Higher fiscal pressure
Increased need for automation and immigration
Youthful Economies
In contrast, India, Africa, and parts of Southeast Asia have young populations and rapidly urbanizing societies. These countries will be key drivers of global labor supply and consumer demand in coming decades.
Future of Work
Automation and AI will redefine jobs across sectors. While high-skilled workers benefit from rising productivity, low-skilled jobs face displacement. Upskilling, remote work, and gig economy platforms are altering labor structures.
6. Shifts in Global Trade, Currency, and Finance
Global trade patterns are being reshaped by:
Tariffs and trade barriers
Sanctions
New trade agreements
Carbon border taxes
Changing Currency Dynamics
While the U.S. dollar remains dominant, alternative currency arrangements are gaining traction:
BRICS countries exploring settlement in local currencies
Digital currencies and central bank digital currencies (CBDCs)
Bilateral trade agreements bypassing the dollar
Although the dollar’s dominance will not end soon, its relative share is gradually declining.
Capital Flow Reconfiguration
Investments are moving into:
Resilient supply chains
Green energy
Technology hubs
Emerging markets
Sovereign wealth funds, especially from the Middle East, are playing a major role in global capital allocation.
7. Consumer Behavior and Market Transformations
Consumers are shifting their preferences due to technological access, environmental awareness, and rising incomes.
Key trends include:
Increased digital consumption
Demand for sustainable products
Rapid growth of e-commerce and online services
Preference for personalized and subscription-based models
Emerging market middle classes—especially in India, Indonesia, and Africa—are becoming major contributors to global consumption growth.
Conclusion: A Transformative Decade Ahead
The global economy is transitioning through a period of deep structural change. Multipolarity, technological acceleration, shifting demographics, climate imperatives, and geopolitical tensions are transforming how nations trade, innovate, and grow.
The next decade will be defined by adaptability. Countries and companies that invest in technology, diversify supply chains, embrace sustainability, and harness human capital will emerge as winners. As economic power diffuses and the global order evolves, agility and resilience will shape the new world economy.

CADJPY 5Min Setup - Trade Invalidation ExampleThe Strategy:
We execute trades after key levels are tested and fail to hold.
When price breaks a high but buyers show no conviction (no follow-through), this signals weakness. A sell becomes valid.
When price breaks a low but sellers show no conviction, a buy becomes valid once the entry setup confirms.
Trade Invalidation - The Most Critical Rule:
Every mechanical strategy MUST have clear invalidation criteria.
As long as your setup remains valid, you hold your expectation. The moment it invalidates, you either close the trade or don't enter at all. No exceptions.
Today's Example:
The CADJPY 5-minute chart showed a potential setup that became INVALIDATED before entry could be taken. This is exactly how mechanical trading protects your capital—knowing when NOT to trade is just as important as knowing when to trade.
If you found this helpful, give us a thumbs up! 👍

US30 Technical Analysis 1 Hour chart 📉 US30 Technical Analysis (1H Chart)
US30 is currently trading at 45,936 and remains inside a well-defined descending channel, showing strong bearish momentum.
• Trend: Price broke below the previous support (around 46,105 – 46,133) and retested it as resistance, confirming bearish continuation.
• Entry Zone: The rejection candle around the retest zone suggests sellers are still in control.
• Target Levels:
• First support: 45,911
• Next bearish target zone: 45,774 – 45,590 (lower channel support)
• Invalidation: A clean break and 1H close above 46,133 would invalidate the bearish setup and open room for bullish correction.
👉 Bias remains bearish as long as price stays under 46,100. Short-term downside continuation expected toward 45,700 – 45,600.

Think in Probabilities, Trade Like a Champion⚡ Probabilistic Thinking in Trading Psychology: Accepting Losses as Part of the Game
Trading psychology separates successful traders from those the market eliminates. In Forex and Gold trading, many lose not because their strategy is weak but because they fail to accept the reality of probability. Every trade is just one sample in a long statistical series—nothing more, nothing less.
🧠 1. Each Trade Is a Brick, Not a Verdict
A system with a 60% win rate sounds impressive. But that percentage only matters over a large number of trades. For individual trades, the outcome is random.
Example: An MMFLOW trader places 100 trades, risking 1% per position. After losing 6 in a row, he remains calm: “These are just 6 steps in a 1,000-step journey.”
During NFP news, Gold drops 300 pips. An inexperienced trader abandons their plan after two stop-loss hits. A professional sticks to the system because probability needs time to show its edge.
📊 2. A Losing Streak Doesn’t Mean Your System Is Broken
Even a 60% win-rate strategy can experience 5–7 consecutive losses. That’s the ruthless yet fair nature of probability. Traders without probabilistic thinking panic, break discipline, or abandon their edge prematurely.
Example: A breakout system shows long-term profitability. After 10 trades, it loses 7 times. A weak-minded trader quits. A seasoned trader stays the course and wins 20 out of the next 30 trades—recovering all losses and more.
🚀 3. Applying Probabilistic Thinking to Forex/Gold Trading
Rock-solid risk management: Risk no more than 1–2% per trade to survive losing streaks.
Long-term evaluation: Judge your system after 50–100 trades, not just a handful.
Non-negotiable discipline: Set stop-loss/take-profit and walk away—emotions don’t press “Close.”
Trading journal: Record outcomes and emotions to identify cognitive biases.
Warrior mindset: Losses are entry fees to the market, not personal failures.
💪 4. The MMFLOW Trading Mindset – Decisive and Unshakable
The market doesn’t care whether you win or lose. The only thing that matters is keeping your statistical edge long enough to let it work. Professionals:
Stay calm through losing streaks.
Refuse to “revenge trade” when emotions flare.
Stick to the plan because 500 trades will speak louder than 5.
📈 5. Conclusion – Mastering Trading Psychology
In Forex and Gold, probabilistic thinking is the shield that protects your mindset. Accepting losses as part of the game helps you:
Reduce emotional pressure and avoid impulsive decisions.
Maintain discipline and effective risk management.
Leverage your system’s long-term edge for sustainable account growth.

GBPUSD - Trade Plan Heading into NY SessionTaking a look at GBPUSD on the 1 hour timeframe, I'm expecting to see a retest of around the 1.35 handle. Once price action reaches that zone, I'll simply be looking to implement my scaling short sell strategy. I'll likely enable my Expert Advisor for MT5 to manage this trade.

Gold (XAU/USD) Targets $3,397 – $3,406 Amid Bullish MomentumAnalysis:
The 4H chart of Gold (XAU/USD) shows strong bullish momentum after a corrective phase. Price has broken above consolidation and is currently trading around $3,382, with upside targets at $3,397 and $3,406 (highlighted resistance zone).
The supply zone on the higher timeframe remains intact below $3,280, acting as a long-term support.
Immediate support levels lie at $3,371, $3,356, and $3,348. A break below these could shift momentum bearish.
Current bullish structure suggests that as long as price holds above $3,371, buyers may drive the price higher toward the resistance levels.
A rejection from $3,406 may lead to a pullback toward the mid-support zone before another attempt higher.

What Is a Pyramiding Strategy, and How Does It Work in Trading?What Is a Pyramiding Strategy, and How Does It Work in Trading?
Pyramiding is a trading strategy where traders gradually increase their position size as the market moves in their favour. Instead of committing full capital upfront, they add to winning positions at key levels. This article explains how pyramiding works, common strategies, potential risks, and key considerations for traders looking to add it to their trading approach.
What Is Pyramiding?
Pyramiding is a strategy where traders gradually add to an effective position instead of going all in from the start. It’s used in trending markets, where traders look to take advantage of sustained price movements by expanding their exposure as the trend develops. The key difference between pyramiding and simply increasing position size at the outset is that pyramiding limits initial risk. Instead of committing full capital upfront, traders build up their position only when the market moves in their favour.
Applying a pyramid to a position is particularly common in markets with strong momentum. A trader, for example, might start with one unit of an asset and, if the price moves favourably, add another half-unit at a predefined level. If the trend continues, they might add another quarter-unit. This gradual scaling means more capital is committed only when conditions confirm the trend.
The logic behind pyramiding in trading is straightforward: when the market is moving in the right direction, the strategy compounds potential returns without significantly increasing initial risk. It also allows traders to adjust their exposure based on market conditions rather than relying on a single entry.
However, pyramiding only works well when executed with clear rules on when to add positions, how much to increase by, and where to adjust risk parameters. Without a structured approach, adding to positions can lead to overexposure, especially if the market reverses. Understanding how to manage this risk is essential, which is why different pyramiding methods exist—each with its own risk-reward profile.
Is Pyramiding the Same as a Forex Pyramid Scheme?
No, pyramiding is a legitimate trading strategy, while a forex trading pyramid scheme is a fraudulent investment model. Pyramiding involves adding to winning trades in a structured manner, whereas pyramid schemes rely on recruiting new investors, often with unrealistic return promises and no genuine market activity.
Common Types of the Pyramiding Strategy
Traders use different types of pyramiding strategies depending on their risk tolerance, market conditions, and trading style. The core idea remains the same—adding to a position as the market moves favourably—but the way additional positions are sized can significantly impact potential risk and returns.
Fixed-Percentage Pyramiding
With this approach, traders add a set percentage of their initial position each time they scale in. For example, if the first position is 1 lot, the next might be 50% of it (0.5 lots), and the next 50% of it (0.25 lots). This method reduces sequential risk exposure with each additional entry, preventing the position from growing too aggressively. It is popular in markets where trends can extend for long periods but aren’t always smooth.
Fixed-Size Pyramiding
Here, traders add the same amount to their position at each entry point. If they start with 1 lot, they continue adding 1 lot at each predetermined level. This method increases exposure more quickly than fixed-percentage pyramiding and is commonly used by traders confident in strong, sustained trends. However, it also carries more risk—if the trend reverses, a larger position is at stake.
Scaled Pyramiding
In this strategy, the size of each additional position decreases as the trade progresses. A trader might start with 1 lot, then add 0.75 lots, then 0.5 lots, and so on. The idea is to lock in potential returns while still participating in the trend, limiting risk as the position grows. This approach is useful when traders want to take advantage of strong momentum but remain cautious about overexposure.
Aggressive Pyramiding
Aggressive traders may add increasingly larger positions as the trade moves in their favour. For example, starting with 1 lot, then adding 1.5 lots, then 2 lots. This approach amplifies potential returns quickly but also significantly increases risk. If the market reverses, the largest position is the most vulnerable.
How Pyramiding Works in Practice
Pyramiding isn’t just about adding to a trade—it requires a structured approach. Traders who use this strategy typically follow a clear set of conditions to determine when and how to scale into a position. These conditions revolve around trend identification, entry levels, risk control, and adjustments based on price action.
1. Identifying a Strong Trend
Pyramiding is used in clear trends, where the price moves consistently in one direction without frequent reversals. Traders often use moving averages, trendlines, or higher highs and higher lows to confirm momentum before considering additional positions. A market that chops sideways or lacks volume makes pyramiding riskier, as price movements can be inconsistent.
2. Setting Initial Risk and Position Size
Before adding to a position, traders determine how much of their total risk they’re willing to allocate. Many use a percentage of their account size to calculate exposure, so they don’t take on too much risk too soon. For example, a trader might start with 1% of their capital at risk and adjust as the trade progresses.
3. Choosing Levels to Add Positions
Entries are usually added at logical technical levels, such as:
- Breakouts of key resistance levels (for long positions) or support levels (for short positions).
- Fibonacci retracements, where price temporarily pulls back before continuing in the trend direction.
- Pullbacks to moving averages, such as the 50-day or 200-day moving average.
4. Adjusting Stop Losses and Managing Risk
As new positions are added, traders adjust stop-loss levels to protect against reversals. Some move stops to breakeven once the trade gains momentum, while others trail stops behind higher lows (in an uptrend) or lower highs (in a downtrend).
Example of a Pyramid in Action
A trader enters a forex trade with 1 lot after a breakout. As the price moves 2% higher, they add 0.5 lots at the next resistance break. After another upward movement, they add 0.25 lots. Their stop loss is adjusted upwards each time, reducing risk. If the price reverses, they lock in potential returns rather than losing their initial position.
Challenges of Pyramiding and How to Deal With Them
Using pyramiding as a trading strategy can be an effective way to scale into trades, but it introduces unique risks that require careful management. While adding to a strong trend can potentially boost returns, it also increases exposure, magnifies losses in reversals, and requires disciplined execution.
1. Increased Exposure in Volatile Markets
One of the biggest risks of pyramid trading is overexposure. As a position grows, so does the potential downside. A sharp market reversal can wipe out potential accumulated gains or lead to a larger-than-expected drawdown. This is particularly challenging in high-volatility conditions, where price swings can occur more often.
Traders who use pyramiding are mindful of position sizing. Instead of doubling exposure with each entry, some reduce position sizes incrementally, so that later additions carry less weight. This prevents a single-price move from turning a strong trade into a major loss.
2. Liquidity and Slippage Issues
Adding to a position in low-liquidity conditions can result in slippage, where orders get filled at worse prices than expected. This often happens in after-hours stock trading, near the end of trading sessions, or during high-impact news events when order book depth is thin.
In fast-moving markets, slippage can cause later pyramid entries to execute at increasingly unfavourable levels. This not only raises the average entry price but also increases the risk if the trend fails. Traders focused on managing execution risk often monitor liquidity before scaling in to check if market conditions allow them to place trades efficiently.
3. Overleveraging and Margin Pressure
Leverage amplifies both potential returns and losses. In pyramid trading, each new entry raises margin requirements. If a leveraged position expands too aggressively, a sudden price move against it can trigger margin calls or forced liquidations before the trade has a chance to recover.
Managing leverage effectively means maintaining a controlled risk-per-trade allocation rather than committing too much capital to additional entries. Many traders assess account exposure relative to market conditions and adjust position growth accordingly.
4. False Trends and Market Reversals
Not all breakouts sustain momentum. An asset might briefly break through resistance, triggering pyramiding entries, only to reverse sharply. If a trader misreads the strength of a trend, they could end up adding to a losing position rather than a winning one.
A structured approach to trend confirmation can help avoid premature entries. Instead of reacting to every breakout, traders often rely on higher timeframe trends, price structure, and volume confirmation to assess whether momentum is sustainable.
5. Poor Stop-Loss Placement
One of the most common mistakes is failing to adjust stop losses properly. If stop losses are too tight, the trader might exit too early. If they’re too loose, losses can escalate quickly.
A common adjustment is trailing stop-losses that move in line with price swings, locking in potential returns while allowing for continued trend movement. Some traders move stops to breakeven after the second entry, while others adjust based on key technical levels.
6. Psychological Pressure
Scaling into a position changes the psychological dynamics of trading. A growing trade size can lead to emotional decision-making, such as exiting too soon out of fear of losing accumulated potential returns or overtrading in an attempt to maximise potential gains.
Having a structured plan before entering a pyramiding trade can help mitigate these pressures. Clear predefined entry, stop, and exit strategies ensure that decisions are made based on analysis rather than emotion.
The Bottom Line
Pyramiding allows traders to take advantage of strong trends by gradually increasing position size while managing risk. When used with a structured approach, it can potentially enhance returns. However, overleveraging is very common, and discipline and risk control are essential when using this approach.
FAQ
What Is the Pyramiding Method?
Pyramiding is a trading strategy where traders gradually increase their position size as the market moves in their favour. Instead of entering a full position at once, they add to it at predetermined levels, typically in a trending market. The goal is to take advantage of momentum while helping to manage initial risk exposure.
What Is the Pyramid Scheme Strategy?
A pyramid scheme is a fraudulent business model that relies on recruiting new participants rather than generating actual revenue. It has nothing to do with pyramiding in trading. In pyramid schemes, early participants take advantage of the investments of later recruits, making the model unsustainable. These schemes often collapse when recruitment slows, leaving most participants at a loss.
What Is an Example of Pyramid Trading?
A trader buys 100 shares of a stock at £50. As the price rises to £55, they add 50 more shares. At £60, they add 25 more. Their position grows only when the trend confirms itself, potentially limiting early risk.
How to Do a Pyramid in Stocks?
Traders typically add positions at breakout levels, retracements, or trendline bounces, adjusting stop losses to lock in potential returns while potentially mitigating risk.
This article represents the opinion of the Companies operating under the FXOpen brand only. It is not to be construed as an offer, solicitation, or recommendation with respect to products and services provided by the Companies operating under the FXOpen brand, nor is it to be considered financial advice.
XAUUSD Bullish Continuation Setup? Gold (XAU/USD) – 1H Technical Outlook
Price action on the hourly chart is developing within a well-defined ascending channel, supported by dynamic trendlines that have consistently provided higher highs (HH) and higher lows (HL), confirming the underlying bullish structure.
The Key Support and Resistance Zone around 3,330–3,350 USD has proven to be a pivotal area, acting as both a consolidation base and a springboard for bullish impulses. The most recent Multi-Confluence Support and Pivot Area aligns with dynamic channel support, reinforcing its technical significance.
Volume Profile (Flow Profile) data remains overall bearish, indicating that a majority of trading activity has occurred at lower levels. However, the profile is beginning to exhibit early signs of accumulation, which often precedes directional reversals in market sentiment.
From a structural perspective, maintaining price action above the 3,328–3,350 USD support range would sustain the bullish bias, with upside potential toward Channel High Resistance near 3,400 USD, and an extended target into the Target Area around 3,420 USD.
Conversely, a decisive break below the Invalidation Zone (~3,310 USD) would undermine the bullish channel structure, increasing the probability of a deeper retracement.
Outlook:
Bias: Bullish continuation, contingent on support holding.
Key Support: 3,328–3,350 USD
Immediate Resistance: ~3,400 USD
Primary Target: ~3,420 USD
Invalidation Level: ~3,310 USD
This setup suggests that, while buyers retain structural control, confirmation from price action and volume behavior will be critical in validating the next bullish leg.

THE KOG REPORT THE KOG REPORT:
In last week’s KOG Report we said we would be looking for the price to spike down into potentially the extension level 3310 and then give us the tap and bounce we wanted to be able to capture the long trade in to the 3345-50 region initially. It was those higher resistance levels that we said we would stick with and the bias was bearish below. This move resulted in a decent long trade upside into the region we wanted, and then the decline we witnessed mid-week completing all of our bearish target levels which were shared with everyone.
On top of that, we got the bounce we wanted for the long trade but only back up into the 3335 level which was an Excalibur active target. The rest, we just sat and watched on Friday as unless we were already in the move, the only thing we could have done is get in with the volume, which isn’t a great idea with the limited pull backs.
All in all, a great week in Camelot not only on Gold, but also the other pairs we trade with the DAX swing trade being a point to point swing move executed with precision by the team.
So, what can we expect in the week ahead?
We’ll keep it simple again this week but will say this, there seems we may see a curveball on the way this week. With tariff news over the weekend we may see price open across the markets with gaps, one thing we will say is if you see these gaps, don’t gap chase until you see a clean reversal!
We have the higher level here of 3375-85 resistance and lower support here 3350-45. If support holds on open we may see that push upside into the red box which is the one that needs to be monitored. Failure to breach can result in a correction all the way back down into the 3335 level initially. Again, this lower support level is the key level for this week and needs to be monitored for a breach which should then result in a completed correction of the move.
Our volume indicators are suggesting a higher high can take place here and if we do get a clean reversal we should see this pull back deeply. As usual we will follow the strategy that has been taught and let Excalibur guide the way.
KOG’s bias for the week:
Bullish above 3350 with targets above 3360, 3373, 3375 and 3383 for now
Bearish below 3350 with targets below 3340, 3335, 3329, 3320 and 3310 for now
RED BOX TARGETS:
Break above 3365 for 3372, 3375, 3382, 3390 and 3406 in extension of the move
Break below 3350 for 3340, 3335, 3329, 3322 and 3310 in extension of the move
It’s a HUGE RANGE this week so play caution, wait for the right set ups, don’t treat it like it’s your every day market condition. News from Tuesday so expect Monday to be choppy!
Please do support us by hitting the like button, leaving a comment, and giving us a follow. We’ve been doing this for a long time now providing traders with in-depth free analysis on Gold, so your likes and comments are very much appreciated.
As always, trade safe.
KOG

GBPUSD Week 29 Swing Zone/LevelsAfter 7 straight weeks of profitable gold trading, we’re shifting gears to GBPUSD.
Why this pair? It’s offering a classic low-risk, high-reward setup that many traders appreciate:
🔒 Stop Loss: 10–15 pips
🎯 Take Profit: 50–100 pips
We’re analyzing price action using a simple but powerful concept:
Each zone is drawn based on how the high and low of one day compares with the next. For example:
Monday’s high/low vs Tuesday’s range
Tuesday’s vs Wednesday’s, and so on
This method helps spot potential continuation zones as market structure unfolds across the week.
👉 The key? Patience, and letting the levels tell the story.
As always price action determines trades

Market next move 🔍 Disrupting the Original Bullish Bias
The original analysis assumes a bullish reversal from the support zone aiming for a resistance target near $3,360. However, let’s challenge that with an alternate (bearish or neutral) perspective:
---
⚠️ 1. Support May Not Hold
Price has tested the support zone multiple times, increasing the probability of a breakdown.
Repeated testing weakens support levels; a breakdown below $3,280 could trigger panic selling or stop-loss hunts, accelerating the drop.
---
📉 2. Bearish Momentum is Dominant
The overall trend is downward, with lower highs and lower lows.
The current bounce could be a dead cat bounce — a short-lived recovery before another drop.
---
📊 3. Volume Analysis
There's no significant bullish volume spike at the support, which weakens the bullish thesis.
This suggests lack of strong buying interest, a red flag for bullish continuation.
---
🔄 4. Resistance May Hold Strong
The resistance area around $3,360 has shown previous strong rejections.
Even if price rises, it could stall or reverse before reaching the target.

Market next target 🚀 Bullish Disruption Analysis
1. Support Holds Above 35.80
The market may dip slightly but find strong support around the 35.90–36.00 zone.
Instead of continuing lower, buyers absorb the selling pressure, leading to a sharp bullish reversal.
2. Bullish Continuation After Consolidation
The current pullback could just be a healthy retracement following the strong recovery move from the previous dip.
This could form a bullish flag or ascending triangle, eventually breaking above 36.20 and pushing higher.
3. Volume Clue
If the pullback happens with declining red volume, while previous green candles had strong volume, it signals a temporary correction rather than a trend reversal.
Watch for a bullish engulfing candle backed by strong volume to confirm.
4. Macro Trigger / Fundamental Support
Any dovish signal from the Fed, rising inflation, or weakening USD could increase investor demand for silver, pushing prices back up.
A news-driven reversal could invalidate the bearish path quickly.
5. Bullish Price Target
If buyers take control, silver could retest and break above 36.30–36.40, aiming toward 36.60 or even 36.80.
