Understanding the Forces Shaping Worldwide Economies1. Economic Drivers of Market Movements
At the core of global market fluctuations are economic indicators that provide insights into growth, inflation, and employment. Gross Domestic Product (GDP) growth rates, unemployment figures, and consumer spending patterns all influence investor confidence. For instance, when major economies like the United States, China, or the European Union show slower growth, global markets often react negatively, fearing reduced demand for goods and services worldwide. Conversely, strong economic performance in leading nations can boost market sentiment and fuel investment across sectors.
Monetary policies also play a crucial role. Central banks, such as the Federal Reserve or the European Central Bank, control interest rates and money supply. A rate hike to curb inflation can reduce liquidity in markets, affecting stock and bond prices globally. Similarly, quantitative easing or stimulus measures can inject capital into financial systems, boosting asset prices. Exchange rates and currency stability further affect international trade and investments, especially for emerging markets that depend heavily on foreign capital flows.
2. Geopolitical Events and Market Volatility
Global markets are extremely sensitive to geopolitical tensions, including conflicts, sanctions, and trade wars. For example, tensions between major powers can disrupt supply chains, increase commodity prices, and reduce investor confidence. Trade disputes, such as tariffs imposed between countries, directly affect multinational corporations, altering profit expectations and causing stock market fluctuations. Political instability in key regions, such as the Middle East or parts of Africa, can impact oil prices and global energy markets, influencing inflation and production costs worldwide.
Natural disasters and environmental issues are increasingly significant in affecting markets. Hurricanes, floods, or wildfires disrupt production and logistics, affecting commodity supply chains. Climate change concerns drive investment shifts toward sustainable technologies, reshaping global market priorities and creating winners and losers in different sectors.
3. Technological Disruption and Market Adaptation
Technology has transformed global markets, accelerating the pace at which information is disseminated and trades are executed. Innovations in artificial intelligence, blockchain, and financial technologies (FinTech) have created new investment opportunities while also introducing risks. Rapid changes in technology can disrupt traditional industries; for example, renewable energy innovations impact the fossil fuel sector, while automation reshapes manufacturing labor dynamics. Investors react quickly to these shifts, often leading to volatility in global stock exchanges.
Additionally, digital trading platforms and algorithmic trading amplify the speed and scale of market reactions. News spreads globally in seconds, influencing investor behavior and triggering rapid market movements. While these technological advancements increase market efficiency, they also create susceptibility to sudden corrections and speculative bubbles.
4. Globalization and Interconnectedness
One of the defining features of modern markets is globalization. No country’s market operates in isolation. Financial integration means that an economic shock in one nation can have cascading effects worldwide. The 2008 global financial crisis is a prime example: the collapse of the U.S. housing market and financial institutions triggered recessions in Europe, Asia, and beyond. Similarly, a slowdown in China, the world’s manufacturing hub, can affect commodity prices, supply chains, and corporate earnings globally.
Trade networks, investment flows, and multinational corporations link countries economically, while global indices and mutual funds spread exposure across continents. This interconnectedness allows for diversification but also means that systemic risks can propagate quickly.
5. Market Sentiment and Investor Psychology
Investor psychology significantly impacts global markets. Fear, uncertainty, and speculation can lead to sudden sell-offs or bubbles. Market sentiment often amplifies the effect of fundamental events. For instance, even minor geopolitical news can trigger sharp declines if investors perceive risk, while positive economic announcements can fuel rallies. Behavioral finance highlights that emotions, herd behavior, and perception of risk often override rational decision-making, causing markets to react disproportionately.
Media coverage, social networks, and financial news outlets shape market sentiment globally. The instantaneous spread of information allows sentiment to influence international markets simultaneously, creating synchronized movements across regions.
6. Emerging Markets and Their Vulnerability
Emerging markets are particularly vulnerable to global market fluctuations. These economies often rely on exports, foreign investments, and commodity revenues. Changes in global demand, interest rates in developed nations, or capital outflows can destabilize emerging markets’ currencies, stock exchanges, and debt markets. While emerging markets offer high growth potential, they are highly sensitive to global volatility, highlighting the asymmetric impact of global market shocks.
7. The Role of Commodities and Energy Markets
Commodities—oil, metals, agricultural products—are highly sensitive to global market trends. Price fluctuations in these markets affect inflation, corporate costs, and trade balances. Energy markets, particularly oil and gas, are closely tied to geopolitical developments. A disruption in supply due to political conflicts or natural disasters can lead to global price spikes, affecting industries and consumers worldwide. Similarly, agricultural market disruptions can lead to food inflation and social unrest in dependent regions.
8. Strategies for Navigating Global Market Uncertainty
Investors, corporations, and governments employ several strategies to mitigate the impact of market fluctuations. Diversification across regions, sectors, and asset classes reduces exposure to localized shocks. Hedging through derivatives, such as options and futures, allows market participants to manage risk. Central banks and regulatory authorities also intervene with policies to stabilize financial systems during crises.
For businesses, understanding global supply chains, geopolitical risks, and currency exposure is critical. Long-term planning involves scenario analysis, stress testing, and adapting business models to changing global dynamics. Individual investors increasingly focus on sustainable and resilient investments, considering environmental, social, and governance (ESG) factors, which have shown relative stability during turbulent periods.
Conclusion
Global markets are inherently interconnected and influenced by a broad spectrum of economic, political, technological, and environmental factors. Their behavior reflects both tangible indicators, like GDP growth or commodity prices, and intangible forces, such as investor sentiment and geopolitical uncertainty. Understanding these influences is essential for investors, policymakers, and businesses to navigate risks and capitalize on opportunities.
The impact of global market fluctuations extends far beyond stock prices—it affects employment, production, trade, and the overall well-being of societies. As markets become increasingly complex and technology-driven, participants must remain vigilant, adaptable, and informed. Awareness of the intricate forces shaping global markets enables smarter decisions, resilience in the face of volatility, and a proactive approach to both challenges and opportunities in the world economy.
Forextarget

Inflation, Deflation & Cost-Push Pressures1. Inflation: Meaning, Causes, and Effects
Inflation refers to a sustained increase in the general price level of goods and services over time. When inflation occurs, each unit of currency buys fewer goods and services, leading to a decline in purchasing power. Moderate inflation is often considered a sign of a healthy, growing economy, but excessive inflation can destabilize economic systems.
Types of Inflation
Demand-Pull Inflation
This occurs when aggregate demand exceeds aggregate supply. Strong consumer spending, increased government expenditure, or rapid credit growth can push prices upward.
Cost-Push Inflation
Prices rise because production costs increase, forcing firms to pass those costs onto consumers. This is discussed in detail later.
Built-in (Wage-Price) Inflation
Higher wages increase production costs, which raise prices. Rising prices then lead workers to demand higher wages, creating a self-reinforcing cycle.
Effects of Inflation
Positive Effects (when moderate):
Encourages spending and investment rather than hoarding cash.
Reduces the real burden of debt.
Signals growing economic activity.
Negative Effects (when high or unpredictable):
Erodes savings and fixed incomes.
Increases uncertainty for businesses and investors.
Distorts price signals and resource allocation.
Can lead to social unrest and inequality.
Central banks typically aim for low and stable inflation (around 2%) to balance growth and price stability.
2. Deflation: Meaning, Causes, and Effects
Deflation is a sustained decrease in the general price level of goods and services. While falling prices may appear beneficial to consumers initially, deflation is often associated with economic weakness and can lead to prolonged recessions.
Causes of Deflation
Weak Aggregate Demand
Reduced consumer spending, declining investment, or fiscal austerity can push prices down.
Excess Supply
Overcapacity in industries or technological advancements can lower production costs faster than demand grows.
Tight Monetary Conditions
Reduced money supply or restricted credit availability can suppress spending.
Debt Deflation
High debt levels force consumers and businesses to cut spending to repay loans, further depressing prices.
Effects of Deflation
Delayed Consumption: Consumers postpone purchases expecting lower prices.
Rising Real Debt Burden: Debt becomes harder to repay as incomes fall.
Lower Business Profits: Falling prices reduce revenues, discouraging investment.
Higher Unemployment: Companies cut costs by reducing wages or jobs.
Deflation can create a deflationary spiral, where falling prices lead to lower demand, lower incomes, and further price declines. This is why central banks aggressively counter deflation using monetary stimulus.
3. Cost-Push Pressures: Definition and Key Drivers
Cost-push pressures refer to rising input costs that force producers to increase prices to maintain profit margins. Unlike demand-driven inflation, cost-push inflation originates from the supply side of the economy.
Major Sources of Cost-Push Pressures
Rising Commodity Prices
Increases in oil, gas, metals, or agricultural prices raise transportation, energy, and raw material costs.
Wage Increases
Labor shortages, minimum wage hikes, or strong union bargaining can raise wage costs, especially in labor-intensive industries.
Supply Chain Disruptions
Geopolitical conflicts, pandemics, trade restrictions, or logistical bottlenecks can increase production and delivery costs.
Currency Depreciation
A weaker currency makes imports more expensive, raising costs for businesses dependent on foreign inputs.
Higher Taxes and Regulations
Increased corporate taxes, environmental regulations, or compliance costs can be passed on to consumers.
4. Relationship Between Inflation, Deflation, and Cost-Push Pressures
Cost-push pressures are a specific cause of inflation, but they do not always lead to sustained inflation. Their impact depends on demand conditions and policy responses.
If demand is strong, firms can easily pass higher costs to consumers, resulting in inflation.
If demand is weak, firms may absorb higher costs through lower profit margins, potentially slowing growth or triggering layoffs.
Persistent cost-push pressures combined with weak growth can lead to stagflation—a situation of high inflation and low economic growth.
In contrast, deflation usually reflects insufficient demand, excess capacity, or financial stress rather than rising costs. However, aggressive attempts to fight deflation through stimulus can, if mismanaged, later contribute to inflationary pressures.
5. Role of Central Banks and Governments
Policymakers play a critical role in managing inflation, deflation, and cost-push pressures.
Monetary Policy
To control inflation: Central banks raise interest rates, reduce liquidity, and tighten credit.
To fight deflation: They cut interest rates, inject liquidity, and encourage borrowing and spending.
Fiscal Policy
Governments can use subsidies, tax cuts, or public spending to offset cost pressures or stimulate demand.
Structural reforms and supply-side investments help reduce long-term cost-push risks.
Effective coordination between monetary and fiscal policy is essential to maintain price stability without harming growth.
6. Implications for Businesses, Investors, and Consumers
Businesses must manage input costs, pricing strategies, and supply chains to protect margins.
Investors adjust portfolios based on inflation expectations, favoring real assets during inflation and defensive assets during deflation.
Consumers face changing purchasing power, borrowing costs, and savings returns depending on price trends.
Understanding these dynamics allows economic participants to make informed decisions under varying macroeconomic conditions.
Conclusion
Inflation, deflation, and cost-push pressures are interconnected forces that shape the economic environment. Inflation reflects rising prices and reduced purchasing power, deflation signals declining demand and economic stress, and cost-push pressures highlight the role of rising production costs in driving price changes. While moderate inflation is often desirable, extreme inflation or deflation can severely damage economic stability. Effective policy management, resilient supply chains, and balanced demand-supply conditions are essential to maintain price stability and sustainable economic growth.

Global Finance History: Evolution of Money, Markets, and PowerThe history of global finance is deeply intertwined with the evolution of human civilization. From the earliest systems of barter to today’s complex web of digital currencies, stock exchanges, and global capital flows, finance has shaped economic growth, political power, and social change. Understanding global financial history helps explain how modern markets function, why financial crises recur, and how wealth and influence are distributed across nations.
Early Origins: Barter, Money, and Banking
In ancient societies, economic exchange began with barter—direct trade of goods and services. However, barter was inefficient due to the “double coincidence of wants.” To overcome this, early civilizations introduced money in the form of commodities such as cattle, grains, shells, and precious metals. Around 600 BCE, the Lydians (in modern-day Turkey) minted the first standardized coins, marking a turning point in financial history.
Ancient Mesopotamia and Egypt laid the foundations of banking. Temples and palaces acted as financial centers, accepting deposits, extending loans, and keeping records. The Code of Hammurabi (circa 1750 BCE) included laws regulating interest rates and debt, highlighting the early importance of financial regulation.
Classical and Medieval Finance
In ancient Greece and Rome, financial systems expanded alongside trade and empire-building. Money changers, maritime loans, and early forms of insurance supported long-distance commerce. Rome developed sophisticated taxation and public finance systems, funding infrastructure and military expansion. However, the collapse of the Roman Empire led to economic fragmentation in Europe.
During the medieval period, global finance re-emerged through trade networks connecting Europe, the Middle East, Africa, and Asia. Islamic civilizations played a crucial role, advancing credit instruments such as checks (sakk), bills of exchange, and partnership contracts. These innovations later influenced European banking.
Italian city-states like Venice, Florence, and Genoa became financial powerhouses between the 12th and 15th centuries. Merchant banks financed trade, governments, and wars. The Medici Bank, for example, pioneered double-entry bookkeeping, a system still fundamental to modern accounting.
The Rise of Capitalism and Financial Markets
The early modern period marked the transition from mercantilism to capitalism. European exploration and colonial expansion created global trade routes and massive capital flows. Joint-stock companies such as the Dutch East India Company (VOC) and the British East India Company allowed investors to pool capital and share risk, a major milestone in financial innovation.
The first stock exchange emerged in Amsterdam in the early 17th century, enabling the trading of shares and bonds. This period also saw the development of government debt markets, as states borrowed to finance wars and expansion. Central banking began to take shape with institutions like the Bank of England (founded in 1694), which helped stabilize government finances and manage currency.
Industrial Revolution and Modern Finance
The Industrial Revolution of the 18th and 19th centuries transformed global finance. Rapid industrialization required large-scale investment in factories, railways, and infrastructure. Banks, stock markets, and bond markets expanded to meet these needs. Financial centers such as London and later New York emerged as global hubs of capital.
Gold became the backbone of the international monetary system. Under the gold standard, currencies were pegged to a fixed amount of gold, promoting stability in exchange rates and international trade. However, this system also limited governments’ ability to respond to economic shocks.
20th Century: Crises, Regulation, and Globalization
The 20th century was marked by extreme financial volatility and institutional reform. World War I disrupted the gold standard, and the Great Depression of the 1930s exposed weaknesses in unregulated financial markets. Massive bank failures and stock market crashes led governments to intervene more actively in finance.
In response, new regulatory frameworks emerged. The United States introduced banking reforms, while globally the Bretton Woods system (established in 1944) created institutions such as the International Monetary Fund (IMF) and the World Bank. The US dollar became the world’s reserve currency, pegged to gold, while other currencies were pegged to the dollar.
From the 1970s onward, the collapse of Bretton Woods led to floating exchange rates. Financial globalization accelerated as capital controls were lifted, technology advanced, and multinational banks expanded. Derivatives, hedge funds, and complex financial instruments grew rapidly, increasing both efficiency and risk.
The Digital Age and Contemporary Finance
The late 20th and early 21st centuries ushered in the digital revolution in finance. Electronic trading, online banking, and real-time global markets transformed how money moves across borders. Financial innovation brought benefits such as efficiency and inclusion but also new vulnerabilities.
The global financial crisis of 2008 was a defining moment, revealing systemic risks in interconnected financial systems. Governments and central banks responded with unprecedented monetary stimulus and tighter regulations. Since then, issues like sovereign debt, inequality, and financial stability have remained central concerns.
Today, global finance is evolving again with the rise of fintech, cryptocurrencies, central bank digital currencies (CBDCs), and sustainable finance. Emerging markets play a larger role, while geopolitical tensions increasingly influence capital flows and monetary policy.
Conclusion
Global financial history is a story of innovation, expansion, crisis, and reform. Each era built upon the successes and failures of the past, shaping today’s complex financial system. By understanding this history, policymakers, investors, and citizens can better navigate modern financial challenges and anticipate future transformations in the global economy.

Understanding Currency ConvertibilityWhat is Currency Convertibility?
Currency convertibility refers to the ease with which a country’s currency can be converted into foreign currencies without restrictions imposed by the government or central bank. When a currency is fully convertible, individuals, businesses, and investors can freely exchange it for another currency for any purpose—trade, travel, investment, or capital transfers.
For example, if an Indian exporter earns US dollars, currency convertibility determines whether and how easily those dollars can be converted into Indian rupees or reinvested abroad. Similarly, foreign investors assess convertibility before investing, as it affects their ability to repatriate profits and capital.
Why Currency Convertibility Matters
Currency convertibility is not just a technical financial concept; it has broad economic implications:
Facilitates International Trade
Convertibility allows exporters and importers to settle cross-border transactions smoothly, reducing friction in global trade.
Encourages Foreign Investment
Investors prefer countries where profits and capital can be freely repatriated, making convertible currencies more attractive.
Integrates Economies Globally
Convertibility helps integrate domestic financial markets with global markets, improving efficiency and competitiveness.
Signals Economic Confidence
A convertible currency often reflects confidence in a country’s economic fundamentals and monetary stability.
Types of Currency Convertibility
Currency convertibility is broadly classified into three main types:
1. Current Account Convertibility
This allows free exchange of currency for transactions related to trade in goods and services, remittances, interest payments, and tourism. Most countries, including India, have current account convertibility.
Example:
An Indian student paying tuition fees abroad or an exporter receiving payment in foreign currency falls under current account transactions.
2. Capital Account Convertibility
Capital account convertibility permits free movement of capital across borders for investments such as foreign direct investment (FDI), portfolio investment, real estate purchases, and loans.
This form is more sensitive because unrestricted capital flows can expose economies to volatility. Hence, many developing nations impose partial controls.
Example:
An Indian investor buying foreign stocks without limits would require full capital account convertibility.
3. Full Convertibility
A currency is fully convertible when both current and capital account transactions are unrestricted. Major global currencies like the US Dollar, Euro, British Pound, and Japanese Yen are fully convertible.
Partial vs Full Convertibility
Many emerging economies adopt partial convertibility as a balanced approach. Under this system:
Trade and service-related transactions are liberalized.
Capital flows are regulated through limits, approvals, or sector-specific controls.
This allows countries to enjoy the benefits of globalization while safeguarding against sudden capital flight and financial instability.
Advantages of Currency Convertibility
Boosts Trade and Exports
Easier currency exchange reduces transaction costs and improves competitiveness of exporters.
Attracts Foreign Capital
Convertible currencies signal openness and stability, attracting FDI and portfolio investments.
Improves Resource Allocation
Capital flows to sectors with higher returns, increasing overall economic efficiency.
Enhances Financial Market Development
Convertibility encourages deeper bond, equity, and forex markets.
Strengthens Global Integration
Countries with convertible currencies participate more actively in global financial systems.
Risks and Challenges of Currency Convertibility
Despite its advantages, currency convertibility also carries significant risks:
Capital Flight Risk
Sudden withdrawal of foreign capital during economic or political instability can destabilize the economy.
Exchange Rate Volatility
Free capital flows can lead to sharp currency fluctuations, affecting trade and inflation.
Loss of Monetary Control
Central banks may find it harder to control money supply and interest rates under full convertibility.
Exposure to Global Shocks
Global financial crises can quickly transmit to domestic markets through capital flows.
Speculative Attacks
Weak economies with open capital accounts may face speculative pressure on their currencies.
Currency Convertibility and Developing Economies
For developing countries, currency convertibility is a strategic decision rather than a binary choice. Gradual liberalization is often preferred to ensure:
Strong banking systems
Adequate foreign exchange reserves
Fiscal discipline
Stable inflation
India, for instance, adopted current account convertibility in the 1990s while cautiously liberalizing the capital account. This phased approach helped balance growth with stability.
Role of Central Banks and Governments
Central banks play a vital role in managing currency convertibility by:
Regulating foreign exchange markets
Managing reserves
Monitoring capital flows
Intervening during excessive volatility
Governments complement this by maintaining sound fiscal policies, regulatory oversight, and transparent financial systems.
Currency Convertibility in the Era of Globalization
With globalization, digital payments, and cross-border investments, currency convertibility has become even more relevant. However, recent trends show that even advanced economies may impose temporary controls during crises, highlighting that convertibility is dynamic and policy-driven rather than absolute.
Conclusion
Understanding currency convertibility is essential for grasping how modern economies function in a globalized world. It influences trade, investment, exchange rates, and financial stability. While full convertibility offers greater integration and efficiency, it also exposes economies to external risks. Therefore, the optimal level of convertibility depends on a country’s economic strength, financial maturity, and policy preparedness.
A well-managed convertibility framework—supported by strong institutions, prudent regulation, and sound macroeconomic policies—can serve as a powerful engine for sustainable growth and global economic participation.

Carry Trade Profits in the Global Market1. Fundamentals of Carry Trade
The carry trade is essentially a form of arbitrage. Traders exploit the differences in interest rates between countries to generate profit. Typically, investors borrow money in a currency considered “cheap” — usually from countries with low-interest rates like the Japanese yen (JPY) or the Swiss franc (CHF) — and convert it into a currency with higher interest rates, such as the Australian dollar (AUD), New Zealand dollar (NZD), or emerging market currencies like the Brazilian real (BRL) or Turkish lira (TRY).
The profitability of carry trades comes in two forms:
Interest Rate Differential (Carry): The primary profit is derived from the interest rate spread between the funding currency and the target currency. For instance, if an investor borrows 1 million JPY at an interest rate of 0.1% and invests in AUD at 5%, the net interest profit before costs is substantial, particularly on leveraged positions.
Currency Appreciation: In addition to the interest rate differential, carry trade profits can be enhanced if the higher-yielding currency appreciates against the funding currency. This combination of yield and potential capital gains makes carry trade highly attractive during periods of global economic stability and low volatility.
2. Mechanics of the Carry Trade
Carry trades are typically executed through foreign exchange (FX) markets. The process involves:
Funding Position: Borrowing a currency with low-interest rates, often through short-term instruments like FX swaps, forward contracts, or interbank loans.
Investment Position: Converting the borrowed funds into a higher-yielding currency and investing in instruments such as government bonds, corporate bonds, or high-interest savings accounts denominated in that currency.
Leverage Utilization: Many carry trades employ leverage to magnify returns. Borrowing multiple times the invested capital can substantially increase profits, though it also escalates risk.
The net profit is calculated as the difference between the earned interest and the cost of borrowing, adjusted for currency fluctuations and transaction costs.
3. Historical Context and Global Examples
Historically, carry trades gained prominence in the late 20th and early 21st centuries when global financial markets became increasingly integrated. The Japanese yen became the quintessential funding currency due to Japan’s long-standing low-interest-rate policies. For example, in the early 2000s, investors borrowed cheap yen to invest in Australian and New Zealand assets, reaping significant profits from both interest rate differentials and currency appreciation.
Emerging market currencies have also been frequent targets for carry trades. High yields in countries like Brazil, Mexico, and South Africa attracted global capital inflows, driving short-term currency strength. Similarly, during periods of monetary easing in developed economies, the differential widened, boosting carry trade attractiveness.
4. Profitability Drivers
Several factors determine carry trade profitability:
Interest Rate Differentials: Larger differentials increase potential returns. Central bank policies directly impact these spreads. For example, aggressive rate hikes in emerging markets can widen the gap with developed markets’ low rates, fueling carry trade activity.
Currency Stability: Stable currencies reduce the risk of adverse exchange rate movements, making the strategy more predictable.
Global Liquidity: Ample liquidity in global markets facilitates smooth execution of carry trades, lowering transaction costs.
Investor Sentiment and Risk Appetite: Carry trades tend to thrive in risk-on environments. Investors’ willingness to seek higher returns in emerging markets or higher-yield currencies directly influences profitability.
5. Risks Associated with Carry Trades
Despite their profitability, carry trades are inherently risky due to leverage and exposure to multiple market factors:
Currency Risk: A sudden depreciation of the target currency against the funding currency can quickly erase interest gains. For instance, if the Australian dollar falls against the yen, the initial investment converts back into fewer yen, causing losses.
Interest Rate Risk: Unexpected central bank decisions can reverse the interest rate advantage, reducing or eliminating carry trade profits.
Market Volatility: Financial crises or geopolitical events can trigger rapid unwinding of carry trades, leading to sharp losses. The 2008 global financial crisis exemplified this, as leveraged carry trades collapsed, causing massive currency swings.
Liquidity Risk: In times of market stress, exiting positions can be costly due to reduced liquidity, amplifying losses.
Professional traders mitigate these risks through hedging strategies, stop-loss orders, and diversification across multiple currency pairs and maturities.
6. Modern Developments in Carry Trades
In recent years, the carry trade landscape has evolved due to changes in monetary policy, technological advancements, and global market dynamics:
Low-Interest Rate Environment: Prolonged low rates in developed economies have compressed traditional interest rate differentials, reducing carry trade opportunities.
Algorithmic Trading: Automated strategies and algorithmic trading systems now dominate carry trade execution, improving efficiency but also increasing susceptibility to rapid market corrections.
Emerging Market Volatility: While high-yield currencies remain attractive, political instability and economic shocks introduce heightened risk, demanding more sophisticated risk management.
Diversification Across Asset Classes: Modern carry trades often integrate multi-asset approaches, including bonds, equities, and commodities, to enhance returns while mitigating currency risk.
7. Global Implications of Carry Trade Activity
Carry trades influence global financial markets beyond individual investor profits. Large-scale capital flows can impact exchange rates, interest rates, and liquidity conditions in emerging and developed markets alike. For example, heavy inflows into a high-yield currency can appreciate it significantly, affecting export competitiveness. Similarly, sudden unwinding of carry trades can trigger “flash crashes” in currency markets, as seen during past financial crises.
Central banks monitor carry trade activity carefully, as massive leveraged positions can exacerbate financial instability. This interplay between market participants and monetary authorities makes carry trade both a source of profit and a systemic consideration.
8. Conclusion
Carry trade profits in the global market emerge from exploiting interest rate differentials and potential currency appreciation. While historically lucrative, the strategy carries substantial risks, particularly during periods of economic uncertainty or market volatility. Successful carry trading requires a combination of careful analysis, risk management, and timely execution, often leveraging modern financial technologies.
Despite challenges, carry trades remain a vital component of the global financial landscape, influencing capital flows, currency valuations, and investment strategies worldwide. As central banks adjust monetary policies and global markets continue to integrate, carry trades will evolve, offering opportunities and risks that reflect the ever-changing dynamics of the global economy. Investors who understand these mechanisms and manage risks effectively can continue to profit from carry trades while navigating the complex landscape of international finance.
China vs USA Trade War1. Background: How the Conflict Began
For years, the United States accused China of unfair trade practices. These included:
Intellectual Property (IP) theft
Forced technology transfer from American companies operating in China
Currency manipulation
Heavy subsidies to Chinese industries
Large trade imbalance in China’s favor
By 2017, the US trade deficit with China approached hundreds of billions of dollars annually. The Trump administration viewed this as a direct threat to America’s manufacturing base and long-term economic power.
In 2018, the US imposed tariffs on billions of dollars worth of Chinese goods. China responded with tariffs of its own. This back-and-forth escalation became widely known as the US-China Trade War.
2. Root Causes of the Trade War
While tariffs were the visible actions, the conflict was driven by much deeper concerns.
a. Economic Competition
China’s rapid economic rise transformed it from a developing nation into a global manufacturing and technological power. Its “Made in China 2025” plan aimed to dominate high-tech sectors such as:
Artificial intelligence
Semiconductors
Robotics
Electric vehicles
Aerospace
The US perceived this ambition as a direct challenge to its global economic leadership.
b. Technology and Intellectual Property
For decades, US companies complained about IP violations in China. The US government argued China obtained American technologies through:
Cyber espionage
Forcing joint ventures
Requiring technology sharing as a condition to access the Chinese market
Technology became the core battleground, as both nations recognized that technological supremacy equals long-term geopolitical power.
c. Trade Deficit Concerns
America consistently imported more from China than it exported to China. This created:
Loss of manufacturing jobs in the US
Political pressure to reduce dependence on Chinese goods
d. Geopolitical Competition
The trade war symbolizes a deeper struggle:
The US trying to protect its status as the global superpower
China aiming to establish itself as an equal or dominant power
The conflict expanded beyond economics to include military competition, alliances, cybersecurity, and influence over global institutions.
3. Timeline of Key Trade War Events
2018: Initial Tariffs
The US imposed tariffs on steel and aluminum.
Additional tariffs targeted $50 billion worth of Chinese goods.
China retaliated with tariffs on soybeans, automobiles, and other US products.
2019: Escalation
The US placed tariffs on nearly all Chinese imports.
Tech giant Huawei was added to the US trade blacklist.
China imposed counter-tariffs on hundreds of American products.
2020: Phase One Deal
Both countries negotiated the Phase One trade deal, where China agreed to purchase more American goods and improve IP protections. However, many issues remained unresolved.
2021–2024: Strategic Decoupling
Even after changes in US political leadership, the approach to China remained firm. Both nations pursued:
Reduced dependence on each other
Supply chain diversification
Investment restrictions
Tech bans and sanctions
The trade war gradually evolved into a broader economic and technological cold war.
4. Economic Impact on the United States
The trade war had mixed results for the US.
a. Higher Costs for American Consumers
Tariffs increased prices of imported goods like:
Electronics
Clothing
Machinery
Household items
Studies showed that American consumers and companies bore much of the cost.
b. Impact on Farmers
China, a major buyer of American agricultural products, reduced imports of:
Soybeans
Pork
Corn
The US government provided subsidies to farmers to offset losses.
c. Boost to Local Manufacturing (Limited)
Some industries saw benefits:
Certain machinery production
Raw material processing
However, the shift was not enough to significantly restore large-scale manufacturing jobs.
d. Technology Restrictions
The US strengthened controls on sensitive technologies:
Semiconductors
AI tools
Advanced computing
This aimed to prevent China from gaining access to critical systems.
5. Economic Impact on China
China also faced challenges:
a. Slowed Economic Growth
Exports dropped, and domestic demand weakened during the peak of the trade war.
b. Pressure on Technology Sector
Blacklisting companies like Huawei limited China’s access to:
5G technologies
Advanced semiconductor chips
US software and hardware
c. Shift in Global Supply Chains
Many companies began moving supply chains from China to:
Vietnam
India
Indonesia
Mexico
China lost some manufacturing opportunities, though it still remained the world’s largest manufacturing hub.
d. Domestic Innovation Push
China increased investments in:
Chip manufacturing
AI development
Military technology
Renewable energy
The trade war accelerated China’s desire to become self-reliant in critical technologies.
6. Impact on Global Markets and Other Economies
The trade war had worldwide consequences.
a. Supply Chain Fragmentation
Global companies diversified production away from China to reduce risk. This led to:
“China +1” strategy adoption
New manufacturing bases in Asia and Latin America
b. Commodity Market Volatility
Prices of soybeans, oil, metals, and industrial commodities fluctuated due to uncertain trade flows.
c. Stock Market Instability
Trade war headlines created volatility in:
US stock indices (Dow, S&P 500, Nasdaq)
Asian stock markets
Emerging market currencies
d. Benefit to Alternative Producers
Nations like India, Vietnam, and Mexico gained foreign investments as companies sought alternatives to China.
7. Evolution into a Technology and Security War
By 2024, the conflict shifted beyond tariffs.
a. Semiconductor (Chip) War
The US restricted Chinese access to advanced chips. China heavily invested in chip manufacturing, creating a technological arms race.
b. 5G and Telecom Restrictions
Many countries banned Huawei equipment due to US pressure.
c. AI Race
Both nations compete to lead in:
AI research
Quantum computing
Autonomous systems
d. Military Technology
The trade war spilled into defense, cybersecurity, and space technology competition.
8. Current Phase: Strategic Rivalry Instead of Pure Trade War
The China–US conflict is now a long-term strategic rivalry featuring:
Diplomacy
Economic containment
Influence over developing nations
Technological decoupling
Both nations continue to trade with each other, but with restrictions and caution.
9. Conclusion
The China vs USA Trade War reflects a battle for dominance in global trade, technology, and geopolitics. What began as a tariff dispute has evolved into a broader economic cold war, influencing supply chains, global markets, and international alliances. While both countries suffered short-term economic pain, the long-term effects include realignments in global trade patterns and a race for technological self-reliance. The conflict is far from over; instead, it has reshaped how nations prepare for future economic and digital competition.

Shipping, Freight, and Logistics Trading1. Introduction to the Global Shipping and Freight Ecosystem
Shipping and freight represent the physical movement of goods, while logistics covers the planning, coordination, and management that make this movement possible. Together, they form a vast network involving shipping lines, freight forwarders, port operators, customs agents, brokers, and traders. Globalization has made this sector indispensable: 90% of world trade moves through the maritime shipping industry.
Shipping is dominated by large vessels—tankers, container ships, bulk carriers—that transport everything from crude oil and LNG to electronics and automobiles. Freight, meanwhile, includes all modes of transportation—sea, air, road, and rail—often combined in multimodal systems. Logistics integrates these modes into a seamless flow, ensuring timely delivery, cost efficiency, and compliance with regulations.
2. How Shipping and Freight Markets Work
Shipping markets operate on supply and demand. Freight rates rise and fall depending on global trade volumes, vessel availability, fuel prices, geopolitical stability, and port congestion. For example:
When China increases steel production, demand for iron ore shipping rises.
If crude oil prices surge, tanker rates typically move higher.
Geopolitical tensions affecting key routes (like the Suez Canal or Red Sea) can cause disruptions and spike spot freight rates.
Freight markets are divided into two broad categories:
a. Spot Market
This is where vessels are chartered for immediate use. Rates fluctuate daily based on market conditions. Spot trading is common in container shipping and bulk carriers.
b. Contract Market
Long-term contracts (time charters, voyage charters) offer stable pricing and predictable supply. Large corporations rely on these for consistent supply chain operations.
Traders, shipping companies, and brokers constantly analyze these markets to capture opportunities in freight rate movements.
3. Types of Freight: Sea, Air, Road, and Rail
1. Sea Freight
Sea freight is the most cost-effective method for bulk goods. There are three core vessel types:
Dry bulk carriers (coal, grain, iron ore)
Tankers (crude oil, petroleum products, LNG)
Container ships (consumer goods, electronics, machinery)
Shipping trading is most active in this segment due to volatile freight rates.
2. Air Freight
Air freight is used for high-value or time-sensitive goods. It is expensive but essential for pharmaceuticals, electronics, perishables, and emergency shipments.
3. Road Freight
Road transport handles last-mile delivery and short- to medium-distance cargo. Trucking markets also have spot and contract rates influenced by fuel prices and driver availability.
4. Rail Freight
Rail is efficient for heavy industrial cargo—coal, steel, fertilizer, and automobiles. It plays a vital role in countries with large landmass, such as India, China, and the U.S.
4. Logistics: The Strategic Framework Behind Freight
Logistics is the science and strategy behind moving goods. It includes:
Inventory management
Warehousing
Distribution planning
Route optimization
Customs clearance
Packaging
Order fulfillment
Supply chain visibility
Advanced logistics uses technology such as GPS tracking, IoT sensors, warehouse automation, robotics, drones, and AI-driven demand forecasting.
Companies like DHL, FedEx, Maersk Logistics, and UPS are leaders in global logistics, providing end-to-end supply chain solutions.
5. Freight and Shipping Trading Markets
Trading in shipping and freight occurs through:
a. Physical Freight Trading
Actual cargo shipments are bought and sold. Traders negotiate:
Freight rates
Vessel chartering
Cargo booking
Port handling
Physical traders manage logistics for commodities like oil, LNG, coal, metals, grains, and chemicals.
b. Forward Freight Agreements (FFAs)
FFAs are financial instruments used to hedge against future freight rate fluctuations. They cover routes such as:
Baltic Dry Index (BDI)
Capesize, Panamax, Supramax segments
Tanker routes (VLCC, Suezmax, Aframax)
FFAs allow traders, ship owners, and charterers to lock in future freight rates, reducing exposure to volatility. They are settled in cash based on index prices.
c. Container Freight Rate Trading
This segment has grown due to global supply chain disruptions. Indices like:
Freightos Baltic Index (FBX)
Shanghai Containerized Freight Index (SCFI)
allow companies to hedge container shipping costs.
d. Logistics Derivatives
Emerging financial products that allow hedging warehousing costs, trucking rates, and port congestion costs.
6. Key Drivers of Shipping, Freight, and Logistics Prices
1. Global Trade Cycles
Economic expansion increases cargo flows, while recessions reduce demand.
2. Fuel Prices
Bunker fuel costs heavily influence freight rates.
3. Capacity and Fleet Supply
An oversupply of vessels leads to low shipping rates; undercapacity pushes rates up.
4. Geopolitics
Conflicts near major routes (Red Sea, Strait of Hormuz, Taiwan Strait) disrupt shipping lanes.
5. Port Congestion
Delays in ports such as Shanghai, Los Angeles, or Rotterdam cause freight surges.
6. Weather and Natural Disasters
Monsoons, hurricanes, and cyclones affect shipping schedules and capacity.
7. Regulations
IMO emission rules increase operational costs, influencing freight rates.
7. Major Players in Shipping and Logistics Trading
Shipping Lines – Maersk, MSC, CMA CGM, Hapag-Lloyd
Freight Forwarders – DHL Global Forwarding, Kuehne + Nagel
Commodity Traders – Glencore, Trafigura, Vitol, Cargill
Port Operators – DP World, PSA International, Adani Ports
Brokerage Firms – Clarksons, Simpson Spence Young
Logistics Integrators – FedEx, UPS, Maersk Logistics
These players create an interconnected ecosystem facilitating global commerce.
8. How Traders Participate in This Market
Shipping and freight traders engage through:
a. Speculating on Freight Rates
Buying FFAs when expecting rates to rise or selling when expecting a fall.
b. Chartering Vessels
Traders take vessels on time charter and sub-charter them at higher spot rates.
c. Cargo Arbitrage
Buying commodities in cheaper markets and shipping them to higher-priced regions.
d. Operational Trading
Managing logistics for commodity trades to optimize cost and efficiency.
e. Hedging Freight Exposure
Manufacturers and exporters use freight derivatives to lock in shipment costs.
9. Future Trends in Shipping, Freight, and Logistics Trading
1. Digitalization and AI
AI-powered routing, predictive freight pricing, and automated documentation.
2. Green Shipping
Zero-emission fuels such as ammonia, hydrogen, LNG, and methanol will transform operating costs.
3. Blockchain for Documentation
Digital bills of lading reduce fraud and speed up transactions.
4. Autonomous Vessels and Drones
Expected to reduce manpower dependency and increase operational precision.
5. Supply Chain Resilience
Companies are shifting to multi-route strategies after disruptions like COVID-19 and geopolitical tensions.
Conclusion
Shipping, freight, and logistics trading form the circulatory system of the global economy. From physical movement of goods to financial trading of freight derivatives, this sector is essential to global trade, commodity markets, and economic stability. Understanding how freight rates work, how logistics integrates each stage of movement, and how traders participate in these markets provides a powerful foundation for anyone interested in global commerce or financial markets.
Currency Trading in the World Market1. Understanding Currency Trading
At its core, currency trading involves exchanging one currency for another. Traders buy one currency while simultaneously selling another, seeking to profit from changes in exchange rates. Exchange rates represent the value of one currency in terms of another and fluctuate constantly due to factors like economic performance, interest rate differentials, geopolitical events, and market sentiment.
Currencies are quoted in pairs, such as EUR/USD, GBP/JPY, or USD/JPY, where the first currency is the “base” and the second is the “quote” currency. The quoted price indicates how much of the quote currency is needed to purchase one unit of the base currency. For example, if EUR/USD is 1.1000, it means 1 euro costs 1.10 US dollars.
2. Participants in the Forex Market
The Forex market comprises a wide array of participants, each with different motivations:
Central Banks: Central banks, such as the Federal Reserve (USA) or the European Central Bank, influence currency prices by setting monetary policy, adjusting interest rates, and intervening in currency markets to stabilize or devalue their currency. Their actions are critical drivers of market volatility.
Commercial Banks and Financial Institutions: Large banks dominate currency trading, providing liquidity to the market and executing trades for clients and proprietary trading desks. They are responsible for a significant portion of daily transactions.
Corporations: Multinational companies engage in Forex to hedge currency risk associated with international trade. For example, a US-based company importing goods from Europe may buy euros to pay suppliers, mitigating exposure to currency fluctuations.
Hedge Funds and Investment Managers: These participants trade large volumes in pursuit of profit, often employing sophisticated strategies such as arbitrage, carry trades, and algorithmic trading.
Retail Traders: Individual traders now have easy access to Forex markets through online brokers, trading platforms, and leverage. Although retail trading represents a smaller fraction of the market, it contributes to market depth and liquidity.
3. Major Currencies and Pairs
The Forex market revolves around a few major currencies that dominate global trade:
US Dollar (USD): As the world’s primary reserve currency, the USD is involved in about 88% of all Forex transactions.
Euro (EUR): Represents the Eurozone economy and is the second most traded currency.
Japanese Yen (JPY): Often used in carry trades due to historically low interest rates.
British Pound (GBP), Swiss Franc (CHF), Canadian Dollar (CAD), and Australian Dollar (AUD): Frequently traded currencies, reflecting the economies of major nations.
Currency pairs are classified as:
Major Pairs: Involving USD and another major currency (e.g., EUR/USD, GBP/USD, USD/JPY). They offer high liquidity and tight spreads.
Cross-Currency Pairs: Do not involve USD (e.g., EUR/GBP, AUD/JPY). They provide opportunities for trading without dollar exposure.
Exotic Pairs: Comprise a major currency and a smaller or emerging market currency (e.g., USD/TRY, USD/SGD). They offer higher volatility and risk.
4. Mechanics of Forex Trading
Forex trading is facilitated by brokers, electronic trading platforms, and interbank networks. Traders can execute trades using the spot market, forward contracts, futures, options, and swaps:
Spot Market: The most common form, where currencies are exchanged “on the spot” at current exchange rates.
Forward Contracts: Agreements to exchange currencies at a predetermined rate on a future date, used primarily for hedging.
Futures Contracts: Standardized contracts traded on exchanges to buy or sell currencies at a future date.
Options: Give the holder the right, but not the obligation, to buy or sell a currency at a specific rate by a certain date.
Swaps: Agreements to exchange currencies for a period, often to manage liquidity or interest rate differences.
Leverage is a critical aspect of Forex trading. Traders can control large positions with relatively small capital, magnifying both potential profits and losses. While leverage allows for greater exposure, it also increases risk, making risk management strategies such as stop-loss orders, position sizing, and diversification essential.
5. Factors Influencing Currency Prices
Currency values are influenced by a combination of economic, political, and psychological factors:
Interest Rates: Higher interest rates typically attract foreign capital, strengthening a currency.
Inflation Rates: Low inflation often supports currency value, while high inflation erodes purchasing power.
Economic Indicators: GDP growth, unemployment rates, trade balances, and manufacturing indices can influence investor sentiment.
Political Stability and Geopolitics: Elections, policy changes, conflicts, or sanctions create volatility.
Market Sentiment and Speculation: Traders’ perceptions, news events, and risk appetite can cause rapid price movements.
6. Trading Strategies
Forex trading strategies vary widely:
Day Trading: Involves entering and exiting positions within a single trading day to capitalize on short-term price movements.
Swing Trading: Trades last from several days to weeks, based on medium-term trends.
Position Trading: Long-term strategy relying on fundamental analysis, economic trends, and central bank policies.
Scalping: Very short-term trades aiming for small profits on frequent trades.
Carry Trade: Borrowing in a low-interest currency and investing in a high-interest currency to earn the interest differential.
7. Risks in Forex Trading
Forex trading carries significant risks:
Market Risk: Currency prices can fluctuate sharply due to economic or political events.
Leverage Risk: Amplified losses can exceed initial investment.
Liquidity Risk: Exotic currencies or certain trading hours may have limited liquidity.
Counterparty Risk: Risk of broker or bank default, especially in OTC trading.
Psychological Risk: Emotional decision-making can lead to poor trading outcomes.
Successful traders employ risk management techniques, including diversification, position sizing, stop-loss and take-profit orders, and careful analysis.
8. Technological Impact
Technology has revolutionized currency trading. Online platforms, automated trading systems, algorithmic trading, and access to real-time data have democratized the market. Traders now benefit from advanced charting tools, technical indicators, and AI-driven strategies that enhance decision-making.
9. Global Economic Importance
Forex trading is not just about profit; it plays a vital role in the global economy:
Facilitates international trade and investment by enabling currency conversion.
Helps countries manage currency value and monetary policy.
Provides liquidity, allowing businesses and investors to hedge currency risk.
Reflects and impacts economic stability, inflation, and interest rates.
10. Conclusion
Currency trading in the world market is a complex, dynamic, and high-stakes financial activity. Its size, liquidity, and accessibility make it appealing for a wide range of participants—from central banks to individual traders. Success requires understanding the interplay of economic indicators, geopolitical factors, market psychology, and technical strategies. While the potential for profit is high, so is the risk, emphasizing the need for education, discipline, and effective risk management. The Forex market will continue to evolve, shaped by technological innovation, regulatory frameworks, and global economic developments, remaining the backbone of international finance.
ETFs and Index Trading1. What Are ETFs?
An Exchange-Traded Fund (ETF) is an investment fund that trades on stock exchanges just like individual shares. It pools money from multiple investors and invests in a basket of assets such as:
Stocks
Bonds
Commodities
Currencies
A combination of multiple asset classes
An ETF aims to track the performance of a specific index, sector, commodity, or theme. For example:
Nifty 50 ETF tracks the Nifty 50 index
S&P 500 ETF tracks the S&P 500
Gold ETF tracks gold prices
Bank ETF tracks banking sector stocks
Because ETFs trade like stocks, you can buy and sell them throughout market hours at real-time prices.
2. Key Features of ETFs
A. Diversification
Instead of buying many stocks individually, investors get instant diversification through one ETF.
For example, a Nifty ETF gives exposure to 50 major Indian companies at once.
B. Liquidity
ETFs can be bought and sold anytime during market hours. Their liquidity depends on the trading volume and the liquidity of underlying assets.
C. Low Cost
ETFs usually have lower expense ratios than mutual funds, mainly because most are passively managed.
D. Transparency
ETFs disclose their portfolios daily, so investors know exactly what they own.
E. Flexibility
Investors can use ETFs for:
Long-term investment
Short-term trading
Hedging
Sector rotation
Commodity exposure
3. Types of ETFs
A. Equity ETFs
Track stock indices such as:
Nifty 50
Sensex
S&P 500
Nasdaq 100
B. Bond ETFs
Invest in government or corporate bonds. These offer lower volatility and predictable income.
C. Commodity ETFs
Track commodities such as gold, silver, crude oil, and natural gas.
D. Sector and Thematic ETFs
Focused on specific sectors like:
Banking
Pharma
IT
Or themes like:
EV (Electric Vehicles)
Renewable energy
Digital technology
E. International ETFs
Provide exposure to global markets without currency complications.
F. Leveraged and Inverse ETFs
Used mainly by advanced traders:
Leveraged ETFs amplify index returns (2x or 3x)
Inverse ETFs move opposite to index direction
4. How ETFs Work
An ETF is created through a process involving:
Asset Management Company (AMC)
Authorized Participants (APs)
Market Makers
The AMC creates ETF units by assembling a portfolio of securities that replicate an index. APs ensure that ETF price stays close to the NAV by arbitrage.
5. What Is Index Trading?
Index trading involves buying and selling financial instruments that track major stock indices like:
Nifty 50
Bank Nifty
Sensex
S&P 500
Dow Jones
Nasdaq 100
Instead of trading individual stocks, traders speculate on overall market direction using:
Index Futures
Index Options
ETFs
Index Contracts for Difference (CFDs) in global markets
Index trading allows exposure to the broad market with a single trade.
6. Why Index Trading Is Popular
A. Reduced Stock-Specific Risk
Indices represent a basket of stocks; poor performance of one stock doesn't drastically affect the entire index.
B. High Liquidity
Major indices have extremely high trading volumes, ensuring smooth entry and exit.
C. Stable Price Movements
Indices are generally less volatile than individual stocks (though instruments like Bank Nifty can still be volatile).
D. Easy to Analyze
Indices react more to macro factors like:
GDP data
Inflation
Interest rates
Global market trends
This makes them easier to study compared to hundreds of stocks.
E. Ideal for Derivatives Trading
Most option traders prefer index options such as:
Nifty options
Bank Nifty options
FINNIFTY options
These contracts have:
Better liquidity
Lower manipulation
More reliable directional moves
7. ETFs vs Index Funds vs Index Trading
ETFs
Trade on exchanges
Real-time price changes
Good for traders and long-term investors
Index Funds
Work like mutual funds
Bought and sold at NAV
No intraday trading
Index Trading
Uses futures and options
More suited for active traders
High leverage
Higher risk
8. Strategies Using ETFs and Index Trading
A. Long-Term Wealth Building Using ETFs
Investors use:
Nifty 50 ETF
S&P 500 ETF
Nasdaq 100 ETF
for 10–20 year wealth creation.
Benefits include:
High return potential
Low cost
Passive investment
B. Short-Term Trading
Traders buy or sell ETFs based on:
Breakouts
Moving averages
RSI or MACD signals
Example:
Buy Nifty ETF when it breaks above 200-day moving average.
C. Hedging
If traders hold a portfolio of Indian stocks, they hedge by shorting:
Nifty futures
Bank Nifty futures
Inverse ETFs (outside India)
This protects against market crashes.
D. Sector Rotation
Traders switch between sector ETFs based on economic conditions:
Banking ETF during interest rate cuts
IT ETF when currency weakens
Pharma ETF during global uncertainty
E. Options Trading Strategies
Index options allow strategies like:
Straddle
Strangle
Iron Condor
Bull Call Spread
Bear Put Spread
These strategies help traders manage volatility and risk.
9. Risks in ETFs and Index Trading
A. Market Risk
ETFs reflect the broader market; if markets fall, ETF values fall.
B. Tracking Error
Sometimes ETFs do not perfectly replicate index movements due to:
Costs
Liquidity issues
Management inefficiencies
C. Liquidity Risk
Some thematic ETFs have low trading volumes.
D. Leverage Risk
Leveraged ETFs and index futures can magnify losses.
E. Volatility Risk
Index options traders face sudden moves due to global events.
10. Who Should Use ETFs and Index Trading?
ETFs Are Ideal For:
Long-term investors
Beginners
Those seeking diversification
Passive investors
Index Trading Is Ideal For:
Active traders
Options and futures traders
Short-term speculators
Hedge fund strategies
Conclusion
ETFs and index trading combine simplicity, diversification, liquidity, and flexibility—making them essential tools in modern financial markets. ETFs allow low-cost, long-term investment with broad exposure, while index trading offers high-efficiency strategies for short-term traders and professionals. Whether someone wants to invest passively for decades or actively trade market movements, understanding ETFs and index trading provides a strong foundation for smarter financial decisions.

Best Ways of Trading1. Trade with a Clear Strategy (Not Emotion or Guesswork)
One of the biggest mistakes new traders make is trading without a defined plan. The best way to trade is to follow a tested strategy. Some proven trading styles include:
a) Trend Trading
This approach involves identifying the overall market direction and trading in line with it. Trend traders use tools like moving averages (20, 50, 200), MACD, or trendlines to determine direction. The idea is simple:
“Trade with the trend until it ends.”
b) Swing Trading
Swing trading works best for people who cannot monitor markets all day. This approach aims to catch reversals or continuation moves over days to weeks. Traders look for key support/resistance, breakouts, and candlestick patterns.
c) Intraday Trading
Intraday traders look for small, high-probability moves within a single session. The best intraday setups come from volume spikes, VWAP, breakout zones, and strong trend days.
d) Momentum Trading
Momentum traders focus on stocks or instruments that show strong volume and price acceleration. When markets move rapidly in one direction, momentum traders ride the wave.
e) Options Trading
Options allow traders to profit using leverage and hedge positions. Buying calls and puts, selling options for premium, or using spreads can significantly enhance risk-reward profiles.
f) Algorithmic or Systematic Trading
A growing method that uses rules, automation, or AI-driven models. This reduces emotions and increases consistency.
The best traders select one main strategy and master it, rather than attempting everything.
2. Follow Multi-Time-Frame Analysis
Always confirm trades using multiple time frames. For example:
Long-term trend – weekly chart
Medium trend – daily chart
Entry timing – 15-minute or 5-minute chart
This prevents taking trades against the broader market direction. When all time frames align, the probability of success increases dramatically.
3. Master Risk Management (The Heart of Successful Trading)
Even the best strategy fails without proper risk control. The strongest traders treat risk management as the core of their system.
a) Risk per Trade
Smart traders risk 1–2% of their capital on any single trade. This helps avoid catastrophic losses.
b) Stop-Loss Use
Always define where the trade is wrong and set a stop-loss accordingly. A systematic stop-loss protects capital and preserves longevity.
c) Position Sizing
Your position size should be based on your risk per trade and stop-loss distance, not on emotions or random judgment.
d) Risk-to-Reward Ratio (RRR)
Successful traders aim for at least 1:2 or 1:3 RRR.
This means:
If you risk ₹1, you target ₹2 or ₹3.
e) Avoid Overtrading
One of the most common reasons traders lose money is taking too many trades. Quality beats quantity.
Risk management is the backbone of consistent long-term profitability.
4. Use Technical and Fundamental Analysis Together
The best trading approach usually combines elements of both.
Technical Analysis helps with:
Timing entry and exit
Understanding trend structure
Recognizing chart patterns
Interpreting market psychology
Key indicators include RSI, MACD, Bollinger Bands, moving averages, and volume-based tools.
Fundamental Analysis helps with:
Identifying long-term direction
Understanding earnings, interest rates, inflation
Recognizing geopolitical and macroeconomic risks
Selecting strong long-term stocks or commodities
A trader who understands both sides sees the market differently and more accurately.
5. Develop Strong Trading Psychology
The market is a psychological battlefield. The best traders keep emotions under control. Some core psychological frameworks include:
a) Discipline and Patience
Only take setups that match your strategy. Good traders wait for the right moment.
b) Emotion Control
Fear and greed destroy accounts. The best way to avoid emotional decisions is to follow a rule-based system.
c) Accepting Losses
Even top traders lose 40–50% of trades. Losses are part of the game. The goal is to keep them small.
d) Avoiding the “Revenge Trade” Trap
Never attempt to win back losses instantly. This leads to impulsive decisions and bigger losses.
Mastering psychology is as important as mastering charts.
6. Backtest and Forward-Test Your Strategy
Before risking real money, test your strategy historically (backtesting). Check:
Win rate
Average gain vs average loss
Maximum drawdown
Consistency during different market conditions
Follow this with paper trading to see real-time behavior. A strategy that performs well in backtests and paper trading has higher chances of success in real markets.
7. Use Technology to Your Advantage
Modern trading has advanced tools:
Algorithmic screeners
Charting platforms
AI-driven market sentiment analysis
Automated alerts
Portfolio trackers
Order execution bots
Technology increases efficiency and reduces human error.
8. Follow Market Cycles and Global Trends
Markets move in cycles: accumulation, uptrend, distribution, correction.
Understanding economic cycles, liquidity conditions, central bank policy, and geopolitical events helps you choose the right instruments and strategies.
For example:
High inflation phase → commodities tend to outperform
Low interest rates → equities rally
Geopolitical tensions → gold, USD strengthen
Trading in sync with macro trends improves accuracy.
9. Diversify Your Trading Portfolio
Do not rely on one asset or one market. Trade multiple instruments (equities, commodities, indices, currencies) to reduce risk. A diversified portfolio smoothens performance and reduces emotional pressure.
10. Keep a Trading Journal
A trading journal is one of the most effective tools for improvement. Record:
Entry & exit levels
Strategy used
Reason for trade
Emotions felt
Result and analysis
Review your journal weekly. It reveals patterns in your behavior, helping you correct mistakes and become a more consistent trader.
Conclusion: What Is the Best Way of Trading?
There is no one “best way,” but the best traders combine:
A clear, tested strategy
Multi-time-frame confirmation
Strong risk management
Mastered psychology
Smart use of technology
Discipline in execution
Trading is not about predicting the future; it's about managing risk, following a system, and staying emotionally stable. If you approach it scientifically and patiently, you can achieve long-term success in any market.
Economic Future at Risk in the Trading Market1. Heightened Market Volatility and Unpredictability
Market volatility is not new, but its frequency, magnitude, and drivers have changed. Previously, volatility was largely triggered by economic data or company earnings. Today, geopolitical shocks, pandemic-like events, cyber-attacks, and supply chain breakdowns trigger sudden movements across global markets.
High-frequency trading algorithms and automated systems amplify these movements. A minor headline can trigger billions of dollars in buying or selling within seconds, resulting in flash crashes or sharp intraday swings. This makes the trading environment more dangerous for retail traders and institutions, raising the probability of mispricing, liquidity traps, and cascading sell-offs.
2. Central Bank Tightening and the Threat of Economic Slowdown
The last decade was marked by cheap money—near-zero interest rates and quantitative easing. But inflationary pressures following the pandemic, supply chain shortages, and geopolitical tensions forced central banks (like the U.S. Federal Reserve, ECB, and RBI) to raise interest rates aggressively.
Higher interest rates bring several risks:
Reduced liquidity in equity and bond markets
Corporate borrowing costs rise, leading to lower earnings
Emerging markets face currency pressure as capital flows back to the U.S.
Real estate and financial assets lose valuation
Higher chance of recession
In a high-rate environment, every asset class—stocks, crypto, gold, bonds, real estate—faces pricing uncertainty. Traders must adapt to a world where liquidity is shrinking and capital is more expensive.
3. Geopolitical Instability Rewriting Global Trade
The global economy is undergoing a major geopolitical realignment:
The U.S.–China rivalry is disrupting technology supply chains.
Conflicts in Europe, Middle East, and Asia threaten fuel and food supplies.
Countries are prioritizing economic nationalism, reshoring factories and reducing trade dependencies.
These shifts raise costs for companies and slow down global economic growth. Markets react violently to geopolitical shocks—especially commodity markets like oil, gas, wheat, and rare earth metals. For traders, this means higher uncertainty, sudden price gaps, and the constant threat of new sanctions or regulations.
4. Currency Instability and the Fight for Dominance
Global currency markets face major instability:
The U.S. dollar is strong, creating pressure on emerging market currencies.
Multiple countries are exploring de-dollarization, challenging the global currency order.
Large nations are increasing their reserves of gold, signaling declining trust in fiat systems.
Cryptocurrencies continue rising but remain highly volatile.
When currencies fluctuate rapidly, it affects trade balances, government debt, import/export costs, and corporate earnings. Multinational companies face higher hedging costs. Investors face exchange-rate risks. For developing economies, the risk of capital flight increases, putting their economic future at risk.
5. Debt Crisis Looming Over Countries and Corporations
Global debt—government, household, and corporate—has reached historically extreme levels. Many countries borrowed heavily during the pandemic to support their economies. Now, with higher interest rates, repayment burdens are rising.
Countries at risk include:
Highly indebted developed nations
Emerging markets dependent on foreign loans
Economies struggling with weak exports or falling currency reserves
A debt default or liquidity crisis in one major economy could trigger global contagion, as seen in the 2008 financial crisis. Corporate debt is another danger—many companies now face refinancing at significantly higher interest rates, which could push weaker firms toward bankruptcy.
6. Technology Disruption, Cyber Risks, and AI-Driven Trading
Technology has always shaped finance, but today’s disruption is unprecedented:
AI-driven trading
Algorithms dominate global trading volumes, making markets move faster and sometimes more irrationally. Errors, bugs, or miscalculations in algorithms can cause massive volatility.
Cyber-attack risks
Financial markets are prime targets for cyber warfare. A major breach on a stock exchange, bank, or clearinghouse could disrupt global markets instantly.
Blockchain instability
Crypto markets add another layer of uncertainty, with regulatory crackdowns, exchange failures, and price manipulation affecting investor confidence.
While technology brings efficiency, it also introduces systemic fragility, where one failure can ripple across markets.
7. Commodity Shock Risks: Energy, Metals, and Food
Commodity markets are extremely sensitive to global shocks:
Oil and gas supply disruptions raise costs worldwide.
Climate change affects crop yields, increasing food prices.
Rare earth and metal shortages disrupt technology and electric vehicle industries.
When commodities spike, inflation rises. When they crash, exporting nations suffer revenue losses. Both extremes create economic instability, affecting stock markets, currency markets, and global trade.
8. Climate Change and the Cost of Environmental Disasters
Climate risks are now financial risks. Extreme weather events—floods, droughts, heatwaves, storms—directly impact national economies and trading markets:
Agricultural output drops
Insurance costs surge
Supply chains break
Infrastructure is damaged
Energy demands rise
Climate-related losses already cost trillions globally. As environmental disasters increase, financial assets that depend on stability become more vulnerable.
9. Social and Political Instability Threatening Economic Confidence
Economic inequality, unemployment, and inflation often lead to social tensions. Political unrest can weaken investor confidence, reduce foreign investment, and derail economic growth. Countries facing internal instability often see:
Capital outflows
Currency depreciation
Stock market decline
Increased borrowing costs
Such scenarios make long-term planning difficult for traders and investors.
10. Psychological and Behavioral Risks in Trading
Human behavior plays a crucial role in market dynamics. The modern era has amplified emotional trading:
Social media influences market sentiment
FOMO-driven trading causes bubbles
Panic selling creates flash crashes
Retail traders follow trends without risk management
This irrational behavior increases systemic vulnerability. When millions follow the same emotional trend, markets lose stability.
Conclusion: Navigating a Future Filled With Risk
The economic future is undeniably at risk due to converging forces: geopolitical conflict, technology disruption, debt burdens, climate change, currency instability, and behavioral volatility. The trading market reflects these tensions in the form of rapid price swings, liquidity shocks, and unpredictable cycles.
However, risks also create opportunities. Traders and investors who focus on diversification, risk management, macro insights, and disciplined strategy can thrive even in turbulent times. The key is understanding that the future will not resemble the stability of previous decades. Instead, success depends on adapting to a world defined by uncertainty, speed, and global interconnectedness.
Reserve Currency Dominance in Global Trade1. What Is a Reserve Currency?
A reserve currency is a foreign currency held in significant quantities by central banks and financial institutions. It is used for:
International trade invoicing
Cross-border payments
Foreign exchange interventions
Investment in global assets
Storing national wealth
To serve as a reserve currency, it must be stable, widely accepted, highly liquid, and backed by strong institutions.
2. Why Some Currencies Become Dominant
A dominant reserve currency does not emerge overnight. It is built through decades of economic, political, and financial advantages. Historically, currencies like the British pound during the 19th century and the U.S. dollar after World War II gained dominance because:
A. Economic Size and Influence
The issuing country must be a major economic power.
The U.S. economy is one of the world’s largest.
Its deep financial markets attract global investors.
When an economy is big, its currency naturally becomes widely used because global businesses want access to that market.
B. Trust and Stability
Reserve currency users expect:
Stable inflation
Strong legal systems
Predictable governments
Transparent financial institutions
Countries hesitate to store reserves in a currency if the issuing government is unstable or unpredictable.
C. Deep and Liquid Financial Markets
Liquidity means assets can be bought or sold easily.
U.S. Treasury bonds are considered the safest and most liquid assets on Earth.
This makes the dollar extremely convenient for global central banks and funds.
D. Network Effects
The more people use a currency, the more others are forced to use it.
It becomes a self-reinforcing cycle:
“Everyone uses the dollar because everyone else uses the dollar.”
3. The Dollar’s Dominance in Global Trade
The U.S. dollar accounts for:
Around 60% of global forex reserves
Nearly 90% of forex transactions
More than 50% of global trade invoicing
Even countries that don’t trade with the U.S. often settle in dollars. For example:
Oil, metals, and agricultural commodities are mostly priced in dollars.
Many international loans and bonds are issued in dollars.
This dominance creates a uniform standard in global transactions and reduces exchange rate risks.
4. How Reserve Currency Dominance Shapes Global Trade
A. Trade Pricing and Invoicing Power
When most global goods are priced in a single currency, it simplifies international trade.
Businesses avoid complex exchange-rate conversions and hedge only against dollar fluctuations.
For example:
India buys crude oil from Saudi Arabia in dollars, not rupees.
Japan buys Brazilian iron ore in dollars, not yen.
This standardization reduces friction in supply chains.
B. Lower Borrowing Costs for the Dominant Currency Country
Because demand for the reserve currency is high, the issuing country can borrow at lower costs.
The U.S. government benefits enormously from this:
Foreign countries buy trillions of dollars in U.S. bonds.
This demand keeps U.S. interest rates lower than they otherwise would be.
Some economists call this the “exorbitant privilege.”
C. Increased Global Influence
Countries that depend on the dollar become sensitive to U.S. policies.
For example:
U.S. sanctions become far more effective because they limit access to the global financial system dominated by the dollar.
Reserve currency dominance therefore increases geopolitical power.
D. Exchange Rate Spillovers
When the dollar strengthens:
Global importers face higher costs
Emerging markets see increased currency volatility
Countries with dollar-denominated debt struggle
Dollar cycles heavily influence global commodity prices and capital flows.
5. Benefits for the Issuing Country
A. Global Demand for Its Assets
Other countries must hold dollar assets (bonds, stocks, etc.) to participate in global trade.
This inflow of foreign capital boosts:
U.S. financial markets
Investment
Corporate growth
B. Ability to Run Larger Deficits
The U.S. can print dollars and borrow cheaply.
This allows:
Higher government spending
Larger trade deficits
A strong consumer economy
Countries with non-reserve currencies don’t enjoy such flexibility.
C. Strong Geopolitical Leverage
The U.S. can limit access to:
SWIFT
Dollar clearing banks
U.S.-based financial institutions
This gives it unmatched diplomatic influence.
6. Challenges and Risks of Reserve Currency Dominance
A. Global Dependence on a Single Currency
Overreliance on the dollar exposes the world to U.S. economic cycles.
A strong dollar can cause:
Global recessions
Debt crises in emerging markets
Commodity price spikes
B. Vulnerability to U.S. Policies
Countries trading in dollars become exposed to:
U.S. interest rate changes (Federal Reserve policy)
Political sanctions
Dollar liquidity shortages
C. Internal Weakness in the Dominant Country
A country with a reserve currency might experience:
Overvalued currency
Loss of export competitiveness
Higher trade deficits
This is sometimes called the Triffin Dilemma.
D. Shift in Global Power Balance
As emerging economies grow, the dominance of a single currency may decline.
China’s yuan, Europe’s euro, or even digital currencies could dilute dollar power in the future.
7. Possible Contenders to Replace or Challenge the Dollar
A. The Euro
Strengths:
Large economic base
Strong institutions
Weaknesses:
Fragmented political structure
Debt issues in some member states
B. The Chinese Yuan
Strengths:
World’s second-largest economy
Rising global influence
Weaknesses:
Capital controls
Limited convertibility
Concerns over regulatory transparency
C. Digital Currencies and CBDCs
Central bank digital currencies (CBDCs) could change settlement systems.
However, widespread trust and adoption are still uncertain.
8. The Future of Reserve Currency Dominance
While the dollar remains dominant, global trends suggest:
Gradual diversification of reserves
Increased regional currencies in trade
Rise of digital settlement networks
Efforts by China and Middle East economies to reduce dollar dependence
But a complete shift away from the dollar is unlikely in the near future because:
No alternative matches its liquidity and trust.
Global markets remain heavily dollar-centric.
Any transition, if it occurs, will be slow and multi-polar.
Conclusion
Reserve currency dominance is a powerful global economic force that shapes international trade, investment flows, geopolitical strategies, and financial stability. The U.S. dollar currently holds an unmatched position due to its liquidity, trust, broad acceptance, and the strength of U.S. institutions. Although challenges such as de-dollarization, digital currencies, and the rise of other economies exist, the dollar’s dominance is supported by decades of structural advantages. Understanding this dynamic is essential for countries, investors, businesses, and policymakers participating in an increasingly interconnected global system.

Market next target 🔄 Disruption Analysis:
📌 Current Scenario:
Price is trading around 3,336.400, just below the identified resistance zone (~3,340-3,343).
A range-bound structure is visible with repeated rejections at resistance and support.
---
🚨 Disruption View:
❌ Invalidating Bearish Bias:
The chart assumes a bearish move toward the 3,320 target, but there are early signs of strength near the mid-range (3,335 area).
Failed breakdowns and higher lows indicate buying pressure below 3,330.
---
🟢 Alternative Disruption Outlook (Bullish Flip):
If price breaks and holds above 3,343 resistance, we may see:
🔼 Upside breakout toward 3,355–3,360 zone.
📈 Continuation of the larger uptrend from July 1st rally.
---
🔁 Key Disruption Levels:
Support: 3,328–3,330 (interim zone to watch before full drop)
Resistance: 3,343–3,345 (bullish breakout point)
Invalidation of Bearish Bias: Closing above 3,345 on strong volume.

Market next target ⚠️ Disruption Analysis – Gold (1H):
🔹 Pattern Disruption Identified:
The chart previously followed a descending structure with lower highs and lower lows, confirming bearish momentum.
However, a temporary recovery (small bullish correction) appears after a sharp drop, disrupting the previous flow.
---
🔄 Disruption Points:
1. Break in Momentum (Structure Shift):
The recent bullish correction (small upward leg) challenges the consistency of the descending trend.
It signals a potential pause or trap in the current bearish move.
2. Price Rejection Area:
Price attempted to bounce but failed to break above the previous lower high, indicating bearish strength remains intact, but is facing disruption from short-term buyers.
3. Volatility Spike:
The long wick on the recent candle shows a volatility disruption, likely due to economic news or high-impact events (suggested by the ⚡ icon on the chart).
4. Target Zone Disruption:
Though the yellow arrow points toward a bearish target, the slight upward pullback adds uncertainty about whether price will reach that level immediately.
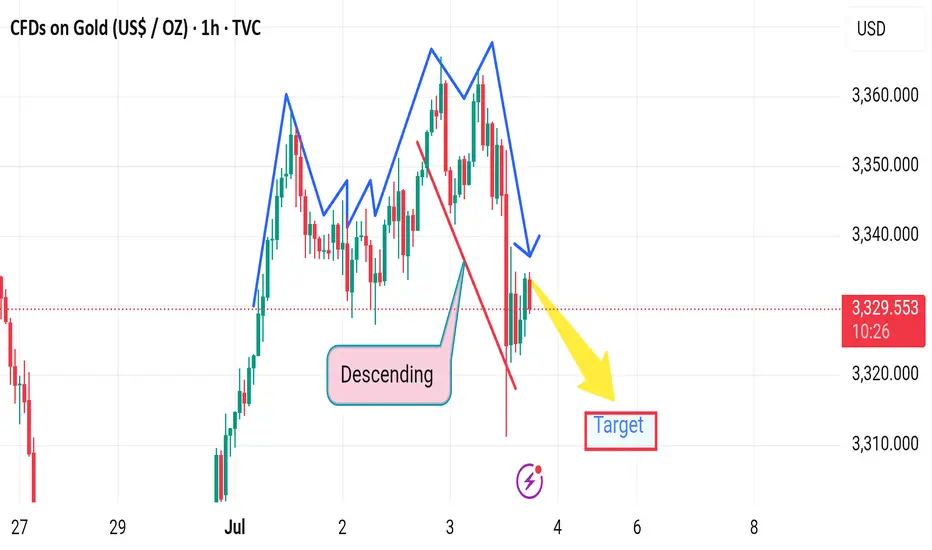
Market next move ❗ Disrupted Market Outlook:
⚠️ False Breakout Risk:
The recent "Breakout" above previous highs may be a bull trap. Although price surged, the follow-up candles are showing lower highs, suggesting weakening bullish momentum.
📉 Bearish Divergence (not shown but likely):
Based on the price action, there's a potential bearish divergence with RSI/MACD (if overlaid), as price makes higher highs while momentum likely weakens.
🔄 Resistance Reversal Zone:
The area labeled as "Support area" at the top (near $67.50) is actually acting as resistance again — the market is failing to hold above this level.
🔁 Retest Failure:
After the breakout, price failed to establish strong support and is consolidating below the highs, hinting at a potential breakdown below $66.
---
🔻 Disruption Path:
1. Drop to $66.00 - immediate pullback from failed breakout.

Market next target 🔀 Disruption Analysis – Bullish Alternative Scenario
The current chart suggests a bearish outlook from the resistance zone (~$2,495–$2,500), targeting a drop below $2,425. However, here’s how a bullish disruption could break this bearish narrative:
---
🟢 Bullish Disruption Possibility:
1. Support Reclaim & Strong Buyer Reaction:
If price reclaims and holds above the marked “support area” (~$2,495), it could signal strength and trap early sellers.
A strong bullish candle closing above $2,505 could invalidate the bearish scenario.
2. Higher Low Formation:
If ETH prints a higher low above $2,470, it would suggest buyers are stepping in early, reinforcing bullish momentum.
3. Target Shift – Bullish Continuation:
A confirmed breakout above $2,505 may open the path to $2,540–$2,560 as the new short-term target zone.
4. Momentum Catalyst:
A positive U.S. macroeconomic event or crypto-specific bullish news (e.g., ETF, institutional inflows) could fuel upside disruption.

Market next target 🔀 Disruption Analysis – Bearish Alternative Scenario
The current chart suggests a bullish continuation from the consolidation zone around $107,300–$107,500, with a projected move toward $108,500+. However, the following bearish disruption could invalidate that path:
---
🔻 Bearish Disruption Possibility:
1. False Breakout Trap:
If price briefly spikes above the consolidation zone and quickly reverses, it could trap breakout buyers.
A failed bullish move around $107,800–$108,000 would be the first bearish signal.
2. Weak Volume Confirmation:
Lack of volume during the breakout would signal lack of institutional interest, increasing downside risk.
3. Break Below Support Zone:
If BTC breaks below $107,000, it would signal a loss of momentum and invalidate the bullish scenario.
This breakdown may lead to a quick move toward $106,000 or even $105,800, the recent swing low.
4. Macro Influence:
Any negative U.S. economic data or regulatory news could spark bearish sentiment and accelerate the drop.
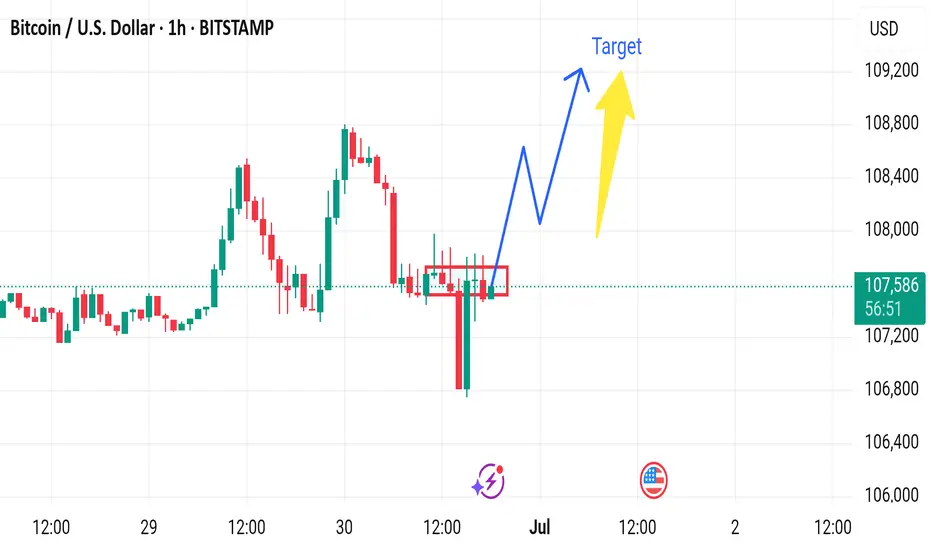
Market next move 🔀 Disruption Analysis – Bearish Alternative Scenario
While the current setup points to a bullish continuation above the support zone (around 144.10–144.20) with a projected target near 144.60, here’s how a bearish disruption could unfold instead:
---
🔻 Bearish Disruption Possibility:
1. Failed Breakout / Bull Trap:
Price may fake a move upward to trap breakout buyers near 144.40–144.50, then sharply reverse.
This would indicate a false breakout and potential reversal setup.
2. Rejection at Resistance:
Repeated failure to close above 144.40 may signal exhaustion.
Bearish divergence could form on momentum indicators (like RSI) as price rises.
3. Break Below Support Area:
A decisive break below the red support zone (around 144.10) may shift momentum bearish.
That would confirm a lower high and suggest downside continuation.
4. Next Bearish Target:
Initial support lies at 143.85, with further potential drop toward 143.60.
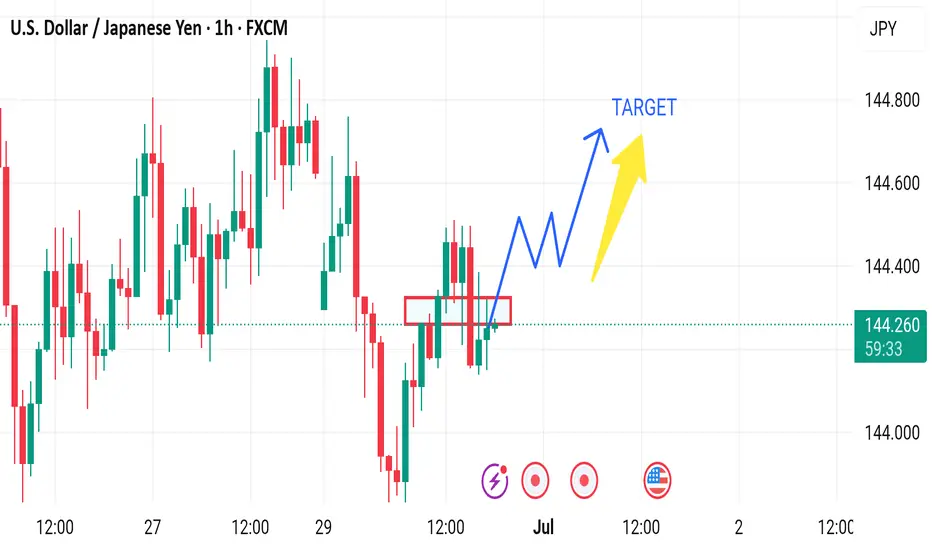
Market next target 🔀 Disruption Analysis – Bullish Alternative Scenario
While the current chart outlines a bearish scenario after a short-term bullish correction, leading to a drop toward the target near 1.36600, here’s how a bullish disruption could unfold instead:
---
🟢 Bullish Disruption Possibility:
1. False Breakdown / Bear Trap:
The market may dip slightly below recent lows to trigger sell stops and liquidity grab, then reverse upward.
If price finds strong buying interest around 1.3690–1.3700, it could spark a bullish reversal.
2. Strong Rejection Candles:
Watch for bullish engulfing or pin bar formations on lower timeframes (15m or 30m) near the dip area.
These would signal loss of bearish momentum.
3. Break of Lower High Structure:
A break above 1.3720 would shift short-term market structure to bullish.
It could lead to a move toward 1.3750–1.3780.
4. Macro Fundamentals:
Hawkish BOE comments or weak U.S. data could reverse USD strength, lifting GBP/USD.
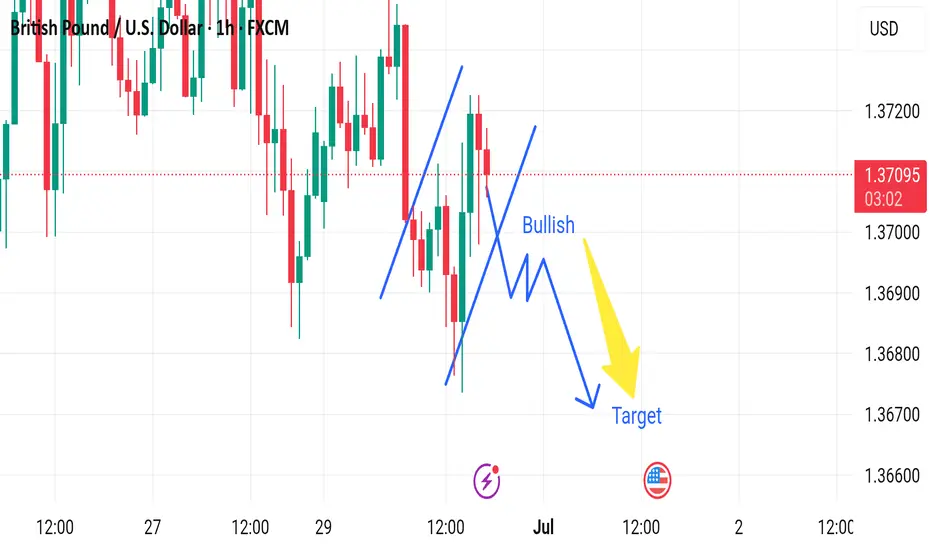
Market next move Disruption Analysis – Bullish Alternative Scenario
While the current chart suggests a bearish setup from a resistance zone (around 1.1765) toward a target near 1.1630, here's a potential bullish disruption that could invalidate the bearish thesis:
---
🟢 Bullish Disruption Possibility:
1. False Breakdown / Liquidity Grab:
Price may fake a dip below the red resistance-turned-support zone to trigger stop-losses before reversing.
This is known as a liquidity sweep or bear trap.
2. Higher Low Formation:
If the pair pulls back slightly but forms a higher low above 1.1700, it may signal bullish continuation.
3. Breakout Confirmation:
A strong bullish candle above 1.1775 could confirm continuation toward 1.1830–1.1850.
4. Fundamental Catalyst:
Positive EU economic news or dovish signals from the U.S. Fed could support Euro strength.
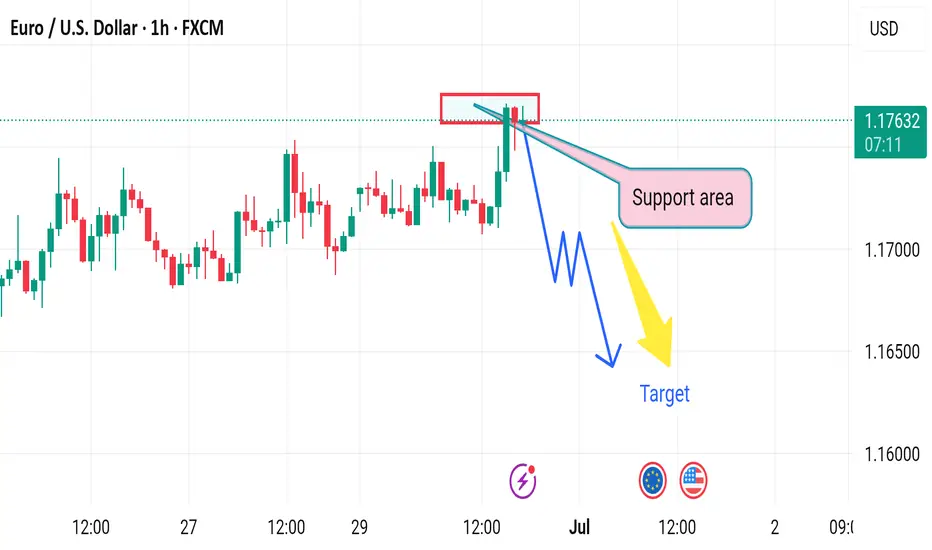
Market next target 🔀 Disruption Analysis - Alternative Scenario
While the current chart suggests a bullish breakout from the support area around $35.85–$35.90 with an upward target above $36.20, a potential bearish disruption scenario could unfold under the following conditions:
⚠️ Bearish Disruption Possibility:
1. Weakening Buying Pressure:
Price has tested the support zone multiple times, showing signs of weakening bullish momentum.
Buyers may be exhausting near the $36.00 area without strong follow-through.
2. Break Below Support:
If price breaks and closes below $35.85 support zone on high volume, it could invalidate the bullish setup.
This would create a lower low, indicating a potential trend reversal to the downside.
3. Next Downside Targets:
Immediate support lies around $35.60.
Further downside could take price to $35.40 if bearish momentum strengthens.
4. Bearish Triggers:
Negative economic data (especially U.S.-related as indicated by the calendar icon).
Rising DXY or bond yields may pressure silver prices

Market next move 📉 Gold Price Disruption Analysis – 1H Chart
Current Price: $3,282.880
Timeframe: 1-Hour
Trend Direction: Bearish bias with possible continuation toward $3,250
---
🔻 Bearish Scenario (Planned Path):
Support Turned Resistance: The area around $3,290 acted as strong resistance (previous support). Price failed to break above.
Lower High Formation: Price has created a lower high, indicating potential continuation to the downside.
Projected Target: A zigzag downward move is expected, with a target near $3,250, aligning with a key demand/support zone.
---
⚠️ Disruption Possibilities (Unexpected Movements):
🔁 1. Bullish Disruption Risk:
If buyers step in aggressively above $3,283–$3,285, we may see:
A break of structure
A reversal toward the $3,290+ zone
Possible formation of a double bottom or inverse head and shoulders
Disruption Target: $3,295–$3,300
🧨 2. False Breakdown at Support ($3,250):
Market could dip slightly below $3,250 to trap sellers and then reverse sharply.
A liquidity grab might lead to sudden bullish pressure, creating a disruption bounce.
📊 3. Fundamental Disruption Factors:
US Dollar strength/weakness
Fed interest rate news
Inflation data releases
These can instantly invalidate technical patterns and push price in either direction.
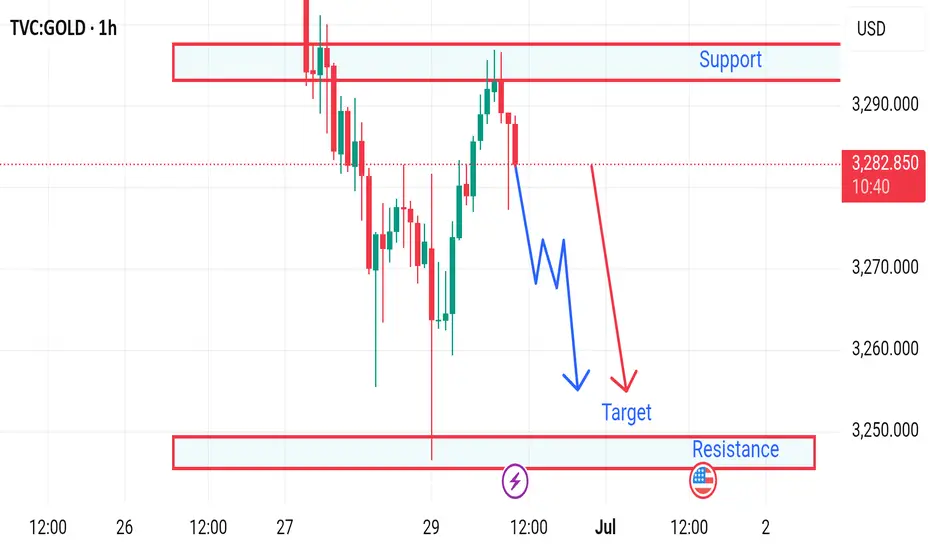
Market next move 🔄 Disruption Analysis: Contrarian View
⚠️ Original Viewpoint Summary:
The original analysis suggests a bearish breakdown from the rising channel, with a short-term target of 64.36, pointing to a move towards the support zone.
---
📉 Disrupted (Contrarian) Perspective:
🔁 Fakeout Scenario Possibility:
The sharp drop below the trendline may be a bear trap.
Price quickly bounced back into the channel region, showing buyer interest near the support.
🔎 Key Observations:
Wick rejection near the lower support suggests that demand is active around 64.50–64.36 zone.
The structure of higher lows is still valid unless there's a confirmed close below the support box.
Momentum indicators (not shown) may help validate whether this is a temporary pullback or a deeper correction.
📈 Alternative Projection:
If price holds above the support zone, it could rebound back to test 65.50–65.80 resistance.
A false breakdown followed by consolidation may lead to retest of the upper channel (near 66.00).
---
🧭 Revised Strategy Suggestion:
Avoid early shorts unless there is a confirmed candle close below 64.36.
Watch for bullish price action near support (hammer, engulfing) for a potential long re-entry.
Reevaluate if WTI forms a base around 64.40 — possible reversal setup.
