FARTCOINUSDT Neckline Decision Zone Adam & Eve vs Cup & HandleFARTCOINUSDT is currently exhibiting a bearish structure, forming an inverse Adam & Eve setup, which also aligns with a potential inverse Cup & Handle formation. The highlighted supply zone remains the critical decision area. A rejection from this zone, followed by a breakdown below the neckline, would confirm bearish continuation and expose price to a deeper decline toward the projected target around $0.01472. Conversely, a clean break and acceptance above the supply zone would invalidate the bearish bias and shift momentum toward the bullish targets already outlined.
The primary approach is to wait for clear confirmation before committing to any directional bias.
Fractal

XAU/USD 19 January 2026 Intraday AnalysisH4 Analysis:
-> Swing: Bullish.
-> Internal: Bullish.
Price printed as per alternative scenario dated 14 January 2026 by continuing to print higher-highs.
Price printed with a significant gap-up at market open. This is most likely due to uncertain geopolitical tensions.
As a result of continued bullish momentum pullback has been insignificant. Therefore, I will not classify bullish iBOS, however, I have marked this is red.
Price is currently trading within an internal low and fractal high.
Intraday expectation:
Price to print bearish CHoCH to indicate bullish pullback phase initiation. Thereafter price to react at either discount of 50% internal EQ, or H4 supply zone before targeting weak internal high priced at 4,690.940.
Alternative scenario: Price to again continue bullish.
Note:
The Federal Reserve’s renewed easing cycle, alongside a weaker U.S. dollar and persistent geopolitical tensions, continues to drive volatility in the gold market.
Traders should remain cautious and adjust risk management strategies to navigate sharp price swings.
Additionally, gold pricing is highly sensitive to U.S. policy under President Trump, where tariff measures, fiscal uncertainty, and shifting geopolitical strategy amplify market repricing risks and reinforce safe‑haven demand.
H4 Chart:
M15 Analysis:
-> Swing: Bullish.
-> Internal: Bullish.
Price printed according to analysis dated 13 January 2026 by printing a bullish iBOS.
Price is currently trading within an internal low and fractal high. CHoCH positioning is denoted with a blue horizontal dotted line.
Intraday expectation:
Price to indicate bearish pullback phase initiation by printing a bearish CHoCH. Current CHoCH positioning is far away from price, therefore, price could continue bullish and print higher-highs to bring CHoCH positioning closer to current price action.
Price to then trade down to either M15 or H4 demand zone, or discount of 50% internal EQ before targeting weak internal high, priced at 4,690.940.
Note:
Gold continues to exhibit elevated volatility as markets digest the Federal Reserve’s ongoing dovish tilt and persistent global geopolitical tensions.
With uncertainty remaining a dominant theme across global risk assets, traders should prioritise disciplined risk management, as abrupt price swings and liquidity pockets may become increasingly common.
Furthermore, recent tariff announcements from President Trump, particularly those directed at China, have added another layer of instability to the macro landscape. These policy developments have the potential to intensify market turbulence, heighten risk‑off flows, and trigger sharp intraday reversals or whipsaw‑like behaviour in gold.
M15 Chart:

Selena | BTCUSD · 2H – Bullish Channel Near Premium ResistanceBINANCE:BTCUSD BITSTAMP:BTCUSD
The market delivered a strong impulsive rally from channel support, followed by minor consolidation. Current price is trading at premium levels, meaning upside continuation requires acceptance above resistance. Failure to hold above the breakout zone may result in a corrective pullback toward channel equilibrium.
Key Scenarios
✅ Bullish Case 🚀
Sustained acceptance above 97,400 – 97,900:
🎯 Target 1: 99,000
🎯 Target 2: 99,400 – 99,500 (upper supply & liquidity)
❌ Bearish Case 📉
Rejection from the resistance zone and breakdown below 95,800 may trigger a deeper correction toward:
🎯 93,800 – 92,500
🎯 Extended support near 90,300 (channel base)
Current Levels to Watch
Resistance 🔴: 97,900 – 99,400
Support 🟢: 95,800 – 93,800 – 90,300
⚠️ Disclaimer: This analysis is for educational purposes only. It is not financial advice.

January Effect: Mid and Small-Cap Stocks Outperform Mega-CapsIn the first half of the first month of the year the market is clearly dominated by mid and small-cap stocks (which carry more influence in equal-weighted index than in the cap-weighted).
They are outperforming mega-caps by 1.94%.
This could be a sign of the January Effect where small stocks tend to outperform early in the year.

The Silver Bullet
Silver is back on the rise and showing increasingly strong bullish momentum despite the numerous large accounts on social media trying to pin the top and boast short entries that are currently suffering severely.
On 10/29/24 I described a breakout move occurring where price would see an initial rejection of the $53-$57 range before exploding to a target range of $79 and $132. I don't care to explain where these levels are derived from in great detail in order to preserve a part of my edge through a unique application of Fibonacci.
Aside from the 2.618 @ $132.01 being primary target at this stage in the parabola:
Special interest to the $108-$110 range just ahead here upon break of $96.72. Method implies the next intermediary rejection and reconsolidation begins there, with true support laying at $79.81 in the event of a rejection.
Good luck!

NQ Short Scalp From 30min ob - 2-5 min price actionI am watching this 30 min ob for a quick wick to trap longs that expect that gap to fill now. Monitoring structure on the 2-5 min tf for a quick scalp. Keep it simple, if a 30min candle closes above that box= no trade. Waiting for confirmation. NFA

GLM/USDT: Liquidity Sweep Long (SL Below Invalidation)On the OKX:GLMUSDT.P 15-minute chart, price has been trending down and then printed a clear liquidity sweep at the marked $$ level. That sweep took out the prior swing low and immediately reclaimed, which often signals trapped sellers and a potential short-term reversal.
My plan is to enter long at the $$ level (liquidity level) once price shows it can hold above that reclaimed level. The trade is invalid if price breaks the lower low — my stop is placed below the marked Invalidation line (below the lowest swing / lower low). Upside target is the next liquidity pool / mean reversion toward the larger grey target zone.
Trade Plan (as shown):
Entry: At $$ (liquidity sweep level) after reclaim / hold
Stop-loss: Below the lower low (the Invalidation line)
Target: Reversion upward toward the grey objective zone (first resistance area, then extension)
What I Expect Next:
Ideally, GLM holds above $$, forms a higher low, and pushes into the upper range. If we lose $$ and break below the invalidation low, the setup is invalid and I’m out.

XAU/USD 16 January 2026 Intraday AnalysisH4 Analysis:
-> Swing: Bullish.
-> Internal: Bullish.
Analysis and bias remains the same as analysis dated 14 January 2026. It is worth noting how price failed to print above fractal high. Price seems to be in the process of printing bearish CHoCH to indicate bearish pullback phase initiation.
Price has printed according to my analysis dated 13 January 2026 where I mentioned, in alternative scenario, price to continue bullish.
As a result of continued bullish momentum CHoCH positioning has been brought closer to recent price action.
Price is currently trading within an internal low and fractal high.
Intraday expectation:
Price to print bearish CHoCH to indicate bullish pullback phase initiation. Thereafafter price to react at either discount of 50% internal EQ, or H4 supply zone before targeting weak internal high priced at 4,639.890
Alternative scenario: Price to again continue bullish.
Note:
The Federal Reserve’s renewed easing cycle, alongside a weaker U.S. dollar and persistent geopolitical tensions, continues to drive volatility in the gold market.
Traders should remain cautious and adjust risk management strategies to navigate sharp price swings.
Additionally, gold pricing is highly sensitive to U.S. policy under President Trump, where tariff measures, fiscal uncertainty, and shifting geopolitical strategy amplify market repricing risks and reinforce safe‑haven demand.
H4 Chart:
M15 Analysis:
-> Swing: Bullish.
-> Internal: Bullish.
Analysis and bias remains the same as analysis dated 14 January 2026. Please note how weak internal low is holding with price unable to close above.
Price has printed according to my analysis dated 13 January 2026 where I mentioned, in alternative scenario, price to continue bullish.
Price continued bullish with very minimal pullback, therefore, I will not classify previous IBOS.
Price is currently trading within an established internal range, however, again, I will continue to monitor price with respect to depth of pullback.
Intraday expectation:
Price to trade down to either M15 or H4 demand zone, or discount of 50% internal EQ before targeting weak internal low, priced at 4,639.890.
Alternative scenario:
Price could potentially continue bullish.
Note:
Gold continues to exhibit elevated volatility as markets digest the Federal Reserve’s ongoing dovish tilt and persistent global geopolitical tensions.
With uncertainty remaining a dominant theme across global risk assets, traders should prioritise disciplined risk management, as abrupt price swings and liquidity pockets may become increasingly common.
Furthermore, recent tariff announcements from President Trump, particularly those directed at China, have added another layer of instability to the macro landscape. These policy developments have the potential to intensify market turbulence, heighten risk‑off flows, and trigger sharp intraday reversals or whipsaw‑like behaviour in gold.
M15 Chart:

Late Night SwitcherooInitially I had a buy idea but I learnt to quickly change my perspective as DXY looked like the USD was gaining strength and closing with an indecision candle.
So I went short EURUSD on the M15 for a quick trade to a recent demand level.

UsdJpy SellThe trend is bullish, but the price always ends up making a pullback.
At this moment, confirmation of the pullback came with the Choch of the 4H fractal structure.
Price is using the 4H EMA as resistance, took liquidity in the 1H structure and reacted from a premium zone (50% Fibonacci).
The break of the 1H EMA shows alignment and increases the probability of bearish movements continuing - with the aim of taking internal liquidity from the 4H overall structure

FTSE 100 – Long-Term Cycle Context (Monthly)The FTSE continues to respect its dominant multi-year cycle, with price currently extended above the cyclical midline following a strong advance.
While momentum remains bullish, price is now entering a zone where cycle timing becomes more important than trend strength. Historically, similar positions within the cycle have preceded mean reversion toward the next cycle low.
No reversal signal yet - but from a cycle perspective, risk is rising as price stretches into the later phase of the oscillation.
Watching for:
• Momentum exhaustion
• Structural weakness
• Cycle rollover confirmation
Educational only, not financial advice.


XAU/USD 15 January 2026 Intraday AnalysisH4 Analysis:
-> Swing: Bullish.
-> Internal: Bullish.
Analysis and bias remains the same as yesterdays analysis dated 14 January 2026. It is worth noting how price failed to print above fractal high. Price seems to be in the process of printing bearish CHoCH to indicate bearish pullback phase initiation.
Price has printed according to my analysis dated 13 January 2026 where I mentioned, in alternative scenario, price to continue bullish.
As a result of continued bullish momentum CHoCH positioning has been brought closer to recent price action.
Price is currently trading within an internal low and fractal high.
Intraday expectation:
Price to print bearish CHoCH to indicate bullish pullback phase initiation. Thereafafter price to react at either discount of 50% internal EQ, or H4 supply zone before targeting weak internal high priced at 4,639.890
Alternative scenario: Price to again continue bullish.
Note:
The Federal Reserve’s renewed easing cycle, alongside a weaker U.S. dollar and persistent geopolitical tensions, continues to drive volatility in the gold market.
Traders should remain cautious and adjust risk management strategies to navigate sharp price swings.
Additionally, gold pricing is highly sensitive to U.S. policy under President Trump, where tariff measures, fiscal uncertainty, and shifting geopolitical strategy amplify market repricing risks and reinforce safe‑haven demand.
H4 Chart:
M15 Analysis:
-> Swing: Bullish.
-> Internal: Bullish.
Analysis and bias remains the same as yesterdays analysis dated 14 January 2026. Please note how weak internal low is holding with price unable to close above.
Price has printed according to my analysis dated 13 January 2026 where I mentioned, in alternative scenario, price to continue bullish.
Price continued bullish with very minimal pullback, therefore, I will not classify previous IBOS.
Price is currently trading within an established internal range, however, again, I will continue to monitor price with respect to depth of pullback.
Intraday expectation:
Price to trade down to either M15 or H4 demand zone, or discount of 50% internal EQ before targeting weak internal low, priced at 4,639.890.
Alternative scenario:
Price could potentially continue bullish.
Note:
Gold continues to exhibit elevated volatility as markets digest the Federal Reserve’s ongoing dovish tilt and persistent global geopolitical tensions.
With uncertainty remaining a dominant theme across global risk assets, traders should prioritise disciplined risk management, as abrupt price swings and liquidity pockets may become increasingly common.
Furthermore, recent tariff announcements from President Trump, particularly those directed at China, have added another layer of instability to the macro landscape. These policy developments have the potential to intensify market turbulence, heighten risk‑off flows, and trigger sharp intraday reversals or whipsaw‑like behaviour in gold.
M15 Chart:

XAUUSD M15 buyFormal / journal style:
“With the M15 showing an uptrend, I expect the previous inducement low to hold and therefore enter a buy position.”
Short & clear:
“M15 uptrend → inducement low holds → buy entry.”

The Scariest Chart for Silver ShortsAfter flipping from long to short and getting quickly stopped out, I took a step back to try to see the big picture and answer the question, where is silver headed?
Silver is clearly in a parabolic move and the question is no longer whether silver will experience a significant decline from its future top, but rather, when that will occur. Getting the timing wrong will only lead to misery.
I was planning to short heavily at $100, but now I'm not so sure that would be wise. Yes, $100 is a psychological barrier and also coincides with Elliott Wave targets. However, silver has a long history of surprising to the upside during powerful parabolic moves. Three previous times in silver's charted history did it have a 2+ year long parabolic move. What's interesting about those moves is that duration is perfectly correlated with price top. The 71-74 (blue), 76-80 (red), and 08-11 (green) fractals (monthly bars from pivot low to high), are all logarithmically mapped from the 22 pivot low.
I doubt I'll be able to resist shorting at $100, but I will be sure to preserve most of my capital for any move above $150. At $150, I'll be willing to take on substantial risk as the trade will be quite asymmetric.

XAU/USD 14 January 2026 Intraday AnalysisH4 Analysis:
-> Swing: Bullish.
-> Internal: Bullish.
Price has printed according to my analysis dated 13 January 2026 where I mentioned, in alternative scenario, price to continue bullish.
As a result of continued bullish momentum CHoCH positioning has been brought closer to recent price action.
Price is currently trading within an internal low and fractal high.
Intraday expectation:
Price to print bearish CHoCH to indicate bullish pullback phase initiation. Thereafafter price to react at either discount of 50% internal EQ, or H4 supply zone before targeting weak internal high priced at 4,639.890
Alternative scenario: Price to again continue bullish.
Note:
The Federal Reserve’s renewed easing cycle, alongside a weaker U.S. dollar and persistent geopolitical tensions, continues to drive volatility in the gold market.
Traders should remain cautious and adjust risk management strategies to navigate sharp price swings.
Additionally, gold pricing is highly sensitive to U.S. policy under President Trump, where tariff measures, fiscal uncertainty, and shifting geopolitical strategy amplify market repricing risks and reinforce safe‑haven demand.
H4 Chart:
M15 Analysis:
-> Swing: Bullish.
-> Internal: Bullish.
Price has printed according to my analysis dated 13 January 2026 where I mentioned, in alternative scenario, price to continue bullish.
Price continued bullish with very minimal pullback, therefore, I will not classify previous IBOS.
Price is currently trading within an established internal range, however, again, I will continue to monitor price with respect to depth of pullback.
Intraday expectation:
Price to trade down to either M15 or H4 demand zone, or discount of 50% internal EQ before targeting weak internal low, priced at 4,639.890.
Alternative scenario:
Price could potentially continue bullish.
Note:
Gold continues to exhibit elevated volatility as markets digest the Federal Reserve’s ongoing dovish tilt and persistent global geopolitical tensions.
With uncertainty remaining a dominant theme across global risk assets, traders should prioritise disciplined risk management, as abrupt price swings and liquidity pockets may become increasingly common.
Furthermore, recent tariff announcements from President Trump, particularly those directed at China, have added another layer of instability to the macro landscape. These policy developments have the potential to intensify market turbulence, heighten risk‑off flows, and trigger sharp intraday reversals or whipsaw‑like behaviour in gold.
M15 Chart:

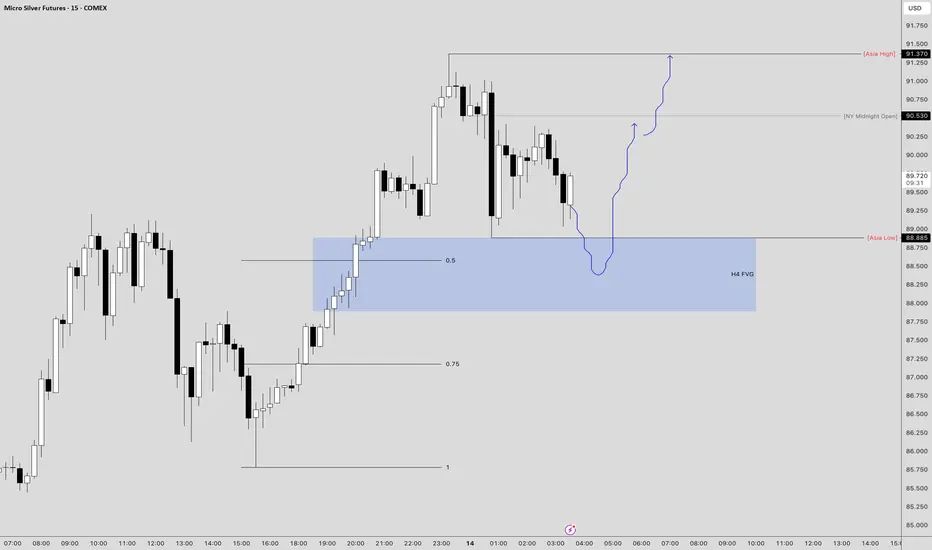
#SILVER Intraday Potential Bullish IdeaI will Look for opportunity in the lower tf after the price delivered into H4 FVG.
GBPUSD intraweek longtuesday cpi news delivered price lower to reach internal range liquidity
previous week engineered a swing high resting below h1 sibi left untapped

EURJPY smart money is here!Hi! A financier is at the screens - today I’ll show you the trade I entered.
In front of us is the EURJPY chart.
First, it’s worth noting that the inverse chart JPYEUR looks very weak. This tells us that the euro is indeed stronger now, and we may see growth.
Second, in mid-December we had a similar structure. I’ve highlighted these structures with a blue rectangle.
Inside these rectangles, an accumulation schematic based on Wyckoff formed. This suggests that we have potential for a reversal and solid upside. It’s also worth noting that the structures are similar to each other and exhibit fractality.
So overall, I opened a long position, aiming to trade it up to the high where we have a liquidity shelf.

GBPUSD – Weekly Cycle ContextGBPUSD continues to follow its long-term cyclical rhythm. The market remains bullish while the rising trendline holds, with price advancing away from the last cycle low.
That said, within the cycle framework, price is still expected to be pulled toward the next cycle bottom. A decisive break of the trendline would signal a shift in control and better align price with the declining phase of the cycle.
Until then, bullish structure remains intact - patience is key.
Watching for:
• Trendline break
• Momentum rollover
• Cycle timing alignment
Educational only, not financial advice.

**UPDATE** XAU/USD 13 January 2026 Intraday Analysis **Please ignore previous analysis as H4 CHoCH was repositioned**
H4 Analysis:
-> Swing: Bullish.
-> Internal: Bullish.
Price has printed according to my analysis dated 12 January 2026 where I mentioned, in alternative scenario, price to continue bullish in order to reposition CHoCH closer to more recent price action. This is how price printed.
Price is currently trading within an internal low and fractal high.
Intraday expectation:
Price to continue bearish, react at either discount of 50% internal EQ, or H4 supply zone before targeting weak internal high priced at 4,630.190.
Alternative scenario: Price to again continue bullish.
Note:
The Federal Reserve’s renewed easing cycle, alongside a weaker U.S. dollar and persistent geopolitical tensions, continues to drive volatility in the gold market.
Traders should remain cautious and adjust risk management strategies to navigate sharp price swings.
Additionally, gold pricing is highly sensitive to U.S. policy under President Trump, where tariff measures, fiscal uncertainty, and shifting geopolitical strategy amplify market repricing risks and reinforce safe‑haven demand.
H4 Chart:
M15 Analysis:
-> Swing: Bullish.
-> Internal: Bullish.
Price has printed according to my analysis dated 12 January 2026 where I mentioned, in alternative scenario, price to continue bullish in order to reposition CHoCH closer to more recent price action.
Price is currently trading within an established internal range, however, I will continue to monitor price with respect to depth of pullback.
Intraday expectation:
Price to trade down to either M15 or H4 demand zone, or discount of 50% internal EQ before targeting weak internal low, priced at 4,630.190.
Alternative scenario:
Price could potentially continue bullish.
Note:
Gold continues to exhibit elevated volatility as markets digest the Federal Reserve’s ongoing dovish tilt and persistent global geopolitical tensions.
With uncertainty remaining a dominant theme across global risk assets, traders should prioritise disciplined risk management, as abrupt price swings and liquidity pockets may become increasingly common.
Furthermore, recent tariff announcements from President Trump, particularly those directed at China, have added another layer of instability to the macro landscape. These policy developments have the potential to intensify market turbulence, heighten risk‑off flows, and trigger sharp intraday reversals or whipsaw‑like behaviour in gold.
M15 Chart:

XAU/USD 13 January 2026 Intraday AnalysisH4 Analysis:
-> Swing: Bullish.
-> Internal: Bullish.
Price has printed according to my analysis dated 12 January 2026 where I mentioned, in alternative scenario, price to continue bullish in order to reposition CHoCH closer to more recent price action, however, CHOCH positioning has remained the same.
Price is currently trading within an internal low and fractal high.
Intraday expectation:
Price to continue bearish, react at either discount of 50% internal EQ, or H4 supply zone before targeting weak internal high priced at 4,630.190.
Alternative scenario: Price to again continue bullish in order to reposition CHoCH closer to more recent price action.
Note:
The Federal Reserve’s renewed easing cycle, alongside a weaker U.S. dollar and persistent geopolitical tensions, continues to drive volatility in the gold market.
Traders should remain cautious and adjust risk management strategies to navigate sharp price swings.
Additionally, gold pricing is highly sensitive to U.S. policy under President Trump, where tariff measures, fiscal uncertainty, and shifting geopolitical strategy amplify market repricing risks and reinforce safe‑haven demand.
H4 Chart:
M15 Analysis:
-> Swing: Bullish.
-> Internal: Bullish.
Price has printed according to my analysis dated 12 January 2026 where I mentioned, in alternative scenario, price to continue bullish in order to reposition CHoCH closer to more recent price action.
Price is currently trading within an established internal range, however, I will continue to monitor price with respect to depth of pullback.
Intraday expectation:
Price to trade down to either M15 or H4 demand zone, or discount of 50% internal EQ before targeting weak internal low, priced at 4,630.190.
Alternative scenario:
Price to continue bullish to reposition ChOCH for H4 timeframe.
Note:
Gold continues to exhibit elevated volatility as markets digest the Federal Reserve’s ongoing dovish tilt and persistent global geopolitical tensions.
With uncertainty remaining a dominant theme across global risk assets, traders should prioritise disciplined risk management, as abrupt price swings and liquidity pockets may become increasingly common.
Furthermore, recent tariff announcements from President Trump, particularly those directed at China, have added another layer of instability to the macro landscape. These policy developments have the potential to intensify market turbulence, heighten risk‑off flows, and trigger sharp intraday reversals or whipsaw‑like behaviour in gold.
M15 Chart:

Silver and the 1980 Blow-Off Fractal – An Analytical NoteFrom a structural perspective, the long-term silver chart exhibits similarities to the 1970s–1980 cycle when evaluated through fractal behavior and Fibonacci extensions. Rather than serving as a price analogue, the historical comparison functions as a framework for understanding market phases: accumulation, acceleration, and terminal expansion.
The 1980 silver peak occurred within a macroeconomic environment defined by persistent inflation, negative real interest rates, fiscal expansion, and a delayed but ultimately aggressive monetary policy response. In contrast, the current cycle operates in a structurally different yet directionally comparable regime. Elevated sovereign debt levels, long-term fiscal deficits, and a policy bias toward financial stability have constrained the ability of central banks to maintain restrictive real rates for extended periods.
This monetary backdrop supports a regime of higher volatility in real assets, even as policy transmission remains uneven. Following a prolonged consolidation, silver has transitioned into an impulsive advance with rising momentum and shallower pullbacks—features consistent with late-cycle behavior observed in the historical fractal.
Fibonacci extensions derived from the secular low and the 2011 high define zones of structural relevance rather than directional targets. The former peak near the 1.0 extension represents a key equilibrium area, while higher extensions—particularly the 4.236 level—align with regions of increased instability and volatility in the 1980 analogue. In that cycle, price acceptance above such levels was brief and followed by rapid mean reversion.
Overall, the projection should be interpreted as a conditional analytical framework. It integrates price structure with macro and monetary context to highlight zones of rising instability, not deterministic outcomes, as silver potentially transitions from trend continuation toward terminal dynamics.
